Managing the Crisis: The FDIC and RTC Experience — Guide to Chapters
Beginning with 1980, each year is presented in a similar format. Each of the chapter elements is discussed below. Unless otherwise noted, information was derived from the annual reports
Each chapter includes an “FDIC at a Glance” chart. It presents primary data elements of the year and the preceding year and shows the percentage changes between the years. A summary chart with information for all years 1980-2003 is shown below.
| FDIC at a Glance ($ in Millions) | |||
|---|---|---|---|
| 12/31/XX | 12/31/XX | Percent Change | |
| Number of Bank Failures | See A | ||
| Assistance to Open Banks | See B | ||
| Total Failed and Assisted Banks | See C | ||
| Total Assets of Failed and Assisted Banks | See D | ||
| Losses on Failed and Assisted Banks | See E | ||
| Losses as a Percent of Total Assets | See F | ||
| Assets in Liquidation | See G | ||
| FDIC Staffing | See H | ||
| Number of Problem Banks | See I | ||
| Deposit Insurance Fund Balance | See J | ||
| Deposit Insurance Fund Balance as a Percent of Insured Deposits | See K | ||
| Savings Insurance Fund Balance | See L | ||
| Savings Insurance Fund Balance as a Percent of Insured Deposits | See M | ||
Source: FDIC, 1980 Annual Report and Reports from FDIC Division of Finance and FDIC Division of Research and Statistics.
This number represents the total number of banks that actually failed. Back to Table
This number represents the number of banks that were provided financial assistance but were not actually closed and placed into receivership. Significant cases are discussed in the relevant years. Assistance to Open Banks includes assistance to commercial and mutual savings banks. Back to Table
C. Total Failed and Assisted Banks
This is the total of A. and B. Back to Table
D. Total Assets of Failed and Assisted Banks
Total assets is a universal measure of the size of financial institutions and indicates the relative size of the problems handled by the FDIC. Back to Table
E. Estimated Losses on Failed and Assisted Banks during the Year
This number represents the estimated net loss to the FDIC on the banks that failed in that year. The figure is determined by calculating actual disbursements and subtracting actual and estimated recoveries. This figure is routinely adjusted with updated information from new appraisals and asset sales, which ultimately affect the asset values and the projected recoveries. All estimates are based upon the latest data available and are as of December 31, 2003. For terminated receiverships, the loss figure listed represents the actual loss. This applies to all receiverships prior to 1988. Back to Table
F. Estimated Losses as a % of Total Assets
This number is roughly indicative of the FDIC’s efficiency in disposing of failing institutions and their assets, although differences in failed bank profiles, asset types, and economic conditions also affect the recovery rate. Back to Table
This number is the total of assets held by the FDIC for liquidation. It is a book value number only and does not indicate estimated asset values. Back to Table
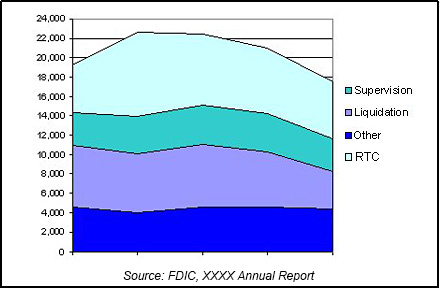
This number is the total of FDIC staff, including both permanent and temporary employees. Each chapter includes a graph indicating staffing trends and divisional totals for that particular year. Back to Table
This is the number of open commercial banks in each year which are given a composite CAMEL rating by bank examiners of “4” or “5.” The CAMEL rates each element of Capital, Assets, Management, Earnings, and Liquidity from “1” to “5,” with “1” being the best and “5” being the worst. A composite rating is then assigned, and banks in the two lowest categories are placed on the FDIC’s problem bank list. Back to Table
J. Bank Insurance Fund Balance
Through 1988, this is the amount of money in the deposit insurance fund. Beginning in 1989, it is the amount of money in the Bank Insurance Fund (BIF) only and does not include the Savings Association Insurance Fund (SAIF). Back to Table
K. Bank Insurance Fund Balance as a % of Insured Deposits
This number is roughly representative of the FDIC’s ability to pay insured deposits of failed banks. A coverage ratio of 1.25% is considered most appropriate. Back to Table
L. Savings Association Insurance Fund Balance
This number is the amount of money in the Savings Association deposit insurance fund. Back to Table
M. Savings Association Insurance Fund Balance as a % of Insured Deposits
This number is roughly representative of the FDIC’s ability to pay insured deposits of failed savings associations. A coverage ratio of 1.25% is considered most appropriate. Back to Table
Notable Events
Significant events that occurred during the year are reflected here.
Economic/Banking Conditions
Regional and national economic trends are detailed here. The state of the banking industry during the year is discussed here, including the number of failures, number of problem institutions, and number of newly chartered institutions. The following tables detail the number and total assets of all FDIC insured commercial and savings banks in the year. They also lists the average Return on Assets and Return on Equity per type of institution per year.
Open Financial Institutions Insured by FDIC 1980-1994
| Commercial Banks - FDIC Regulated | |||
|---|---|---|---|
| Item | 19XX | 19XX | Percent Change |
| Number | |||
| Total Assets | |||
| Return on Assets | |||
| Return on Equity | |||
| Savings Banks – FDIC Regulated | |||
|---|---|---|---|
| Item | 19XX | 19XX | PercentChange |
| Number | |||
| Total Assets | |||
| Return on Assets | |||
| Return on Equity | |||
| Savings Associations – FHLBB Regulated | |||
|---|---|---|---|
| Item | 19XX | 19XX | Percent Change |
| Number | |||
| Total Assets | |||
| Return on Assets | |||
| Return on Equity | |||
Source: Reports from FDIC Division of Research and Statistics.
Open Financial Institutions Insured by FDIC 1995-2003
| BIF Members | |||
|---|---|---|---|
| XXXX | XXXX | Percent Change | |
| Number | |||
| Total Assets | |||
| Return on Assets | |||
| Return on Equity | |||
| SAIF Members | |||
|---|---|---|---|
| XXXX | XXXX | Percent Change | |
| Number | |||
| Total Assets | |||
| Return on Assets | |||
| Return on Equity | |||
| US Branches of Foreign Banks | |||
Source: FDIC Quarterly Banking Profile.
Bank Failures and Assistance to Open Banks
This section provides information about the failed and assisted institutions in the year. Transaction types and significant resolutions are discussed where appropriate. The following table outlines the failures and assisted transactions by transaction type. It shows the number of transactions, the total assets, and the estimated loss by type. The expected loss on the failed institutions was last estimated on December 31, 2003.
| Estimated Losses by Transaction Type | ||||
|---|---|---|---|---|
| Transaction Type | Number of Transactions | Total Assets | Estimated Loss as of 12/31/03 | Estimated Losses as a Percent of Assets |
| OBAs | ||||
| P&As | ||||
| IDTs | ||||
| Payoffs | ||||
| Totals | ||||
Payments to Depositors and Other Creditors
This section contains information concerning the number of failing bank and assisted transactions by type of transaction since the FDIC began operations in 1934. Information detailing the amount of disbursements made by the FDIC and the recoveries effected by the FDIC since 1934 is also shown. The total amount of deposits and the number of deposit accounts are shown for the failures and assistances in the year.
Interesting sidebars are often displayed as inset boxes throughout the text. These boxes provide additional information for clarification purposes and correspond to the topic immediately to the left or above the box.
Asset Disposition
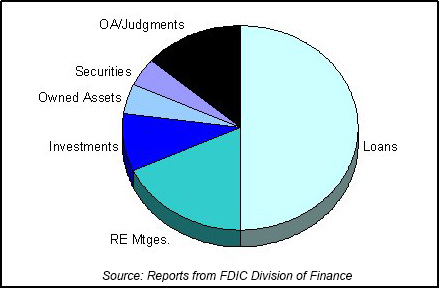
Information about the FDIC’s assets in liquidation each year is located here. When applicable, information for the FSLIC Resolution Fund and the Savings Association Insurance Fund is detailed. Significant collection activity is noted in various years. The table below details the book value of assets in liquidation at the beginning of the year, assets acquired from failed institutions, principal collections, and the book value of assets in liquidation at the end of the year. The estimated value of the assets was obtained from the Division of Finance. The following chart is a graphical illustration of the asset mix.
| FDIC End of the Year Assets in Liquidation | ||||||
|---|---|---|---|---|---|---|
| Asset Type | 12/31/XX Book Value | 19XX Assets Acquired | 19XX Prin. Coll. | 19XX Write Downs | 12/31/XX Book Value | 12/31/XX Est. Recovery Value |
| Loans | ||||||
| Commercial Loans | ||||||
| Mortgage Loans | ||||||
| Other Loans | ||||||
| Real Estate Owned | ||||||
| Charge-Offs | ||||||
| Investments | ||||||
| Judgments | ||||||
| Securities | ||||||
| Other Assets | ||||||
| Other Assets/Judgments | ||||||
| Totals | ||||||
Source: Reports from FDIC Division of Finance.
FDIC End of Year Asset Mix

Chart 3-2

FDIC Staffing
Insurance Fund and Staffing
This section details changes over the previous year in the deposit insurance fund and the staffing levels. Staffing levels are listed for the Division of Supervision, the Division of Liquidation, other FDIC divisions, and the Resolution Trust Corporation. As division names changed, the chart to the left of this paragraph was updated. The chart shows the five-year trend of the staffing levels for the Division of Supervision, the Division of Liquidation, other FDIC divisions, and the Resolution Trust Corporation.
Private Resolutions
When there were private resolutions involving individual state insurance funds, the information is provided here.
Thrifts
In the years prior to the Resolution Trust Corporation, information concerning the thrift industry is displayed under this heading.
Resolution Trust Corporation
Each chapter includes an “RTC at a Glance” chart. It presents primary data elements of the year and the preceding year, and shows the percentage changes between the years. A summary chart with information for all years 1989-1994 is shown below.
| RTC at a Glance | |||
|---|---|---|---|
| 12/31/XX | 12/31/XX | Percent Change | |
| Number of Conservatorships at the beginning of the year | |||
| Number of Conservatorships added during the year | |||
| Thrifts in the ARP Program |
|||
| Total of allthrift takeovers | See A | ||
| Conservatorships resolved during the year | |||
| Thrifts in the ARP Program |
|||
| Total of thrift resolutions | |||
| Conservatorships at the end of the year | |||
| Total Assets at takeover | |||
|---|---|---|---|
| 12/31/XX | 12/31/XX | Percent Change | |
| Conservatorships | |||
| Thrifts in the ARP Program | |||
| Total | See B | ||
| Estimated Losses on thrift resolutions | |||
| Estimated Losses as a Percent of Total Assets | |||
| Assets in Liquidation | |||
|---|---|---|---|
| 12/31/XX | 12/31/XX | Percent Change | |
| Conservatorships | |||
| Receiverships | See C | ||
| Total | |||
| RTC Staffing | |||
Source: RTC Annual Reports and Reports from FDIC Division of Research and Statistics.
This section recaps the number of thrift institutions at the beginning of the year; the number of thrifts added to the conservatorship program during the year; and the number of thrifts that were taken over but not placed into conservatorship. The result of the activity during the year yields the total number of thrifts taken over in the year. Back to Table
This section recaps the total assets of the failing thrifts at the time of takeover whether they were placed into conservatorship or resolved through the ARP program. This section also details the total estimated losses on the thrifts that failed in that particular year. The estimated loss is determined by calculating actual disbursements and subtracting actual and estimated recoveries. This figure is routinely adjusted with updated information from new appraisals and asset sales, which ultimately affect the asset values and the project recoveries. the estimate of loss for all thrifts is derived from data obtained as of December 31, 1995. Back to Table
This section recaps the total dollar amount of assets in liquidation from both conservatorships and receiverships. The staffing number is also shown. Back to Table
Notable Events
Significant events that occurred in the year are reflected here.
S&L Resolutions
This section provides information concerning the S&L resolutions in the year. The following table outlines the S&L resolutions by transaction type. It shows the number of transactions, the total assets, and the estimated loss by type. The estimated loss is based on estimates as of December 31, 1995.
| Estimated Losses by Transaction Type | ||||
|---|---|---|---|---|
| Transaction Type | Number of Transactions | Total Assets | Estimated Loss as of 12/31/95 | Estimated Losses as a Percent of Assets |
| P&As | ||||
| IDTs | ||||
| Payoffs | ||||
| Totals | ||||
Source: Reports from FDIC Division of Research and Statistics.
The following table shows the Conservatorships and Receiverships at the beginning of the year and the changes throughout the year.
| Conservatorships | |
|---|---|
| Item | Total |
| In Conservatorship at 12/31/XX | |
| Conservatorships added in XXXX | |
| Subtotal | |
| Conservatorships resolved in XXXX (New Receiverships) | |
| Conservatorships remaining 12/31/XX | |
| Receiverships | |
|---|---|
| Item | Total |
| Receiverships as of 12/31/XX | |
| New Receiverships that were previously Conservatorships in XXXX | |
| New Receiverships that were resolved through ARP in XXXX | |
| Total New Receiverships during XXXX | |
| Total Receiverships as of 12/31/XX | |
Source: RTC Annual Reports.
Payments to Depositors and Other Creditors
This section contains information concerning the number of thrift resolutions by type of transaction since the RTC began operations in 1989. The total amount of deposits and the number of deposit accounts are shown for the thrift resolutions in the year.
Asset Disposition
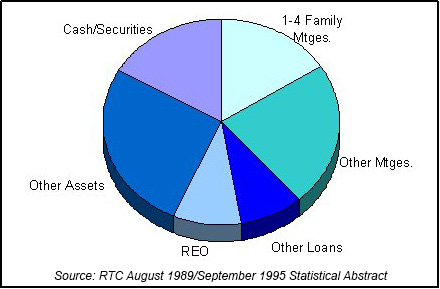
Information about the RTC’s assets in liquidation each year is located here. Where applicable, information concerning outside contracting is detailed. The table below shows the RTC’s assets in liquidation and the following chart shows the asset mix.
| RTC End of the Year Assets in Liquidation | ||||||
|---|---|---|---|---|---|---|
| Asset Type | 12/31/XX Total Book Value | Assets Acq'd During the Year | 19XX Collections | 19XX Losses | 12/31/XX Total Book Value | Memo Item |
| 1-4 Family Mtges | ||||||
| Other Mtges | ||||||
| Other Loans | ||||||
| R/Estate Owned | ||||||
| Other Assets | ||||||
| Cash/Securities | ||||||
| Totals | ||||||
RTC End of Year Asset Mix

Funding and Staffing
This section details Congressional funding for the Resolution Trust Corporation during the year, as well as changes in staffing levels for the Resolution Trust Corporation.
Table of Contents

