
Managing the Crisis: The FDIC and RTC Experience — Chronological Overview
Chapter Seventeen: 1994
Chairman Ricki Helfer is quoted in the FDIC's 1994 annual report as stating, “The banking crisis of recent years is now behind us. After reporting repeated record earnings, the banking industry as a whole last year was in the best financial condition it has ever experienced.”
Table 17-1
| 1993 - 1994: FDIC at a Glance ($ in Millions) | |||
|---|---|---|---|
| 12/31/93 | 12/31/94 | Percent Change | |
| Number of Bank Failures | 41 | 13 | -68.29% |
| Assistance to Open Banks | 0 | 0 | 0.00% |
| Total Failed and Assisted Banks | 41 | 13 | -68.29% |
| Total Assets of Failed and Assisted Banks | $3,828.9 | $1,463.9 | -61.77% |
| Estimated Losses on Failed and Assisted Banks |
$646.1 | $179.0 | -72.30% |
| Estimated Losses as a Percent of Total Assets | 16.87% | 12.23% | -27.50% |
| Assets in Liquidation | $28,015.1 | $16,737.9 | -40.25% |
| FDIC Staffing | 14,220 | 11,627 | -18.23% |
| Number of Problem Banks | 472 | 264 | -44.07% |
| Bank Insurance Fund Balance | $13,121.6 | $21,847.8 | 66.50% |
| Bank Insurance Fund Balance as a Percent of Insured Deposits | 0.69% | 1.15% | 66.67% |
| Savings Insurance Fund Balance | $1,155.7 | $1,936.7 | 67.58% |
| Savings Insurance Fund Balance as a Percent of Insured Deposits | 0.17% | 0.28% | 64.71% |
Source: FDIC, 1994 Annual Report and Reports from FDIC Division of Finance and Division of Research and Statistics.
Notable Events
A number of significant events occurred in 1994.
- On March 14, the accounting firm of Deloitte & Touche agreed to pay $75.2 million to the FDIC and $236.8 million to the RTC to settle claims based on alleged accounting and auditing failures at banks and savings associations, resolving 18 pending suits.
- On March 17, the FDIC sold $762 million in performing commercial real estate loans in its first securitized loan offering.
- March 31 marked the end of the first quarter since 1978 with no bank failures.
- On July 7, the FDIC placed The Meriden Trust and Safe Deposit Company, Meriden, Connecticut, in receivership using the FDIC's self-appointment power authority for the first time.
- On August 9, KPMG Peat Marwick, LLP, an accounting firm, agreed to pay $58.5 million to the FDIC and $128 million to the RTC to settle claims based on alleged accounting and auditing failures at banks and savings associations, resolving seven pending suits.
- On October 7, Ricki Tigert (who became Ricki Helfer later that same year) was sworn in as the 16th chairman of the FDIC, and Andrew C. Hove, Jr., was sworn in for a second term as vice chairman. Ms. Tigert was the first woman ever to head a federal banking agency. Before her appointment, Ms. Tigert had been a partner in the Washington office of the law firm of Gibson, Dunn, and Crutcher, specializing in banking and finance. From 1985 to 1992, she was the chief international lawyer for the Board of Governors of the Federal Reserve System.
- On November 7, a special task force was created to analyze and make recommendations regarding the risks posed to banks by derivatives and other investment products.
- On November 9, the FDIC began developing a five-year strategic plan.
Economic/Banking Conditions
In 1994, the U.S. economy continued to grow at a moderate pace with Gross Domestic Product, increasing at a rate of 3.5 percent.17-1 Employment growth increased from 1.4 percent in 1993 to 2.4 percent in 1994 while the unemployment rate fell to 6.1 percent from 6.9 percent in 1993.17-2 Interest rates increased but remained low with the discount rate at 3.6 percent and the 30-year mortgage rate at 8.4 percent.17-3 The inflation rate continued to decline and was at 2.3 percent, which was about 7 percent lower than inflation rates in the early 1980s.17-4 Real estate markets continued to fare well. Home sales were up 3.3 percent for the year, and housing starts were up 13.1 percent. The office vacancy rate declined for the third year in a row to 15.3 percent, which was the lowest level in 10 years.17-5
The Southwest banking industry continued to recover, and for the first time since 1981 there was not a bank failure in the region. Nonperforming assets relative to total assets continued to fall and were the same as the national level. Net charge-offs on loans and leases as a percentage of assets also continued to decrease and fell below the U.S. banking industry level. For the second year in a row, total loans and leases relative to total assets increased, but remained below the national level. Those increases included total real estate loans, commercial real estate loans, and the first increase in the Commercial and Industrial (C&I) loan ratio in 10 years. The Southwest economy was healthy, as was most of the country. The increase in loan activity in the region proved that expansion was resuming and the Southwest had recovered from the economic crisis in the 1980s.
Total loans and leases in the Northeast remained steady, although above national levels, at almost 62 percent of assets. Total real estate loans, relative to assets, were more than 20 percent above national levels and commercial real estate loans were at 12 percent of assets. C&I loans continued to decrease relative to assets and fell further below the rest of the U.S. The health of the banking industry in the region was improving, but not quite back to levels attained around the country. The return on assets for the region's banks increased for the fourth year in a row to 0.8 percent. Nonperforming assets and net charge-offs on loans, both as percentages of total assets, continued to fall. There were four failures in the region in 1994, accounting for $15 million in estimated losses, only 10 percent of total U.S. failure costs. In addition, only 6 percent of all Northeast banks were considered problem banks.
California was experiencing the end of its economic downturn of the early 1990s. In 1994, there was a slight increase in construction employment in California, but defense-related employment continued to decrease and fell below 500,000.17-6 Over the 38-month recession, California had lost 25 percent of its aerospace high tech employment, 21.5 percent of its construction employment, and 14 percent of its manufacturing employment. C&I loans and total loans and leases, as percentages of assets, continued to decline for the state. Office vacancy rates in the state were declining, but Los Angeles and San Diego still had rates above the national level.17-7 Completions in the commercial real estate market were virtually nonexistent.17-8
The recession, while affecting the earnings of the California banking sector, was relatively mild in terms of bank failures. In 1994, eight banks failed in the state. Declining interest rates assisted in cushioning the impact of the recession on the number of bank failures. The three remaining Big Four were able to withstand the pressures of the recession through diversification of statewide operations. On the other hand, community banks and recently chartered banks that pursued aggressive real estate lending strategies were more affected by the recession. The bank performance ratios for the three remaining Big Four banks were excellent, while the performance of the smaller banks continued to lag. Bank of America, First Interstate, and Wells Fargo Bank posted an average return on assets of 1.25, which was well above the national level compared to the 23 basis point return on assets of the entire California banking industry. The number of problem banks in the state remained high at 21 percent of the total number of banks in California. Nonperforming assets continued to fall, but Southern California's level was still more than 4 percent of assets compared to the national median of 1.2. Net charge-offs on loans and leases as a percentage of assets began to decline although they still remained higher than the national median.
Lending activity in California, though slowing, continued to outperform the rest of the country. Although they were above national levels, C&I loans, relative to assets in the state, continued to decrease to 11.8 percent, while total real estate loan and commercial total real estate loan ratios increased to 39.9 percent and 27 percent, respectively. The number of new housing permits remained steady, and median home prices leveled off just below $200,000, well above the national level of $109,400.17-9
Despite California's problems, the U.S. banking industry had experienced an almost complete turnaround from the massive problems of the previous decade. In 1994, insured commercial banks reported a record net income of $44.7 billion, an increase of 3.7 percent over 1993 earnings. More than 96 percent of all commercial banks were profitable in 1994, due mainly to higher net interest income and lower provisions for future loan losses. The number of insured commercial banks fell to 10,451 at the end of 1994, for a net reduction of 507 banks. Mergers and consolidations accounted for a reduction of approximately 550 banks. Only 50 new bank charters were issued, the fewest charters since 1943. The number of Bank Insurance Fund (BIF) member banks on the FDIC's problem list declined for the third consecutive year, shrinking to 247 commercial and 17 savings banks. Those 264 banks had assets of $42 billion at the end of the year. In addition, there were 54 Savings Association Insurance Fund (SAIF) insured savings banks with combined assets of $31 billion on the FDIC's problem list by the end of 1994.
At the end of 1994, there were 2,152117-10 savings banks insured by the FDIC. Those savings banks held assets of just over $1 trillion, which was 20 percent of all assets of FDIC insured financial institutions. Although there was a $1.9 billion decline in provisions for future loan losses, that improvement was offset by a $1.7 billion drop in net interest income of savings banks. One of every four large thrifts with assets greater than $5 billion lost money in 1994, although more than 93 percent of all savings banks reported a net profit.
Table 17-2 shows the number and total assets of FDIC insured institutions, as well as their profitability as of the end of 1994.
Table 17-2
Open Financial Institutions Insured by FDIC ($ in Billions)
| Commercial Banks - FDIC Regulated | |||
|---|---|---|---|
| Item | 1993 | 1994 | Percent Change |
| Number | 10,958 | 10,451 | -4.63% |
| Total Assets | $3,706.2 | $4,010.5 | 8.21% |
| Return on Assets | 1.20% | 1.15% | -4.17% |
| Return on Equity | 15.34% | 14.61% | -4.76% |
| Savings Banks - FDIC Regulated | |||
|---|---|---|---|
| Item | 1993 | 1994 | Percent Change |
| Number | 593 | 610 | 2.87% |
| Total Assets | $226.1 | $234.5 | 3.72% |
| Return on Assets | 0.95% | 1.01% | 6.32% |
| Return on Equity | 11.09% | 10.93% | -1.44% |
| Savings Associations - OTS Regulated | |||
|---|---|---|---|
| Item | 1993 | 1994 | Percent Change |
| Number | 1,669 | 1,542 | -7.61% |
| Total Assets | $774.8 | $774.1 | -0.09% |
| Return on Assets | 0.63% | 0.55% | -12.70% |
| Return on Equity | 8.61% | 7.26% | -15.68% |
Source: Reports from FDIC Division of Research and Statistics.
Bank Failures
Only 13 commercial and savings banks with $1.5 billion in assets were closed in 1994. That was the smallest number of failures since 1981 when only 10 banks failed. Eight of the 13 failures in 1994 were in California. There were no instances of assistance to open banks in 1994.
In each of the 13 commercial and savings banks that failed in 1994, the FDIC arranged a purchase and assumption (P&A) transaction under which some or all of the deposits were assumed by another institution, avoiding any payoff of insured deposits. However, in eight of the 13 failures, only insured deposits passed to the assuming bank. Therefore, depositors received less than 100 cents on each dollar above the $100,000 insured amount, although further distributions were projected. In all, $8.3 million in advance dividend payments were made to uninsured depositors in 1994. Estimated losses to BIF for those 13 banks were $139 million at the time of resolution, or 9.93 percent of the total assets in those institutions. A more recent estimate of losses is shown in Table 17-3.
Table 17-3
| 1994 Estimated Losses by Transaction Type ($ in Millions) | ||||
|---|---|---|---|---|
| Transaction Type | Number of Transactions | Total Assets | Estimated Loss* as of 12/31/03 | Estimated Losses as a Percent of Assets |
| P&As | 13 | $1,463.9 | $179.0 | 12.23% |
Source: Reports from FDIC Division of Research and Statistics.
During 1994, the FDIC used the authority granted to it in 1989 to assess cross guarantees against commonly controlled insured institutions. The FDIC used that authority against Coastal Savings Bank, Portland, Maine, part of the same holding company structure as Suffield Bank, Suffield, Connecticut. In November 1994, the FDIC agreed to settle its claim for the $90 million cost to BIF caused by Suffield's insolvency in exchange for a $9 million interest bearing promissory note from the holding company, First Coastal Corporation.
In addition, the FDIC, for the first time, used its power (provided by the Federal Deposit Insurance Corporation Improvement Act of 1991) to close an institution and appoint itself receiver. The FDIC assessed The Meriden Trust and Safe Deposit Company (Meriden Trust), Meriden, Connecticut, an affiliate of Central Bank, Meriden, Connecticut, for the $152 million loss to BIF from the failure of Central Bank. Both Meriden Trust and Central Bank were owned by Cenvest, Inc. Meriden Trust was an insured institution based on previous deposit activities, although it no longer made loans or took deposits from the public. Cenvest challenged the FDIC in court, partly on the basis that Meriden Trust was not an insured depository institution. The U.S. District Court in Connecticut ruled in favor of the FDIC on June 30, 1994, and the FDIC closed Meriden Trust on July 7, 1994. At the time of closing, Meriden Trust had total assets of approximately $3.2 million, but had a franchise value substantially higher because it primarily operated a trust department that managed $180 million in over 500 accounts. With the closing of Meriden Trust, the FDIC used its bridge bank authority to establish a new bank and then later sold it in November 1994 for a premium of $7.8 million.
The FDIC's resolution efforts in 1994 resulted in the immediate return to the private sector of approximately one third of the $1.4 billion in assets from the 13 banks that failed during 1994, or about $400 million.
In 1994, the FDIC promulgated several significant regulations, including:
- Standardizing bank real estate appraisal rules with other regulators by increasing the threshold to $250,000 from $100,000 (raised from $50,000 to $100,000 in 1991) for loans that require an appraisal;
- Requiring advance notice of an institution's conversion from mutual to stock ownership;
- Requiring foreign banks to obtain approval from the FDIC and the Federal Reserve Board for an insured state branch to engage in or to continue an activity not permissible for a federally licensed branch of a foreign bank; and
- Amending risk-based capital standards by recognizing the risk-reducing benefits of qualifying bilateral netting contracts.
The Riegle Community Development and Regulatory Improvement Act was signed into law in 1994, authorizing funding for community development financial institutions and providing regulatory and paperwork relief for financial institutions. The Riegle-Neal Interstate Banking and Branching Efficiency Act of 1994 was also enacted, authorizing interstate banking and branching for United States and foreign banks over a three-year period.
Payments to Depositors and Other Creditors
In the 13 banks that failed or were assisted in 1994, deposits totaled $1.4 billion in 144,742 deposit accounts. Dividends paid on all active receiverships totaled $7.2 billion in 1994.
Of the 2,121 insured bank resolutions17-11 since the FDIC began operations in 1934, 1,237 were P&A transactions and 202 were whole bank deals. Deposit payoff transactions accounted for 603 cases, of which 176 were insured deposit transfers (IDTs). There were also 79 open bank assistance (OBA) transactions.
Total disbursements by the FDIC since January 1, 1934, amounted to $103.5 billion. Of that amount, the FDIC recovered $67 billion for a net loss of $36.5 billion.
Asset Disposition
At the beginning of 1994, the FDIC held $28 billion in assets from failed institutions. That included $25.2 billion in BIF assets, $2.7 billion in FSLIC Resolution Funds (FRF) assets, and $72 million in assets from SAIF-insured institutions. During the year, the FDIC acquired an additional $1.9 billion in assets from 13 bank failures. Another $695 million was repurchased from FRF institutions. The FDIC collected $6.7 billion during the year, and the ending balance for assets in liquidation was $16.7 billion, a reduction of $11.3 billion. Of the $16.7 billion, $14.9 billion was assets in liquidation for BIF, $1.8 billion for FRF, and $15 million for SAIF.
During 1994, the FDIC sold or otherwise disposed of a large amount of its asset inventory from failed institutions. Real estate properties sold for a total of $1.2 billion, yielding a recovery of 91 percent of average appraised value. In addition, the FDIC sold $762 million of performing commercial mortgage loans through securitization, providing purchasers a partial guarantee backed by BIF to cover credit losses. More than 63,780 loans and other assets totaling $4.6 billion in book value were sold through asset marketing efforts, with net sales proceeds during 1994 representing 101 percent of appraised value.
The FDIC's Affordable Housing Program received $7 million in Congressional appropriations in 1994 and assisted qualified buyers with the purchase of 681 one-to-four family properties. In addition, ten multi-family properties consisting of 286 units were sold through the program to nonprofit organizations and public agencies that provide rental housing to low income households.
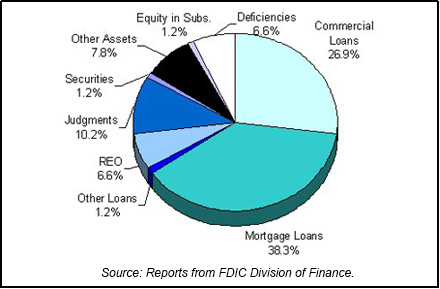
Table 17-4 shows the FDIC's assets in liquidation and Chart 17-1 shows the asset mix.
Table 17-4
| 1994 FDIC End of the Year Assets in Liquidation ($ in Billions*) | ||||||
|---|---|---|---|---|---|---|
| Asset Type | 12/31/93 Book Value | 1994 Assets Acquired | 1994 Prin. Coll. | 1994 Write Downs | 12/31/94 Book Value | 12/31/94 Est. Rec. Value |
| Commercial Loans | $10.0 | -$1.9 | $1.6 | $2.0 | $4.5 | $2.3 |
| Mortgage Loans | 10.1 | 2.2 | 3.5 | 2.4 | 6.4 | 4.4 |
| Other Loans | 0.5 | 0.0 | 0.1 | 0.2 | 0.2 | 0.2 |
| Real Estate Owned | 2.4 | 0.1 | 0.8 | 0.6 | 1.1 | 0.8 |
| Judgments | 1.8 | 0.9 | 0.1 | 0.9 | 1.7 | 0.2 |
| Securities | 0.2 | 0.1 | 0.1 | 0.0 | 0.2 | 0.0 |
| Other Assets | 1.9 | -0.1 | 0.0 | 0.5 | 1.3 | 0.3 |
| Equity in Subs. | 0.9 | -0.1 | 0.5 | 0.1 | 0.2 | 0.1 |
| Deficiencies | 0.2 | 1.4 | 0.0 | 0.5 | 1.1 | 0.1 |
| Totals | $28.0 | $2.6 | $6.7 | $7.2 | $16.7 | $8.4 |
Source: Reports from FDIC Division of Finance.
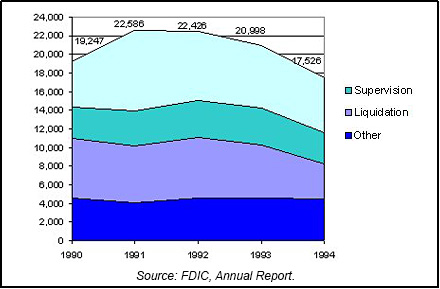
Insurance Fund and Staffing
The BIF had another positive year, ending 1994 with a record high of $21.8 billion. The SAIF also grew to $1.9 billion from $1.2 billion at the end of 1993. FDIC staffing, however, decreased 18.2 percent to 11,627, continuing a decline since reaching its historical high of 15,585 in the second quarter of 1993. The Division of Depositor and Asset Services (liquidation) had 3,796 employees, which was significantly down from 5,665 at year-end 1993. The Division of Supervision staff also decreased from 3,971 to 3,369 at year-end 1994. Total staffing including 5,899 RTC employees equaled 17,526. Chart 17-2 shows the staffing levels for the past five years.
A buyout was offered to targeted groups of employees corporate-wide in the late summer of 1994 and was accepted by 72 employees. That downsizing was in response to the decreased workload from bank failures and the eventual transfer of operations and personnel from the RTC. The FDIC placed available permanent employees of the RTC as vacancies occurred. A total of 132 permanent employees of the RTC returned to the FDIC during 1994. The FDIC and the RTC worked together in planning for the return of the RTC employees and operations, establishing joint committees, task forces, and working groups to develop transition strategies.
Table 17-5
Resolution Trust Corporation
| 1993 - 1994: RTC at a Glance ($ in Millions) | |||
|---|---|---|---|
| 12/31/93 | 12/31/94 | Percent Change | |
| Number of Conservatorships at the beginning of the year | |||
| Number of Conservatorships added during the year | |||
| Thrifts in the ARP Program | |||
| Total of all thrift takeovers | |||
| Total of thrift resolutions | |||
| Conservatorships resolved during the year | |||
| Conservatorships at the end of the year | |||
| Total Assets at Takeover | |||
|---|---|---|---|
| 12/31/93 | 12/31/94 | Percent Change | |
| Conservatorships | $6,061 | $0 | -100.00% |
| Thrifts in the ARP Program | $44 | $129 | 193.18% |
| Total | $6,105 | $129 | -97.89% |
| Estimated losses on thrift resolutions |
$609 | $15 | -97.54% |
| Estimated losses as a percent of total assets | 9.97% | 11.93% | 19.66% |
| Assets in Liquidation | |||
|---|---|---|---|
| 12/31/93 | 12/31/94 | Percent Change | |
| Conservatorships | $23,166 | $2,067 | -91.08% |
| Receiverships | $40,664 | $22,900 | -43.68% |
| Total | $63,830 | $24,967 | -60.89% |
| RTC Staffing | 6,778 | 5,899 | -12.97% |
Source: RTC, 1994 Annual Report and Reports from FDIC Division of Research and Statistics.
Notable Events
On March 31, 1994, Deputy Chief Executive Officer John E. Ryan became deputy and acting chief executive officer, replacing Roger C. Altman. Mr. Ryan joined the RTC on January 4, 1994.
In 1994, the RTC completed the sale of the second National Land Fund, a $370 million partnership structure in which the RTC retained a limited partnership interest and shared in the appreciation of land assets.
The RTC conducted the following three national nonperforming loan auctions in Kansas City, Missouri:
- In April, the RTC sold 5,809 loans with a total book value of about $318 million, yielding a $191 million recovery;
- In September, the RTC sold 8,814 loans with a total balance of $399 million, yielding a $223 million recovery; and
- In December, the RTC sold 9,786 loans with a total balance of $370 million, yielding a $229 million recovery.
The RTC had nearly completed the conservatorship program. Through 1994, there had been 744 resolutions, of which 705 had been conservatorships prior to resolution.
S&L Resolutions
In 1994, the RTC resolved 64 thrifts. At the start of 1994, 63 thrifts with total assets of $23.2 billion were in the RTC's conservatorship program. No new thrifts entered the program during 1994; 62 conservatorships with total assets of $21.1 billion were resolved, leaving only one conservatorship with total assets of $2.1 billion in the program at the end of 1994. Of the 64 resolutions, 62 institutions were in the conservatorship program; two were resolved through the Accelerated Resolutions Program (ARP).
In 1994, 61 of the 64 thrift resolutions were P&A transactions. In 39 of those resolutions, all deposits were transferred to the acquirers, while in 22 of those resolutions, only the insured deposits were transferred. The other three resolutions were payoffs.
The 61 thrifts resolved in P&A transactions had total assets of $15.2 billion. The three payoffs in 1994 had total assets of $115.6 million.
The resolutions saved an estimated $1.1 billion over the cost of a payoff of all insured deposits. RTC funding for the resolutions totaled $17.2 billion, including conservatorship advances of $4.2 billion, for a net funding cost of $16.1 billion.
Losses per transaction type are shown in Table 17-6 and Table 17-7 shows conservatorships and receiverships at year-end 1994.
Table 17-6
| 1994 Losses by RTC Transaction Type ($ in Millions) | ||||
|---|---|---|---|---|
| Transaction Type | Number of Transactions | Total Assets | Loss* as of 12/31/95 | Estimated Losses as a Percent of Assets |
| P&As | 61 | $15,196.5 | $5,963.6 | 39.24% |
| Payoffs | 3 | 115.6 | 42.8 | 37.02% |
| Totals | 64 | $15,312.1 | $6,006.4 | 39.23% |
Source: Reports from FDIC Division of Research and Statistics.
Table 17-7
| Conservatorships | |
|---|---|
| Item | Total |
| In Conservatorship at 12/31/93 | 63 |
| Conservatorships added in 1994 | 0 |
| Subtotal | 63 |
| Conservatorships resolved in 1994 (New Receiverships) | 62 |
| Conservatorships remaining 12/31/94 | 1 |
| Receiverships | |
|---|---|
| Item | Total |
| Receiverships as of 12/31/93 | 680 |
| New Receiverships that were previously Conservatorships in 1994 | 62 |
| New Receiverships that were resolved through ARP in 1994 | 2 |
| Total Receiverships during 1994 | 64 |
| Total Receiverships as of 12/31/94 | 744 |
Source: RTC, 1994 Annual Report.
Payments to Depositors and Other Creditors
In 1994, there were 64 resolutions with total deposits of $14.3 billion in 1,907,220 deposit accounts. Of that total, there were three payoff transactions with $36.7 million in 2,559 deposit accounts.
Of the 744 insured thrift failures since the RTC began operations in August of 1989, a total of 494 were P&A transactions, 92 were payoff transactions, and 158 were IDTs.
Asset Disposition
At the beginning of 1994, the RTC held $63.8 billion in assets of savings and loan associations in receivership and conservatorship. Assets acquired during the year through conservatorships, other resolved institutions, and putbacks or repurchases totaled $5.1 billion for the year. Losses and collections totaled $43.9 billion for the year. At the end of 1994, the RTC's inventory of assets in liquidation totaled $25 billion.
The RTC in 1994 continued to phase out the Standard Asset Management Disposition Agreement (SAMDA) program. At the end of the year, SAMDA contractors were managing assets with a total book value of $6 billion. From the program's inception in August 1990 through the end of 1994, a total book value of $37 billion in assets was managed by SAMDA contractors, and 84 percent (or $31 billion) of those assets were disposed of by the end of the year.
During the year, the RTC special teams restructured or sold $4.3 billion in problem assets, with about $1.4 billion in assets under review at the end of the year. From the inception of the program in July 1992, special teams had negotiated settlements, restructured loans, and had taken other actions on assets totaling $11.8 billion and had collected $1.2 billion.
The RTC closed approximately $1.5 billion in commercial seller financed transactions. From the program's inception in March 1991 through the end of 1994, about $5 billion in commercial seller financed transactions were closed by the RTC, while during the same period, about $2.4 billion in funds were received by the RTC from the liquidation of RTC commercial seller financed notes.
During 1994, over 100,000 assets totaling over $7.2 billion in book value were sold through the Judgments, Deficiencies, and Charge-offs initiative. Additionally, about 1,308 subsidiaries were either sold or dissolved during the year.
The RTC securitization program was responsible for the sale of approximately $2.6 billion book value in performing loans in three transactions. Loans totaling $1.5 billion book value of nonperforming commercial and multi-family mortgages were sold in 1994. There were three N Series transactions, accounting for about $1 billion of the assets, and six S Series transactions, accounting for $500 million of the assets. From the program's inception in June 1991 through the end of 1994, almost $45 billion in performing and nonperforming loans were securitized.
In 1994, the RTC was involved in implementing the Resolution Trust Corporation Completion Act of 1993 provisions of expanding opportunities for minorities and women. In the contracting area, the RTC continued its goal of ensuring maximum opportunities for minority- and women-owned firms. In 1994, 8,725 contracts were awarded to minority- and woman-owned businesses (MWOBs), or 48.6 percent of all 1994 RTC contracts. Estimated contract fees to MWOBs reached $268.8 million, or 48.8 percent of the estimated fees paid for all 1994 RTC contracts, a 28 percent increase over the 1993 contracting fees paid to MWOBs. The RTC made 4,281 referrals to minority- and women-owned law firms, or 42.6 percent of all referrals to outside counsel, and $59.3 million in fees were paid to those firms, or 25.8 percent of all fees paid to outside contractors that year.
The RTC's Department of Minority- and Women-Owned Business ensured that firms owned and operated by minorities and women had maximum opportunities to do business with the RTC. A primary focus for the department staff in 1994 was informing minority investors of RTC opportunities to purchase thrifts or branch offices located in predominately minority neighborhoods. The staff also participated in the RTC's contracting process, including presolicitation, solicitation, evaluation, selection, contract administration, and post-award activity. The RTC exceeded its annual goal of awarding 30 percent of all contracts and fees to minority- and women-owned businesses.
Through its Affordable Housing Disposition Program, the RTC in 1994 sold 1,751 single-family properties for a total of $48 million, and 137 multi-family housing properties for a total of $246 million. From the program's inception in 1990 through the end of 1994, 22,064 single-family properties were sold for a total of $605 million, and 708 multi-family affordable housing properties containing 75,614 units were sold for a total of $857 million. Additionally, from its inception through the close of 1994, the affordable housing program provided a total of 712 single-family dwellings and 61 multi-family dwellings with no reasonable recovery value to nonprofit organizations and public agencies.
Table 17-8 shows the RTC's assets in liquidation and Chart 17-3 shows the asset mix.
Table 17-8
| 1994 RTC End of the Year Assets in Liquidation ($ in Billions*) | ||||||
|---|---|---|---|---|---|---|
| Asset Type | 12/31/93 Total Book Value | Assets Acq'd During the Year | 1994 Collections | 1994 Losses | 12/31/94 Total Book Value | Memo Item |
| 1-4 Family Mtges | $9.0 | $0.1 | $3.4 | $0.9 | $4.8 | $2.9 |
| Other Mtges | 17.5 | 0.3 | 5.7 | 5.6 | 6.5 | 3.0 |
| Other Loans | 4.5 | 1.1 | 2.7 | 0.7 | 2.2 | 0.6 |
| Real Estate Owned | 6.0 | 0.1 | 1.5 | 2.5 | 2.1 | 0.7 |
| Other Assets | 15.3 | 0.2 | 3.7 | 5.8 | 6.0 | 3.3 |
| Cash/Securities | 11.5 | 3.3 | 10.0 | 1.4 | 3.4 | 4.5 |
| Totals | $63.8 | $5.1 | $27.0 | $16.9 | $25.0 | $15.0 |
Memo Item: Assets transferred from conservatorship to receivership. Does not affect total of assets in liquidation.
Source: RTC August 1989/September 1995 Statistical Abstract.

Staffing
As previously discussed, the FDIC accepted 132 available permanent RTC employees as FDIC vacancies occurred during 1994. Total RTC staff at the end of 1994 was 5,899, which was down from 6,778 at the end of 1993.
17-1 Bureau of Economic Analysis, Department of Commerce. Back to Text
17-2 CB Commercial Torto/Wheaton Research and Bureau of Labor Statistics, Department of Labor. Back to Text
17-3 Housing Market Statistics, National Association of Home Builders (June 1996), and Federal Home Loan Mortgage Corporation. Back to Text
17-4 Bureau of Labor Statistics, Department of Labor. Back to Text
17-5 Housing Market Statistics, National Association of Home Builders (June 1996), and CB Commercial Torto/Wheaton Research. Back to Text
17-6 California Statistical Abstract. Back to Text
17-7 CB Commercial Torto/Wheaton Research. Back to Text
17-8 CB Commercial Torto/Wheaton Research. Back to Text
17-9 Construction Industry Research Board and California Association of Realtors, Research and Economics Department, “California Existing Single-Family Housing Market Historical Data Summaries” (March 1995).Back to Text
17-10 Figures do not include member institutions of SAIF that were in RTC conservatorship, and one SAIF member self-liquidating institution. Back to Text
17-11 In 1988 there were 21 assistance agreements that resolved 79 institutions. The FDIC annual report (source data) calculates failure data per transaction; this report calculates failures per failed institution. Actual resolutions through 1994 totaled 2,179. Back to Text
Table of Contents