
Managing the Crisis: The FDIC and RTC Experience — Chronological Overview
Chapter Twenty-Four: 2001
Chairman Donald E. Powell is quoted in the FDIC's 2001 Annual Report as stating, “We must be ready to meet the challenges of the future, and we are not there yet. I believe history will see 2001 as a setup year for the FDIC. We spent a lot of time working on initiatives that will bear fruit in 2002 and beyond.”
Table 24-1
| 2000 - 2001: FDIC at a Glance ($ in Millions) | |||
|---|---|---|---|
| 12/31/00 | 12/31/01 | Percent Change | |
| Number of Bank Failures |
7 | 4 | -42.86% |
| Total Assets of Failed and Assisted Banks | $414.5 | $1,821.8 | 339.52% |
| Estimated Losses on Failed and Assisted Banks |
$37.3 | $433.5 | 1,062.20% |
| Estimated Losses as a Percent of Total Assets | 9.00% | 23.80% | 164.44% |
| Assets in Liquidation | $535.5 | $573.4 | 7.08% |
| FDIC Staffing | 6,452 | 6,167 | -4.42% |
| Number of Problem Financial Institutions | 94 | 114 | 21.28% |
| Bank Insurance Fund Balance | $30,975.2 | $30,438.8 | -1.73% |
| Bank Insurance Fund Balance as a Percent of Insured Deposits | 1.35% | 1.26% | -6.67% |
| Savings Insurance Fund Balance | $10,758.6 | $10,935.0 | 1.64% |
| Savings Insurance Fund Balance as a Percent of Insured Deposits | 1.43% | 1.36% | -4.90% |
Source: FDIC, 2001 Annual Report and Reports from FDIC Division of Finance and Division of Research and Statistics.
Notable Events
- For the first time, the FDIC in January 2001 used the Internet to sell a failing institution's deposits and assets. The Internet had previously been used to sell assets after a resolution.
- On January 16, longtime community banker, John M. Reich was appointed to the FDIC Board of Directors. Following Chairman Tanoue's resignation in July 2001 until Mr. Powell took office in August 2001, Mr. Reich was Acting Chairman of the FDIC.
- In April, the FDIC published Keeping the Promise: Recommendations for Deposit Insurance Reform which included, among other initiatives, proposed changes to the method for assessing deposit insurance premiums, and indexing the $100,000 coverage limit to keep pace with inflation.
- In July, the FDIC unveiled its Money Smart program, which was designed to promote and facilitate financial education for adults outside of the financial mainstream.
- On August 29, Donald E. Powell was sworn in as the 18th Chairman of the FDIC. Prior to his appointment, Mr. Powell was President and CEO of The First National Bank of Amarillo, Amarillo, Texas. He began his banking career in 1963 at First Federal Savings & Loan of Amarillo.
- On December 7, by virtue of his appointment as Director of the Office of Thrift Supervision, James E. Gilleran, also became a member of the FDIC Board.
The FDIC Reacts to the September 11 Terrorist Attacks
The terrorist attacks against the United States on September 11, 2001, shook the country and the world. Among the fallout, the tragedy jolted business and consumer confidence, impairing economic activity in virtually every region of the country. The banking industry and others near “Ground Zero”?the site of the attacks on the World Trade Center towers in New York?responded with remarkable resiliency to maintain the continuity of the financial system. What many Americans do not know is how the FDIC and other bank regulatory agencies reacted during the crisis to ensure the continuity of their operations and the stability of the banking system.
With the evacuation of the New York Regional Office, located just six blocks from the World Trade Center, the FDIC faced significant operational challenges, yet contingency planning and interagency coordination enabled the FDIC to resume in a timely manner all of its crucial business in New York from two satellite offices in New Jersey. Interim contact information was posted on the FDIC's public Web site. The New York Regional Office reopened on September 17.
In the days and weeks following the attacks, the New York staff actively monitored the operational and financial condition of depository institutions in the region. FDIC headquarters staff, along with the other federal banking regulators and the state chartering authorities, monitored the attacks' impact on the banking system. Immediate concerns about the continued operations of affected institutions were constantly monitored, and senior officials at the regulatory agencies were briefed daily. Liquidity concerns nationwide were monitored through daily conference calls between the various regional offices of each of the agencies until the situation had stabilized and concerns had been mitigated. In conjunction with other bank regulators, the FDIC assessed the long-term impact of these events on the U.S. banking industry. The FDIC also issued supervisory guidance to the industry similar to guidance normally issued when natural disasters occur, and encouraged FDIC-supervised institutions to cooperate with law enforcement agencies in the investigation of terrorist activity.
Following the terrorist attacks, economists and financial analysts in the eight FDIC regional offices worked with their counterparts in Washington to stay abreast of regional and national economic developments and to evaluate their likely effects on the banking system. FDIC staff delivered a report to the FDIC Board of Directors on October 9 detailing the effects on the banking industry up to that time. A summary of that report was published in the FDIC's fourth quarter Regional Outlook. The third quarter 2001 edition of the FDIC's Quarterly Banking Profile, which provides a comprehensive analysis of banking industry statistics and trends, included the supplement “How the Banking Industry Has Responded to Crises.” This piece chronicled the history of bank performance indicators during previous historical periods of national and international crisis.
Economic/Banking Conditions
With the demise of the ?tech boom' and ?nine-eleven' the U.S. economy weathered a short lived recession with some corresponding significant downturn in certain economic factors. After enjoying four years of single digit rates, office vacancies spiked up almost 600 basis points to 14.2 percent. GDP dropped over 300 basis points to 3.2 percent. Unemployment moved up over 200 basis points to 6.1 percent overshadowing any overall job growth as total employment decreased by 1.1 percent, a net decrease of over 1.5 million jobs.
Government action put significant downward pressure on interest rates to respond. By the end of the year, the discount rate was down to 1.3 percent from a beginning rate of 6 percent. The prime rate was cut by almost 50 percent to 4.8 percent from 9.5 percent, and the 30-year mortgage rates started a modest decline of 0.3 percent to 7.1 percent. With other sectors not being as hard hit as technology combined with more favorable interest rates, housing starts were up 2.2 per cent at 1,602,700, existing home sales were up 3.5 percent, and there was a decrease in the inflation rate to 1.6 percent from 3.4 percent in 2000.24-1
The economic slowdown did not affect commercial bank profitability. Bank assets grew 5.2 percent. Net income rose 8 percent to $75.3 billion. Interest expense dropped 14 percent, while interest income fell only 3.8 percent. There was a 5.4 percent growth in non-interest income. Securities expanded 7.6 percent. Investment accounts grew 9.3 percent. Lower short-term interest rates caused an increase in core deposits, which grew from 7.5 percent in 2000 to 10.7 percent in 2001. Equity capital increased $67 billion or 12.8 percent.
Commercial and Industrial loans declined 6.6 percent. This can be attributed to more conservative lending patterns and a slower economy. Banks tended to shift assets away from loan/leases to government/agency securities (less risk involved in latter). Growth in commercial real estate loans was stronger, but was still slightly down from 2000. Loans to consumers (that were either held or securitized) grew 7.6 percent. Delinquency and charge-offs rose on credit card and other consumer loans caused by the increased economic uncertainty. Loan provisions rose, but were offset by gains in investment account securities.24-2
Overall, 9,632 financial institutions were in operation at the end of 2001. The number of banks on the problem bank list continued to grow and increased from 94 to 114.24-3
Table 24-2 shows the number and total assets of FDIC insured institutions, as well as their profitability as of the end of 2001
Table 24-2
Open Financial Institutions Insured by FDIC ($ in Billions)
| BIF Members | |||
|---|---|---|---|
| 2000 | 2001 | Percent Change | |
| Number | 8,572 | 8,327 | -2.86% |
| Total Assets | $6,510.7 | $6,857.5 | 5.33% |
| Return on Assets | 1.18% | 1.14% | -3.39% |
| Return on Equity | 13.86% | 12.91% | -6.85% |
| SAIF Members | |||
|---|---|---|---|
| Item | 2000 | 2001 | Percent Change |
| Number | 1,332 | 1,287 | -3.38% |
| Total Assets | $952.2 | $1,011.7 | 6.25% |
| Return on Assets | 0.89% | 1.11% | 24.72% |
| Return on Equity | 11.12% | 13.46% | 21.04% |
| US Branches of Foreign Banks | 19 | 18 | -5.26% |
Source: FDIC Quarterly Banking Profile, Fourth Quarter 2003.
Bank Failures
During 2001, four FDIC-insured institutions failed. Three of those institutions, with combined assets of $56.3 million, were insured by the BIF. The other institution, with assets of $1.8 billion, was insured by the SAIF. All four resolutions were purchase and assumption transactions.
For the first time, the FDIC used the Internet to sell the deposits and assets of a failing institution. This process marks a significant departure from the FDIC's normal procedure of selling the assets and deposits of failing institutions by inviting several hundred potential bidders to a meeting location near the failing bank. Only those attending would then obtain the confidential information necessary to complete the bidding process. The Internet was used to market all four failures in 2001.
First Alliance Bank and Trust Company, Manchester, New Hampshire, with assets of $17.4 million, was the first failing bank to be marketed by the FDIC on the Internet. Interested parties were registered and given a unique password to gain access to a secure Web site containing the confidential bidding information and materials. Potential bidders avoided the time and expense of attending the bidders meeting and had immediate and around-the-clock access to information about the failing bank and the bidding process.
On July 27, 2001 the FDIC was named receiver of Superior Bank, FSB, Hinsdale, Illinois (Superior). Superior was closed and placed into receivership on very short notice, and therefore the FDIC had no opportunity to market the franchise prior to the failure. Therefore, simultaneous with its appointment as receiver, the FDIC transferred substantially all of Superior's assets and insured deposits to a newly chartered mutual savings bank operated under the FDIC's conservatorship powers. The conservatorship continued to maintain the depository base, the loan origination platform, and loan servicing operation in an attempt to maximize the value of each business line. While the operation of a conservatorship is not new to the FDIC, the Superior resolution represented the first time that this liquidation approach had been used for a SAIF-insured institution.
Ultimately, through the operation of the conservatorship the FDIC obtained a $52.4 million premium for the deposit franchise. The conservatorship produced positive results on the loan side as well. Prior to its failure, Superior had entered into forward loan commitments (loan sale agreements) with several brokerage firm investors under which Superior was to provide pools of residential mortgage loans, at specified dates in the future. As part of the effort to maintain the viability of Superior's loan origination and servicing operations, it was determined that the conservatorship would continue to generate loans to fulfill these commitments. During 2001, the conservatorship successfully completed the sale of almost 2,500 loans under the forward loan commitments, at an average sales price of 102.9 percent.
The FDIC also reached a settlement of the claims against the primary shareholders of Superior during 2001. The FDIC received $100 million in cash in December, and a note for an additional $360 million to be repaid over the next 15 years.
A more recent estimate of losses per transaction type is shown in Table 24-3.
Table 24-3
| 2001 Estimated Losses by FDIC Transaction Type ($ in Millions*) | ||||
|---|---|---|---|---|
| Transaction Type | Number of Transactions | Total Assets | Estimated Loss* as of 12/31/03 | Estimated Losses as a Percent of Assets |
| P&As | 4 | $1,821.8 | $433.5 | 23.80% |
Source: Reports from FDIC Website ? Historical Statistics on Banking.
Payments to Depositors and Other Creditors
In the four financial institutions that failed in 2001, deposits totaled $1.7 billion in 95,036 deposit accounts. Dividends paid on all active receiverships totaled almost $465 million in 2001.
There have been a total of 2,215 insured financial institution resolutions since the FDIC began operations in 1934. Of this total, 1,471 were PA transactions, 141 were open bank assistance transactions, and 603 were deposit payoff transactions.
Total disbursements by the FDIC since January 1, 1934, have amounted to $108.4 billion. Of that amount, actual and projected recoveries are anticipated to be approximately $70.3 billion, which equates to a projected loss of $38.1 billion to the BIF/SAIF funds.
Asset Disposition
At the beginning of 2001, the FDIC held $535.5 million in assets from failed institutions. That included $226.2 million was assets in liquidation for BIF, $8.1 million for SAIF, $28.3 million for the FSLIC Resolution Fund (FRF), and $272.9 million for the Resolution Trust Corporation (RTC). During the year, the FDIC acquired an additional $213.2 million in assets from four bank failures. Asset acquisitions would have been significantly greater if not for the fact that Superior Bank, which held almost $2 billion in assets at the time of failure, was operated as a conservatorship for almost one year, and the bulk of the assets were liquidated during the conservatorship. For accounting purposes, conservatorship activities are reflected separately from receivership activities. The FDIC collected $219 million during the year, and the ending balance for assets in liquidation was $573.4 million. Of the $573.4 million, $131.7 million was assets in liquidation for BIF, $233.6 million for RTC, $14.2 million for FRF, and $193.9 million for SAIF.
Asset marketing continued to play a key role in asset liquidations for the FDIC as their efforts contributed almost $35 million (2,100 loans sold) to the recoveries. However, asset marketing's most significant contribution during the year was its sale of 14,036 loans for the Superior conservatorship, which resulted in recoveries of over $72 million during the year attributed to the conservatorship.
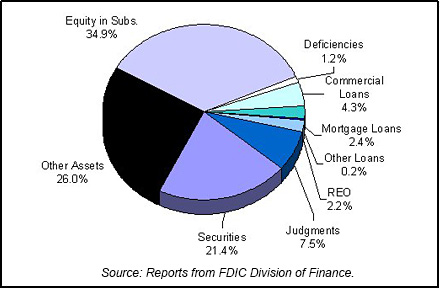
The FDIC also had over $89 million in non-asset related collections during this year. While these collections came from a number of different sources, almost $28 million represented recoveries of state and federal tax benefits due to failed institutions, and another $28 million was the result of recoveries from fidelity bond insurance claims, director and professional liability settlements, and criminal restitutions. Table 24-4 shows the FDIC's assets in liquidation and Chart 24-1 shows the asset mix.
Table 23-4 shows the FDIC's assets in liquidation and Chart 23-1 shows the asset mix.
Table 24-4
| 2001 FDIC End of the Year Assets in Liquidation ($ in Billions*) | |||||||
|---|---|---|---|---|---|---|---|
| Asset Type | 12/31/00 Book Value | 2001 Assets Acquired | 2001 Asset Adj. | 2001 Coll. & Write Downs | 12/31/01 Book Value | 12/31/01 Est. Rec. Value | |
| Commercial Loans | $39.1 | $3.0 | $18.5 | $35.8 | $24.8 | $27.6 | |
| Mortgage Loans | 45.6 | 9.3 | -1.7 | 39.7 | 13.6 | 38.0 | |
| Other Loans | 28.4 | 10.7 | -23.1 | 15.0 | 1.0 | 8.2 | |
| Real Estate Owned | 16.3 | 1.2 | 1.0 | 6.1 | 12.4 | 6.4 | |
| Judgments | 43.6 | 0.0 | 5.1 | 5.6 | 43.0 | 51.8 | |
| Securities | 132.1 | 0.5 | 11.5 | 21.5 | 122.6 | -77.2 | |
| Other Assets | 59.8 | 188.0 | -65.3 | 33.4 | 149.1 | 0.5 | |
| Equity in Subs. | 161.1 | 0.5 | 123.4 | 84.7 | 200.2 | 1.7 | |
| Deficiencies | 9.5 | 0.0 | 0.0 | 2.8 | 6.7 | 19.4 | |
| Totals | $535.5 | $213.2 | $69.4 | $244.6 | $573.4 | $76.4 | |
Source: Reports from FDIC Division of Finance.
Insurance Fund and Staffing
During 2001, the BIF balance was $30.4 billion at year-end 2001, or 1.26 percent of estimated insured deposits. The balance of the SAIF was $10.9 billion on December 31, 2001. SAIF-insured deposits were $802 billion at year-end 2001, having grown 6.2 percent for the year. This was the highest growth rate of insured deposits since the inception of SAIF in 1989. This stellar growth rate, however, decreased the reserve ratio from 1.43 percent at year-end 2000 to 1.36 at year-end 2001.
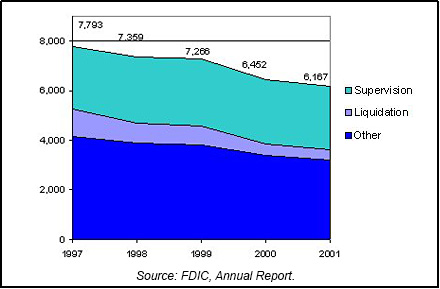
Staffing decreased by 285 (4.4 percent) during the year, down to 6,167 as the Corporation continued its efforts to match staffing with its declining workload.
Approximately one third of this decline was accomplished through the expiration of temporary and term appointments. Additionally, the Legal Division, the Office of Ombudsman, and the Office of Diversity and Economic Opportunity offered buyout opportunities to its staff members. Chart 24-2 shows the staffing levels for the past five years.
24_1
Bureau of Labor and Statistics, Department of Labor; Bureau of Economic Analysis, Department of Commerce; Housing Market Statistics, National Association of Home Builders; and Federal Home Loan Mortgage Corporation. Back to Text
24_2
Federal Reserve Bulletin Volume 88, Number 6, June 2002. Back to Text
24_3
FDIC Quarterly Banking Profile, Fourth Quarter 2001. Back to Text
Table of Contents