
Managing the Crisis: The FDIC and RTC Experience — Chronological Overview
Chapter Twenty: 1997
Acting Chairman Andrew C. Hove is quoted in the FDIC's 1997 Annual Report as stating, “The FDIC spent much of 1997 preparing for a new financial world being shaped by consolidation and technical change. Our freedom to focus on the future was, in large part, a reflection of the extraordinary healthy state of the banking and thrift industries. Low and stable interest rates, and a growing economy, gave both industries the opportunity to register record profits in 1997.”
Table 20-1
| 1996 - 1997: FDIC at a Glance ($ in Millions) | |||
|---|---|---|---|
| 12/31/96 | 12/31/97 | Percent Change | |
| Number of Bank Failures |
6 | 1 | -83.33% |
| Total Assets of Failed and Assisted Banks | $232.6 | $27.9 | -88.01% |
| Estimated Losses on Failed and Assisted Banks |
$60.6 | $5.0 | -91.75% |
| Estimated Losses as a Percent of Total Assets | 26.05% | 17.92% | -31.21% |
| Assets in Liquidation | $8,711.2 | $4,114.6 | -52.77% |
| FDIC Staffing | 9,151 | 7,793 | -14.84% |
| Number of Problem Financial Institutions | 117 | 92 | -21.37% |
| Bank Insurance Fund Balance | $26,854.4 | $28,292.5 | 5.36% |
| Bank Insurance Fund Balance as a Percent of Insured Deposits | 1.34% | 1.38% | 2.99% |
| Savings Insurance Fund Balance | $8,888.4 | $9,368.3 | 5.40% |
| Savings Insurance Fund Balance as a Percent of Insured Deposits | 1.30% | 1.36% | 4.62% |
Source: FDIC, 1997 Annual Report and Reports from FDIC Division of Finance and Division of Research and Statistics.
Notable Events
- On January 16, experts from around the country gathered at a FDIC-sponsored symposium, History of the Eighties ? Lessons for the Future, to examine the causes of the crisis in the savings & loan and the banking industry during the 1980s and early 1990s.
- On January 29, the FDIC became the first federal banking agency to issue examination procedures on electronic banking and associated risks to its staff. The FDIC also provided the examination guidance to financial institutions, assisting them in the early development of their electronic banking systems.
- On April 28, the FDIC announced a series of seminars to educate bankers about its new examination procedures for the sale of non-deposit investment products, such as mutual funds and annuities.
- On May 9, the Federal Financial Institutions Examination Council issued guidance on the activities necessary for insured financial institutions to make computer systems capable of recognizing dates in the Year 2000 and beyond. Unless the computers were capable of distinguishing 2000 from 1900, the institutions faced substantial risks from faulty accounting and recordkeeping to system shutdowns.
- On June 1, Andrew C. Hove, Jr., became Acting Chairman of the FDIC for the third time, succeeding Ricki Helfer, who left the Corporation after more than two and a half years.
- On July 30, Acting Chairman Hove told Congress that FDIC-supervised banks are generally aware they face serious disruptions if their computer systems are not modified to handle transactions starting January 1, 2000. The FDIC monitored the situation closely and took supervisory and enforcement action, if banks did not address the problem.
- On November 17, the FDIC and the Georgia Department of Banking and Finance jointly issued cease and desist orders against three affiliated Georgia banks in the government's first enforcement actions to address Year 2000 compliance in the banking industry.
- On November 21, the only commercial bank failure of 1997 occurred, marking 1997 as the first year since 1972 with only one commercial bank failure. In 1997, there were no insured savings institution failures, the first year without a thrift failure since 1959.
- At year-end, the FDIC had approved two applications for banks that plan to operate solely through the Internet or other electronic means.
Economic/Banking Conditions
The U.S. economy roared forward during 1997, as GDP advanced by a whopping 6.5 percent, and unemployment fell by 60 basis points to 4.7 percent. The number of employed persons rose by 2,833,000 or 2.2 percent. While new home sales increased a healthy 6.5 percent, housing starts was virtually unchanged. Office vacancy rates provided the biggest news in the real estate sector during 1997, plummeting by 230 basis points from 12 percent to 9.7 percent. The discount rate remained unchanged at 5 percent, and the 30-year mortgage rate fell by 63 basis points to 7.51 percent.20-1
It was a good year for commercial banks as returns on equity and assets increased. In fact, the return on assets reaching another new high. Due to the strong economy, bank loans increased by 8.25 percent, and loan losses remained low. Although banks earned lower rates on interest earning assets and paid more for liabilities, increased efficiency and higher fee income offset these costs. Stock prices overall matched those of the broader market. Although in the fourth quarter, stock prices were ‘buffeted’ because of concerns over economic problems in Asia.
Banks earned $59.2 billion; this is up 12.75 percent from 1996. Assets grew by 9.25 percent; the fastest growth in more than a decade. Total bank equity grew by10.25 percent. Securities that had been unchanged for last couple of years, expanded 8.75 percent. Non-interest income passed the $100 billion mark to $105.7 billion (up $10.5 billion in 1996). The net interest margin declined to 4.21 percent (from 4.27 percent in 1996). This is the fifth consecutive year it has declined. Net interest income as a percentage of average assets declined 6 basis points because of a decline in net interest margin. Non-interest income increased by 5 basis points.
Commercial and Industrial loans expanded by 12.25 percent. This is the second largest increase in 17 years. Non-current loans fell by $659 million. Commercial real estate loans increased by more than 9.75 percent. Home mortgages secured by first liens also expanded by 8.75 percent.
Bank core deposits grew 4.5 percent and savings accounts continued to expand rapidly because of the increased use of ?sweep' programs. In June, most of the remaining legal restrictions on interstate mergers were removed and many bank holding companies combined subsidiary banks that had been operating in different regions. Mergers accounted for 599 commercial banks absorptions, and 190 of these were in interstate mergers. By the end of the year, the largest 100 banks accounted for two-thirds of bank assets.
An Asian financial crisis primarily affected the trading income of the ten largest banks in America. The Asian crisis began when the Thai baht dropped sharply and the Thai authorities no longer defended the baht’s peg to the dollar. In response, other East Asian economies experienced downward pressure on their currencies and equity prices and there was an upward pressure on interest rates. The crisis quickly spread to Korea and other countries as markets in Thailand, Indonesia, and Korea were turbulent through 1998.20-2
At end of 1997, there were 10,950 financial institutions in the United States and 92 institutions on the problem bank list.20-3
Table 20-3 shows the number and total assets of FDIC insured institutions, as well as their profitability as of the end of 1997.
Table 20-2
Open Financial Institutions Insured by FDIC ($ in Billions)
| BIF Members | |||
|---|---|---|---|
| 1996 | 1997 | Percent Change | |
| Number | 9,823 | 9,406 | -4.25% |
| Total Assets | $4,857.8 | $5,292.8 | 8.95% |
| Return on Assets | 1.17% | 1.22% | 4.27% |
| Return on Equity | 14.14% | 14.43% | 2.05% |
| SAIF Members | |||
|---|---|---|---|
| Item | 1996 | 1997 | Percent Change |
| Number | 1,629 | 1,517 | -6.88% |
| Total Assets | $749.6 | $752.0 | 0.32% |
| Return on Assets | 0.67% | 0.94% | 40.30% |
| Return on Equity | 8.08% | 11.11% | 37.50% |
| US Branches of Foreign Banks | 32 | 27 | -15.63% |
Source: FDIC Quarterly Banking Profile, Fourth Quarter 2003.
Bank Failures
During 1997, the FDIC resolved only one institution, the fewest in one year since 1972. Southwest Bank, Jennings, Louisiana, which was insured by the BIF, was closed by the state banking commissioner on November 21, 1997. It had total deposits of $27.5 million and total assets of $27.9 million. The FDIC was able to find a bank to assume all of the bank's deposits and $20 million of its assets.
A more recent estimate of losses per transaction type is shown in Table 20-3.
Table 20-3
Source: Reports from FDIC Website ? Historical Statistics on Banking.
Payments to Depositors and Other Creditors
In the one financial institution that failed in 1997, deposits totaled $27.5 million in 2,000 deposit accounts. Dividends paid on all active receiverships totaled almost $5.6 billion in 1997.
There have been a total of 2,193 20-4 insured financial institution resolutions since the FDIC began operations in 1934. Of this total, 1,449 were P&A transactions, 141 were open bank assistance transactions, and 603 were deposit payoff transactions.
Total disbursements by the FDIC since January 1, 1934, have amounted to $106.6 billion. Of that amount, actual and projected recoveries are anticipated to be approximately $69.5 billion, which equates to a projected loss of $37.1 billion to the BIF/SAIF funds.
Asset Disposition
At the beginning of 1997, the FDIC held $8.7 billion in assets from failed institutions. That included $3.8 billion in BIF assets, $36 million in SAIF assets, $476 million in FSLIC Resolution Fund (FRF) assets, and $4.4 billion in Resolution Trust Corporation (RTC) assets. During the year, the FDIC acquired an additional $26 million in assets from one bank failure. The FDIC collected $3.6 billion during the year, and the ending balance for assets in liquidation was $4.1 billion, a reduction of $4.6 billion. Of the $4.1 billion, $1.7 billion was assets in liquidation for BIF, $17 million for SAIF, $169 million for FRF, and $2.2 billion for RTC.
During 1997, the FDIC sold real estate properties for a total of $321 million, yielding a recovery of 102 percent of average appraised value. More than 23,207 loans and other assets totaling $1.5 billion in book value were sold through asset marketing efforts, with net sales proceeds during 1997 representing 111 percent of appraised value.
The FDIC Affordable Housing Disposition Program sold 37 multifamily and 25 single-family properties consisting of 1,755 units for $9.8 million. Since 1990, the FDIC and RTC affordable housing programs had cumulative sales of more than 125,000 affordable housing units for $18 billion. In addition, 30 state housing agencies and nonprofit organizations, acting under a memorandum of understanding with the FDIC, monitored 93,409 multifamily rental units to ensure that the purchasers were making units available at adjusted rents as specified in the purchase agreements.
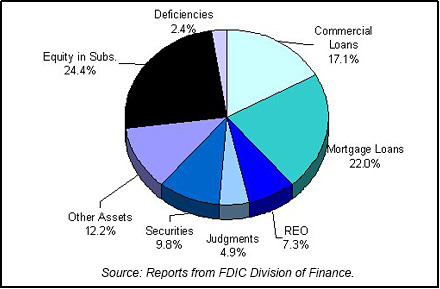
Table 20-4 shows the FDIC's assets in liquidation and Chart 20-1 shows the asset mix.
Table 20-4
| 1997 FDIC End of the Year Assets in Liquidation ($ in Billions*) | |||||||
|---|---|---|---|---|---|---|---|
| Asset Type | 12/31/96 FDIC Book Value | 1997 Assets Acquired | 1997 Asset Adj. | 1997 Coll. & Write Downs | 12/31/97 Book Value | 12/31/97 Est. Rec. Value | |
| Commercial Loans | $1.4 | $0.0 | $0.0 | $0.8 | $0.7 | $0.3 | |
| Mortgage Loans | 2.5 | 0.0 | 0.1 | 1.7 | 0.9 | 1.1 | |
| Other Loans | 0.0 | 0.0 | 0.0 | 0.0 | 0.0 | 0.0 | |
| Real Estate Owned | 0.6 | 0.0 | 0.1 | 0.4 | 0.3 | 0.2 | |
| Judgments | 0.3 | 0.0 | 0.1 | 0.2 | 0.2 | 0.8 | |
| Securities | 0.7 | 0.0 | 0.0 | 0.3 | 0.4 | 0.3 | |
| Other Assets | 0.8 | 0.0 | 0.1 | 0.4 | 0.5 | 0.0 | |
| Equity in Subs. | 2.0 | 0.0 | 0.1 | 1.1 | 1.0 | 0.0 | |
| Deficiencies | 0.4 | 0.0 | 0.1 | 0.3 | 0.1 | 0.3 | |
| Totals | $8.7 | $0.0 | $0.6 | $5.2 | $4.1 | $3.0 | |
Source: Reports from FDIC Division of Finance.
Insurance Fund and Staffing
The BIF grew to $28.3 billion by December 31, 1997. BIF-insured deposits grew at a comparable rate and the fund's reserve ratio totaled 1.38 percent. The balance of the SAIF increased to $9.4 billion, and SAIF-insured deposits grew at a slightly slower pace, to $690 billion at the end of 1997. As a result, the reserve ratio of the SAIF edged upward to 1.36 percent. The near-term prospects for both insurance funds remained quite favorable, and investment income was expected to be sufficient to meet expenses.
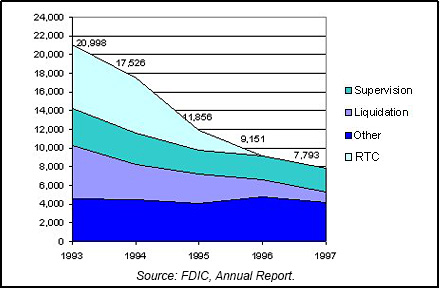
The Corporation continued to shrink the size of its workforce in 1997 due to a further decline in workload. Total FDIC staffing in 1997 fell by approximately 14.8 percent. Staffing for the Division of Resolutions and Receiverships (DRR), which liquidates the assets of failed institutions, fell by over 39.9 percent during the year. Chart 20-2 shows the staffing levels for the past five years.
DRR staffing reductions were accomplished primarily through the expiration of term and temporary appointments and by consolidating field liquidation operations. DRR operations and related Legal Division and other support activities in San Francisco, New York, Chicago, Atlanta, and Franklin, MA, were consolidated into other offices during the year. This was part of a three-year phased consolidation plan announced the previous year. DRR field operations are expected to be fully consolidated into a single site in Dallas by year-end 1999. In addition, the Division of Finance's field financial activities were consolidated in Dallas in 1997, and three Division of Supervision (DOS) field offices and a Division of Compliance and Consumer Affairs (DCA) satellite office were closed.
As a result of the buyout programs initiated in 1995 and 1996, a total of 379 employees left the Corporation during 1997. Another 87 permanent employees elected buyouts in 1997 in lieu of being reassigned to other areas of the country. In late 1997, the Corporation announced that new buyout and early retirement opportunities would be available during 1998 for selected employees in overstaffed divisions and offices.
20-1 Bureau of Labor and Statistics, Department of Labor; Bureau of Economic Analysis, Department of Commerce; Housing Market Statistics, National Association of Home Builders; and Federal Home Loan Mortgage Corporation. Back to Text
20-2 Federal Reserve Bulletin Volume 84, Number 6, June 1998.Back to Text
20-3 FDIC Quarterly Banking Profile, Fourth Quarter 1997. Back to Text
20-4 Beginning with the 1997 Annual Report, the number of financial institutions listed in the open bank assistance transactions column for 1988 was changed from 21 to 80 and the total number of insured financial institution resolutions column was changed from 221 to 280 to reflect that one assistance transaction encompassed 60 institutions. Also, certain 1982, 1983, 1989, and 1992 resolutions previously reported in either the deposit payoff or P&A transactions categories were reclassified. Back to Text
Table of Contents