
Managing the Crisis: The FDIC and RTC Experience — Chronological Overview
Chapter Four: 1981
As reflected in the following quote from then-FDIC Chairman William M. Isaac in the FDIC’s 1981 Annual Report, mutual savings banks were becoming a matter of concern: “During 1981, banks faced both intensified competitive pressures from unregulated financial intermediaries and unprecedented economic conditions. These combined to create major problems for a number of institutions, particularly our mutual savings banks.”
Table 4-1
| 1980 - 1981: FDIC at a Glance ($ in Millions) | |||
|---|---|---|---|
| 12/31/80 | 12/31/81 | Percent Change | |
| Number of Bank Failures | 10 | 7 | -30.00% |
| Assistance to Open Banks | 1 | 3 | 200.00% |
| Total Failed and Assisted Banks | 11 | 10 | -9.09% |
| Total Assets of Failed and Assisted Banks | $8,192.4 |
$4,947.4 | -39.61% |
| Losses on Failed and Assisted Banks | $30.7 | $781.8 | 2,446.58% |
| Losses as a Percent of Total Assets | 0.37% | 15.80% | 4,170.27% |
| Assets in Liquidation | $1,791.8 | $1,840.6 | 2.72% |
| FDIC Staffing | 3,644 | 3,394 | -6.86% |
| Number of Problem Banks | 217 | 223 | 2.76% |
| Deposit Insurance Fund Balance | $11,019.5 | $12,246.1 | 11.13% |
| Deposit Insurance Fund Balance as a Percent of Insured Deposits | 1.16% | 1.24% | 6.90% |
Source: FDIC, 1981 Annual Report and Reports from FDIC Division of Finance and Division of Research and Statistics.
Notable Events
The FDIC was involved in a number of activities during the year that were designed to reduce the regulatory burden on institutions. Those efforts included participation in the activities of the Depository Institutions Deregulation Committee, which was created by Congress in 1980 with a mandate to oversee the orderly phase out of deposit interest rate ceilings.
William M. Isaac became the thirteenth chairman of the FDIC on August 3, 1981. He was appointed to a six-year term on the FDIC’s Board of Directors in March 1978. Prior to his appointment to the board, Mr. Isaac served as vice president, general counsel, and secretary of First Kentucky National Corporation and its subsidiaries, First National Bank of Louisville and First Kentucky Trust Company.
Economic/Banking Conditions
The economy did not bounce back from the weak economic year of 1980, and a recession set in. Gross Domestic Product (GDP) and employment growth were meager at 2.5 percent and 1 percent, respectively.4-1 Unemployment continued to rise to 7.6 percent.4-2 Interest rates and inflation also rose. Signs in real estate markets reflected the onset of the recession. Home sales (-18.9 percent) and housing starts (-16.1 percent) again declined from the previous year, and the commercial vacancy rate increased to 5.4 percent..4-3 The high interest rates, a 13.4 percent discount rate and a 16.6 percent 30-year mortgage rate, continued to hurt lending.4-4 Gross loans and leases relative to total bank assets for the U.S. were down (51.9 percent), as were total real estate loans at 17.1 percent of assets, including commercial real estate loans at 4.4 percent of assets. There was, however, an increase in Commercial and Industrial (C&I) loans to 10.1 percent of assets, reflecting the investment in industries around the country that were expanding despite the national recession.
The Southwest saw an increase in C&I loans, from 13.2 percent of assets in 1980 to 15.1 percent in 1981, as that region’s two booming industries, oil and agriculture, continued to reap gains through the first half of the year. In April, oil prices peaked at $36.95 a barrel and began to fall. Recessions in oil-consuming nations, reduction in oil consumption through conservation efforts, and non-OPEC countries increasing their oil output resulted in pressure on OPEC’s ability to maintain a fixed price on oil. In addition, the unity of the cartel deteriorated as members began to boost their own oil output, selling more than their OPEC quotas and reducing oil prices in world markets.4-5 The Southwest experienced a peak in demand for oil rigs.4-6
Agricultural exports peaked at $44 billion and represented a 19 percent share of total exports.4-7 Although agricultural banks remained profitable, with only 2 percent of institutions having negative net income, decreasing demand for American agricultural products caused farm income to fall short of optimistic projections for the year. That shortfall signaled an end to the agricultural expansion of the previous decade and the beginning of the struggle to pay off farm debt, which had risen to $196.2 billion.4-8
When a downturn in those two industries began in the Southwest, banks shifted lending to real estate markets. The value of commercial real estate permits increased by 43 percent in the region despite the drop in commercial real estate loans to 4.6 percent of assets.4-9 Commercial vacancy rates in the region’s major cities began to rise.4-10 For the third year in a row, banks in the region experienced asset growth rates above the national average, 14.9 percent asset growth for Southwest banks in 1981 compared to 9.34 percent for the U.S. banking industry.
In 1981, the Economic Recovery Act was passed. That Act included generous tax treatment for income producing real estate that set the stage for future commercial real estate growth, both in construction and lending. The FDIC, the Office of the Comptroller of the Currency, and the Federal Reserve Board set capital requirements for the institutions that they supervised. At that point, the guidelines did not apply to multi-national banks.
The recession that began in 1981 arrived at a time when bankers were willing (and may even have felt forced) to take additional risks to maintain interest margins in the face of rising liability costs. The lure of lending to growth industries had led some banks to excessive loan concentrations in fragile industries. An oil surplus and resulting decline in oil prices, for example, surprised many bankers who had invested heavily in independent oil and gas development companies that were suddenly no longer viable.
The number of banks on the problem bank list in 1981 remained fairly stable through the year and stood at 223 at the end of the year. However, in light of the unfavorable economic conditions at the time, that number was expected to increase.
Table 4-2 shows an illustration of the number and total assets of FDIC insured institutions, as well as their profitability as of the end of 1981.
Table 4-2
Open Financial Institutions Insured by FDIC ($ in Billions)
| Commercial Banks - FDIC Regulated | |||
|---|---|---|---|
| Item | 1980 | 1981 | Percent Change |
| Number | 14,434 | 14,414 | -0.14% |
| Total Assets | $1,855.7 | $2,029.0 | 9.34% |
| Return on Assets | 0.79% | 0.76% | -3.80% |
| Return on Equity | 13.68% | 13.04% | -4.68% |
| Savings Banks – FDIC Regulated | |||
|---|---|---|---|
| Item | 1980 | 1981 | Percent Change |
| Number | 323 | 331 | 2.48% |
| Total Assets | $152.6 | $155.9 | 2.16% |
| Return on Assets | -0.17% | -0.94% | -452.94% |
| Return on Equity | -2.59% | -16.19% | -525.10% |
| Savings Associations – FHLBB Regulated | |||
|---|---|---|---|
| Item | 1980 | 1981 | Percent Change |
| Number | 4,005 | 3,785 | -5.49% |
| Total Assets | $620.6 | $658.5 | 6.11% |
| Return on Assets | 0.13% | -0.72% | -- |
| Return on Equity | 2.45% | -15.59% | -- |
Percent change is not provided if either the latest period or the year-ago period contains a negative number.
Bank Failures and Assistance to Open Banks
Seven banks failed in 1981. Two were in Illinois; two were in Oregon; and one each in Arizona, Colorado, and Georgia. The FDIC paid off deposits in two cases and arranged purchase and assumption (P&A) transactions in five cases. There also were three assisted mergers of mutual savings banks.
In November and December of 1981, FDIC assistance under (then) Section 13(e) was used to accomplish the mergers of three New York City savings banks with total assets of $4.8 billion. The FDIC’s estimated loss resulting from the assisted mergers amounted to $772.8 million, or 16 percent of total assets. The three savings banks involved were Greenwich Savings Bank, Central Savings Bank, and Union Dime Savings Bank, all in New York City.
The FDIC was authorized to perform Assisted Mergers under (then) Section 13(e) of the FDI Act. The FDIC was allowed to take direct action to reduce or avert a threatened loss to the FDIC and arrange a merger of a failed or failing insured bank with another insured bank. The FDIC could make loans secured in whole or in part by assets of an open or closed bank, or it could purchase any assets or guarantee any other insured bank against loss by reason of the FDIC’s assuming the liabilities and purchasing the assets of an open bank.
In 1980, ten commercial banks failed; three of those were in Kansas. One bank received open bank assistance. The ten insured banks that failed had deposits of $219.9 million. In seven cases involving banks holding deposits of $202.7 million, the FDIC arranged a P&A transaction where a healthy bank, either new or existing, purchased selected assets of the failed bank and assumed its deposits. In three bank failures with aggregate deposits of $17.2 million, the FDIC paid off depositors up to the statutory limit ($40,000 prior to March 31, 1980, and $100,000 after that date).
On April 28, 1980, the FDIC, the Federal Reserve, and the OCC jointly announced a $500 million open bank assistance package to assure the viability and continued operation of First Pennsylvania Bank, N.A., (First Penn), a subsidiary of First Pennsylvania Corporation, Philadelphia, Pennsylvania. First Penn, with assets of $8 billion, was Philadelphia’s largest bank and the twenty-third largest in the nation. The assistance to First Penn was in the form of $500 million in five-year subordinated notes supplemented by a $1 billion bank line of credit through access to the Federal Reserve discount window.
A recent estimate of losses per transaction type is shown in Table 4-3.
Table 4-3
| 1980 Losses by Transaction Type ($ in Millions) | ||||
|---|---|---|---|---|
| Transaction Type | Number of Transactions | Total Assets | Losses | Losses as a Percent of Assets |
| OBA | 3 | $4,838.6 | $772.8 | 15.97% |
| P&As | 5 | 56.9 | 7.9 | 13.88% |
| Payoffs | 2 | 51.9 | 1.1 | 2.12% |
| Totals | 10 | $4,947.4 | $781.8 | 15.80% |
Source: Reports from FDIC Division of Research and Statistics.
Payments to Depositors and Other Creditors
The seven banks that failed in 1981 had total deposits of $100.2 million in 32,930 deposit accounts. Two payoffs represented roughly half of the failed banks’ aggregate deposits, with 16,883 deposit accounts and $47.9 million in deposits. The three New York City savings banks that received assistance held 660,231 deposit accounts and $3.9 billion in deposits.
Since the inception of the FDIC in January 1934, until December 31, 1981, there were 578 insured banks4-11 that closed or were assisted with aggregate deposits of $10 billion. The FDIC disbursed $6.9 billion to protect depositors and experienced total losses, including losses expected on assets in the process of liquidation, of $1 billion through the end of 1981.
In the 312 deposit payoffs since the FDIC began operations, recoveries of uninsured portions of deposits varied from bank to bank. However, in the aggregate, nearly 97.2 percent of total deposits in payoffs was paid by the end of 1981.
Asset Disposition
At the beginning of 1981, the FDIC had $1.8 billion in failed bank assets. During the year, the FDIC handled seven bank failures with total assets of $108.8 million, and assets acquired closely matched assets liquidated. The FDIC collected a total of $99.7 million. Thus, at the end of 1981, the FDIC held roughly $1.8 billion in failed bank assets, the same amount with which it began the year.
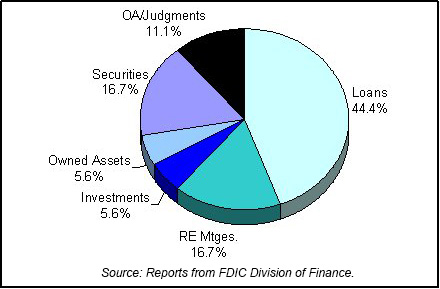
At the end of 1981, the Division of Liquidation handled a total of 99 active bank receiverships located in 25 states, the U.S. Virgin Islands, and Puerto Rico. Of those, four receiverships were handled from the Washington office, and 95 were handled from the 48 field liquidation offices. Table 4-4 shows the FDIC’s assets in liquidation and Chart 4-1 shows the asset mix.
Table 4-4
| 1981 FDIC End of the Year Assets in Liquidation ($ in Billions) | |||
|---|---|---|---|
| Asset Type | 12/31/80 Book Value | 12/31/81 Book Value | 12/31/81 Estimated Recovery Value |
| Loans | $0.9 | $0.8 | $0.2 |
| Real Estate Mortgages | 0.4 | 0.3 | 0.2 |
| Investments | 0.0 | 0.1 | 0.1 |
| Owned Assets | 0.1 | 0.1 | 0.1 |
| Charge-Offs | 0.2 | 0.0 | 0.0 |
| Securities | 0.0 | 0.3 | 0.1 |
| Other Assets/Judgments | 0.2 | 0.2 | 0.0 |
| Total | $1.8 | $1.8 | $0.7 |
Source: Reports from FDIC Division of Finance.
Insurance Fund and Staffing
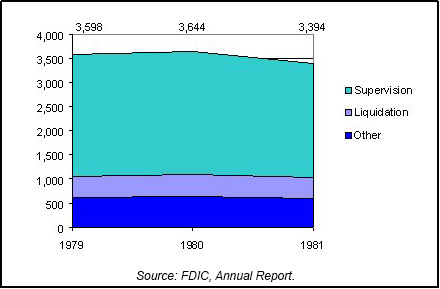
Despite the extraordinary expenses resulting from the merger assistance provided to three large New York City savings banks, the deposit insurance fund increased during 1981 to a new year-end high of $12.2 billion, an increase of $1.2 billion or 11.1 percent over 1980. FDIC employment at the end of 1981 totaled 3,394. The Division of Liquidation staff decreased from 460 at the end of 1980 to 429 at the end of 1981. The Division of Bank Supervision staff decreased from 2,544 at the end of 1980 to 2,359 at the end of 1981. Chart 4-2 shows the staffing levels for the past three years.
4-1 Bureau of Economic Analysis, Department of Commerce. Back to text
4-2 CB Commercial Torto/Wheaton Research and Bureau of Labor Statistics, Department of Labor. Back to text
4-3 Housing Market Statistics, National Association of Home Builders (June 1996), and CB Commercial Torto/Wheaton Research. Back to text
4-4 Housing Market Statistics, National Association of Home Builders (June 1996), and Federal Home Loan Mortgage Corporation. Back to text
4-5 Jack L. Hervey, “The 1973 Oil Crisis: One Generation and Counting,” Chicago Fed Letter, no. 86 (October 1994), 1. Back to text
4-6 Annual Energy Review 1988, Energy Information Administration and Gerald H. Anderson, “The Decline in U.S. Agricultural Exports,” Federal Reserve Bank of Cleveland Economic Commentary, (Feb. 15, 1987), 1. Back to text
4-7 Gerald H. Anderson, “The Decline in U.S. Agricultural Exports,” Federal Reserve Bank of Cleveland Economic Commentary, (Feb. 15, 1987), 1. Back to text
4-8 Federal Reserve System, Board of Governors, Flow of Funds Accounts, Table L. 102. Gerald H. Anderson, “The Decline in U.S. Agricultural Exports,” Federal Reserve Bank of Cleveland Economic Commentary (February 15, 1987). Back to text
4-9 Bureau of the Census, Building Permits Section, Manpower and Construction Statistics Branch. Back to text
4-10 CB Commercial Torto/Wheaton Research. Back to text
4-11 This figure does not include open bank assistance transactions from 1934-1980. The FDIC did not begin including assistance agreements with the failures for reporting purposes until 1981. Five assistance agreements, with total deposits of $6.8 billion, should be included in the overall totals. Back to text
Table of Contents