
Managing the Crisis: The FDIC and RTC Experience — Chronological Overview
Chapter Twenty-Six: 2003
Chairman Donald E. Powell is quoted in the FDIC's 2003 Annual Report as stating, “During 2003 our focus was to promote the stability of the financial services industry, develop and effectively articulate sound policy, and research and administer corporate operations in a manner consistent with good stewardship of the deposit insurance funds.”
Table 26-1
| 2002 - 2003: FDIC at a Glance ($ in Millions) | |||
|---|---|---|---|
| 12/31/02 | 12/31/03 | Percent Change | |
| Number of Bank Failures |
11 | 3 | -72.73% |
| Total Assets of Failed and Assisted Banks | $2,914.5 | $1,138.0 | -60.95% |
| Estimated Losses on Failed and Assisted Banks |
$629.8 | $103.7 | -83.53% |
| Estimated Losses as a Percent of Total Assets | 21.61% | 9.11% | -57.84% |
| Assets in Liquidation | $1,240.3 | $806.4 | -34.98% |
| FDIC Staffing | 5,430 | 5,311 | -2.19% |
| Number of Problem Financial Institutions | 136 | 116 | 19.30% |
| Bank Insurance Fund Balance | $32,050.3 | $33,782.2 | 5.40% |
| Bank Insurance Fund Balance as a Percent of Insured Deposits | 1.27% | 1.31% | 3.15% |
| Savings Insurance Fund Balance | $11,746.7 | $12,240.1 | 4.20% |
| Savings Insurance Fund Balance as a Percent of Insured Deposits | 1.38% | 1.40% | 1.45% |
Source: FDIC, 2003 Annual Report and Reports from FDIC Division of Finance and Division of Research and Statistics.
Notable Events
- The FDIC established an inter-divisional Risk Analysis Center (RAC) to identify, quantify, and respond more quickly and effectively to existing and emerging risks to the deposit insurance funds.
- In partnership with the academic community, the FDIC established the Center for Financial Research (CFR) to encourage and support innovative research on topics that are important to the FDIC's role as deposit insurer and bank supervisor.
- Under the leadership of FDIC Vice Chairman John Reich, the FDIC joined other financial institution regulators in a multi-year interagency effort to eliminate outdated or unnecessary regulations that impose costly and time consuming burdens on the banking industry.
- During 2003, the FDIC resolved three financial institution failures, with total assets of $1.1 billion, and deposits of $1 billion.
- In June 2003, the FDIC Chairman appointed David C. Cooke as the agency's first Chief Learning Officer to head the new Corporate University (CU). The CU represents a departure from traditional training approaches and will provide a continual learning environment for FDIC employees. It will use numerous tools and techniques to prepare them for a changing banking, economic and regulatory landscape. The CU provides opportunities for employees to enhance their sense of corporate identity while learning more about the FDIC's major program areas of Insurance, Supervision and Consumer Protection, and Receivership Management. Further, the CU will be a leader in leveraging technology to improve the efficiency and effectiveness of all Corporate training.
- On October 24, the FDIC, in association with the SW Graduate School of Banking and Southern Methodist University's Cox School of Business, presented the Lessons Learned from Recent Bank Failures symposium. This conference served as a forum for academics, regulators, and industry participants to present analyses and to debate the causes and costs of recent bank failures. Presentations and discussions centered on the root causes of recent bank failures, the impact of new banking activities on bank failures, and the costs of recent bank failures.
USA Patriot Act
Since the enactment of the USA PATRIOT Act (Uniting and Strengthening America by Providing Appropriate Tools Required to Intercept and Obstruct Terrorism Act of 2001), the FDIC has participated in numerous interagency working groups to draft revisions to the Bank Secrecy Act as required by the USA PATRIOT Act and to develop interpretive guidance for the financial services industry. In May 2003, the FDIC, in conjunction with other regulatory agencies, jointly issued a final rule to implement Section 326 of the USA PATRIOT Act. Section 326 requires financial institutions to implement a customer identification program to verify the identity of customers opening new accounts. The FDIC has taken steps to educate its examination staff and members of the banking industry on the USA PATRIOT Act at outreach events, training conferences, and seminars. To assist financial institutions in their efforts to comply with the Bank Secrecy Act and the USA PATRIOT Act, the FDIC publicly released its examination procedures for the Bank Secrecy Act in October 2003.
To facilitate industry cooperation with law enforcement authorities in their ongoing investigation of terrorist activities through the implementation of Section 314(a) of the USA PATRIOT Act, the FDIC also worked with other federal banking regulators to incorporate point-of-contact information as a required item in the Call Report, beginning with the March 2003 Call Report. The FDIC is the only banking regulator to use this mechanism thus far to provide current point-of-contact information to the Financial Crimes Enforcement Network (FinCEN) to aid in its distribution of Section 314(a) information-sharing requests.
Money Smart Financial Literacy Program
One of the Corporation's top priorities in 2003 was the continued promotion of financial education through its Money Smart Program. The FDIC was awarded the prestigious Service to America Business and Commerce medal in October 2003 for its efforts in promoting financial literacy using the Money Smart curriculum. These medals honor people and organizations that have shown a strong commitment to public service and have made a significant contribution in their field of government that is innovative, high-impact and critical for the nation.
Since its introduction in July 2001, the Money Smart program has generated a great deal of interest. Primarily designed to help adults with little or no banking experience develop positive relationships with insured depository institutions, the program has been widely cited in over 100 national and local publications. Requests for the program have been received from Mexico, Thailand, and Canada. During 2003, the FDIC continued to expand the public's access to Money Smart by translating the program into Chinese and Korean and expanding membership in the Money Smart Alliance. By year-end 2003, the FDIC had trained over 5,000 volunteer instructors, taught over 100,000 consumers and supplied more than 111,000 copies of the Money Smart training curriculum to various groups, including government, community, financial, and faith-based organizations.
Economic/Banking Conditions
The U.S. economic trends were more positive as firms improved operations and globalization moved more to the forefront. GDP was up over 100 basis points to 4.9 percent. Unemployment decreased to 6.1 percent and total employment improved by 1.5 percent. Inflation was a modest 1.9 percent. In response to the warming economy the discount rate was raised to 2 percent, but prime rate was reduced to 4 percent, and the 30-year mortgage rate average dropped to 5.9 percent. Housing starts increased by 8.3 percent to 1,847,700, and existing sales were up 11.5 percent. Office vacancies were relatively flat, however, with a slight increase of 0.3 percent to16.8 percent. Even with employment growth, the office market was still recovering from a certain amount of ‘shadow space’ overhang from earlier dramatic office worker reductions. Shadow space is unoccupied, usable space within a leased building that could not be shed due to contractual obligations as the firms reduced staff.26-1
The commercial banking industry remained profitable during 2003 with record high earnings noted in the fourth quarter – the fourth consecutive quarter that industry earnings set a record. Returns on assets and equity continued their rising trends. Commercial bank assets grew 7.2 percent this year and equity capital increased 6.6 percent.
The net interest margin reached its lowest year-end point in more than 10 years, at 3.8 percent. Recent margin compression, a consequence of the very low interest rate environment, contributed to declining profitability, particularly for small banks. Non-interest income increased to a record 44 percent of total revenue, which can largely be explained by the increased servicing fees. Non-interest expense grew slightly during 2003.
Commercial and Industrial loans declined 4.6 percent in 2003 which can be attributed to a tightening in lending standards and increased competition from nonfinancial firms, creating a lower demand for loans. The delinquency rate fell one full percent to 2.9 percent. Home mortgage rates dropped, causing record-breaking home sales. The growth in home mortgages and refinancing caused the share of total bank assets for residential mortgages and mortgage backed securities to be 28.5 percent at the end of the year. Bank securities expanded in 2003—at a 9.4 percent growth rate (the second highest it has been in the last decade).
Core deposits increased 7.1 percent, even as banks reduced rates they paid on money market deposits and savings accounts. Managed liabilities also expanded 7.2 percent as both banks and savings institutions increased their borrowings from the Federal Home Loan Bank.26-2
Overall, 9,196 financial institutions were in operation at the end of 2003. This year marks the eighth straight year that the number of financial institutions has fallen; down from 12,009 in 1995. The number of banks on the problem bank list decreased from 136 to 116.26-3
Table 26-2 shows the number and total assets of FDIC insured institutions, as well as their profitability as of the end of 2003.
Table 26-2
Open Financial Institutions Insured by FDIC ($ in Billions)
| BIF Members | |||
|---|---|---|---|
| 2002 | 2003 | Percent Change | |
| Number | 8,125 | 7,996 | -1.59% |
| Total Assets | $7,336.2 | $7,899.3 | 7.68% |
| Return on Assets | 1.32% | 1.40% | 6.06% |
| Return on Equity | 14.34% | 15.21% | 6.07% |
| SAIF Members | |||
|---|---|---|---|
| Item | 2002 | 2003 | Percent Change |
| Number | 1,229 | 1,186 | -3.50% |
| Total Assets | $1,100.0 | $1,177.5 | 7.05% |
| Return on Assets | 1.17% | 1.25% | 6.84% |
| Return on Equity | 12.79% | 13.86% | 8.37% |
| US Branches of Foreign Banks | 18 | 14 | -22.22% |
Source: FDIC Quarterly Banking Profile, Fourth Quarter 2003.
Bank Failures
During 2003, the FDIC resolved three BIF-insured institution failures using purchase and assumption agreements; the most notable of which was the failure of Southern Pacific Bank (SPB), Torrance, California. SPB, with total assets of $1.1 billion, was closed on February 7. The insured deposits and a large portion of its assets were sold to another FDIC-insured institution. SPB had several unique business lines within its commercial loan portfolio including movie production and distribution, commercial aircraft lease financing, leasing of tobacco drying facilities, telecommunications, and asset based lending. Additionally, SPB's wholly owned subsidiary, Imperial Warehouse Finance, Inc., was an active residential mortgage warehouse lender that financed some 12,500 mortgages for more than $2.4 billion during its last full year of operation.
A more recent estimate of losses per transaction type is shown in Table 26-3.
Table 26-3
| 2003 Estimated Losses by FDIC Transaction Type ($ in Millions) | ||||
|---|---|---|---|---|
| Transaction Type | Number of Transactions | Total Assets | Estimated Loss* as of 12/31/03 | Estimated Losses as a Percent of Assets |
| P&As | 3 | $1,138.0 | $103.7 | 9.11% |
Source: FDIC Quarterly Banking Profile, Fourth Quarter 2003.
Payments to Depositors and Other Creditors
In the three financial institutions that failed in 2003, deposits totaled $1 billion in 20,239 deposit accounts. The insured deposits of all three institutions were transferred to an acquiring institution. Dividends paid on all active receiverships totaled almost $1.1 billion in 2003.
There have been a total of 2,229 insured financial institution resolutions since the FDIC began operations in 1934. Of this total, 1,480 were P&A transactions, 141 were open bank assistance transactions, and 608 were deposit payoff transactions.
Total disbursements by the FDIC since January 1, 1934, have amounted to almost $112.5 billion. Of that amount, actual and projected recoveries are anticipated to be approximately $73.5 billion, which equates to a projected loss of $39 billion to the BIF/SAIF funds.
Asset Disposition
At the beginning of 2003, the FDIC held $1.2 billion in assets from failed institutions. That included $657 million in BIF assets, $173 million in RTC assets, $13 million in FSLIC Resolution Funds (FRF) assets, and $397 million in assets from SAIF–insured institutions. During the year, the FDIC acquired an additional $1.5 billion in assets from three financial institution failures. The failure of Southern Pacific Bank alone was responsible for over $1 billion of the assets acquired during the year. The FDIC collected almost $1.6 billion during the year, and the ending balance for assets in liquidation was $806.4 million. Of the $806.4 million, $347.5 million was assets in liquidation for BIF, $121.8 million for RTC, $3.2 million for FRF, and $333.9 million for SAIF.
The FDIC also had over $76 million in non-asset related collections during this year. While these collections came from a number of different sources, $38 million was the result of recoveries from fidelity bond insurance claims, director and professional liability settlements, and criminal restitutions, and another $9 million represented recoveries of state and federal tax benefits due to failed institutions. Within 10 months after the failure of SPB, the receivership had resolved almost 94 percent of SPB's assets.
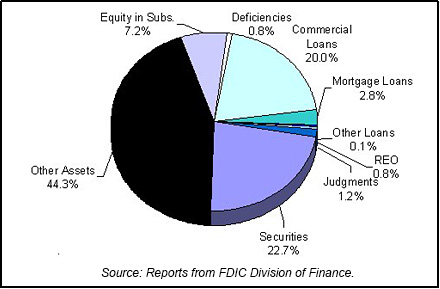
Table 26-4 shows the FDIC's assets in liquidation and Chart 26-1 shows the asset mix.
Table 26-4
| 2003 FDIC End of the Year Assets in Liquidation ($ in Millions*) | |||||||
|---|---|---|---|---|---|---|---|
| Asset Type | 12/31/02 Book Value |
2003 Assets Acquired |
2003 Prin. Coll. |
2003 Write Downs |
2003 Book Value |
2003 Est. Rec Value |
|
| Commercial Loans | $278.5 | $902.5 | -$9.3 | $1,010.1 | $161.6 | $765.2 | |
| Mortgage Loans | 45.8 | 423.2 | -1.6 | 444.7 | 22.7 | 432.5 | |
| Other Loans | 3.1 | 33.9 | -19.2 | 16.8 | 1.0 | 13.4 | |
| Real Estate Owned | 9.3 | 0.0 | 1.8 | 4.9 | 6.2 | 5.3 | |
| Judgments | 21.0 | 0.0 | 1.8 | 12.8 | 10.0 | 36.3 | |
| Securities | 142.5 | 121.4 | 187.3 | 268.4 | 182.8 | 227.5 | |
| Other Assets | 539.5 | 41.8 | -60.2 | 163.6 | 357.5 | -0.1 | |
| Equity in Subs. | 193.9 | 0.2 | -95.3 | 40.7 | 58.1 | 0.6 | |
| Deficiencies | 6.7 | 0.0 | 0.0 | 0.2 | 6.5 | 87.8 | |
| Totals | $1,240.3 | $1,523.0 | $5.3 | $1,962.2 | $806.4 | $1,568.5 | |
Source: Reports from FDIC Division of Finance.
Insurance Fund and Staffing
Both insurance funds continued to rise. The BIF increased by $1.7 billion to $33.8 billion, and the SAIF increased by $493 million to $12.2 billion, compared to similar increases of $1.6 billion and $812 million, respectively, in 2002.
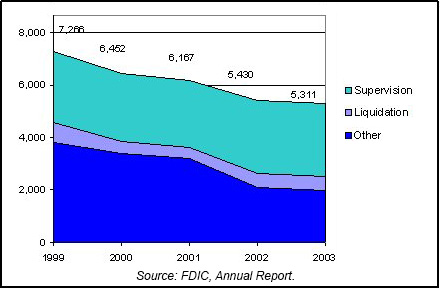
The FDIC has been downsizing its workforce for more than a decade, as the residual workload from the banking and thrift crises has gradually been completed. In mid-2003, a reduction in force was implemented to address 43 identified surplus positions that remained following aggressive efforts in 2002 and early 2003 to align staffing with current workload through voluntary measures. Total staffing for 2003 declined 2.2 percent from the year-end 2002 figures, for an ending total of 5,311.
Staffing at the FDIC has decreased 66 percent since the all-time high total of 15,585 at the second quarter of 1992. Chart 26-2 shows the staffing levels for the past five years.
The FDIC initiated a number of projects in 2003 to better manage and leverage its resources to meet potential challenges in the resolution of future financial institution failures. These projects were in the areas of processing depositor claims, franchise and asset marketing, asset valuation and sales, asset servicing, receivership operations and management, information systems, planning and communication, cost containment, and field operations.
26-1
Bureau of Labor and Statistics, Department of Labor; Bureau of Economic Analysis, Department of Commerce; Housing Market Statistics, National Association of Home Builders; and Federal Home Loan Mortgage Corporation. Back to Text
26-2
Federal Reserve Bulletin Volume 90, Number 6, June 2004. Back to Text
26-3
FDIC Quarterly Banking Profile, Fourth Quarter 2003. Back to Text
Table of Contents