
Managing the Crisis: The FDIC and RTC Experience — Chronological Overview
Chapter Thirteen: 1990
In step with his predictions a year earlier after "the most demanding year” in the FDIC's history, Chairman L. William Seidman characterized the year 1990 in that year's Annual Report as having "presented difficulties and challenges far beyond anyone's expectations.”
Table 13-1
| 1989 - 1990: FDIC at a Glance ($ in Millions) | |||
|---|---|---|---|
| 12/31/89 | 12/31/90 | Percent Change | |
| Number of Bank Failures | 206 | 168 | -18.45% |
| Assistance to Open Banks | 1 | 1 | 0.00% |
| Total Failed and Assisted Banks | 207 | 169 | -18.36% |
| Total Assets of Failed and Assisted Banks | $28,935.0 | $16,937.7 | -41.46% |
| Estimated Losses on Failed and Assisted Banks |
$6,198.8 | $2,786.3 | -55.05% |
| Estimated Losses as a Percent of Total Assets | 21.42% | 16.45% | -23.20% |
| Assets in Liquidation | $25,930.6 | $30,906.5 | 19.19% |
| FDIC Staffing | 10,187 | 14,348 | 40.85% |
| Number of Problem Banks | 1,109 | 1,046 | -5.68% |
| Bank Insurance Fund Balance | $13,209.5 | $4,044.5 | -69.38% |
| Bank Insurance Fund Balance as a Percent of Insured Deposits | 0.70% | 0.21% | -70.00% |
Source: FDIC, 1990 Annual Report and Reports from FDIC Division of Finance and Division of Research and Statistics.
Notable Events
The most important problem was the increased stress on the Bank Insurance Fund (BIF), which suffered a third consecutive year of decline, ending the year with a balance of only $4 billion, or about 21 cents per every $100 of insured deposits. According to its 1991 audit of the BIF’s financial statement for 1990, the General Accounting Office concluded as follows: “Given the minimum level of identifiable exposure facing the Fund from bank failures likely to occur in 1991, we believe that the Fund in all likelihood will be insolvent by December 31, 1991.13-1
Economic/Banking Conditions
In 1990, the Gross Domestic Product (GDP) growth rate slipped as the Persian Gulf War started. Over the year there was only minimal growth in GDP, 1.3 percent.13-2 Employment growth slipped to 1.2 percent while the unemployment rate rose to 5.6 percent.13-3 Inflation also increased slightly to 4.4 percent.13-4 Interest rates remained constant with the discount rate at 7 percent and the 30-year mortgage rate at 10.1 percent.13-5 The office vacancy rate continued to increase and was at 18.5 percent. Decreases in home sales and housing starts also indicated a weakening real estate market. Sales were down 6.3 percent, and starts were down 13.3 percent for the year.13-6
Bank failures in the Southwest dropped to 120, though still accounting for more than 70 percent of all failures for the year. The regional economy outperformed GDP as the economy was beginning to become healthy again.13-7 Lending was still tightening in all areas, and commercial real estate loans, at 6.8 percent of assets, and Commercial and Industrial loans, at 7.8 percent of assets, fell below the national medians of 7 percent and 8 percent of assets, respectively. Total loans and leases in the region were only 45 percent of assets, while the national median was at 55 percent.
Agricultural banking continued to recover, with bank failures falling to 7.1 percent of all bank failures. Nonperforming agricultural bank loans also dropped to 2.6 percent of all loans, down from the 6.7 percent peak in 1986. The share of CAMEL 4 and 5 rated agricultural banks also improved to 15.5 percent of all troubled banks, the lowest in the period between 1980 and 1990.
Banking problems were beginning to shift to the Northeast and to California. In the Northeast, real estate values were falling as the market was collapsing and residential and commercial vacancy rates were rising.13-8 New York City’s office market was overbuilt, and its housing market was weakening.13-9 The condominium market, notably Connecticut’s, was overflowing with some areas having more than a two-year supply.13-10 That collapse of the real estate market was felt by the banking industry in the region. Forty percent of all banks in the Northeast reported negative income for 1990, and median return on assets for Northeastern banks was at a low 0.2 percent and was falling as the national median was rising to 0.7 percent. Nonperforming assets peaked at 5 percent of assets, and nonperforming loans were more than 8 percent of all loans. There were 16 failures in the region, including Seamen’s Bank for Savings, New York City, New York with assets totaling $2.4 billion and an estimated loss of $189 million to the BIF.
California was experiencing its worst downturn since the Great Depression, slipping into a 38-month recession. Real estate values in the “hot” coastal markets had fallen 10 percent to 20 percent in the past 12 months.13-11 Rent rates in Los Angeles also were declining. Despite the overbuilt real estate markets in the state, especially in southern California, total real estate loans continued to rise to about 39 percent of assets, and commercial real estate loans, as a percentage of total assets, were almost 20 percent higher than the U.S. median. California’s employment figures peaked and the state had an unemployment level of 5 percent, which was still below the national rate.13-12 The “Big Four” continued to fare well, due in part to their diversified activity throughout the state. The average return on assets for those four banks was at 1.1 percent, more than 50 basis points above the national average for all banks.
The number of banks chartered in the year declined to 168 institutions. During 1990, the number of problem commercial banks and saving banks insured by the FDIC declined, but the volume of assets in those institutions increased dramatically. Thus, while there were 1,046 problem banks at the end of 1990, compared to 1,109 at the end of 1989, the banks on the problem list had $408.8 billion in assets, up from $235.5 billion the previous year. Key indicators of asset quality showed that 1990 was more troublesome than 1989 for commercial banks, especially banks with large commercial real estate and construction and development loan portfolios. By the end of 1990, 2.9 percent of all commercial banking assets were classified as troubled (loans 90 days or more past due, nonaccrual loans, and other real estate owned); that was the highest level since banks began reporting detailed information on troubled assets in 1982. The banking industry’s inventory of troubled assets increased by $23.5 billion in 1990, significantly higher than the previous year’s $8.2 billion increase. Net charge-offs rose to a record $29 billion, compared with the previous high of $23 billion in 1989.
Savings banks in particular were hit hard in 1990. An aggregate net loss of $2.5 billion was reported by the 456 FDIC insured state and federally chartered savings banks, more than three times the $773 million lost by savings banks in 1989. Most of those institutions were in the Northeast, and losses were attributed to continuing difficulties in commercial and residential real estate markets in New England and other Northeastern states.
During 1989 and 1990, troubled assets at BIF insured savings banks increased from 1.51 percent of total assets to 5.04 percent of total assets. Savings banks in New England lost nearly 19 percent of equity capital in 1990 due to large provisions for loan loss reserves. Those reserves more than quadrupled from $790 million in 1988 to $3.5 billion in 1990. By the end of 1990, 34 savings banks were on the problem bank list compared to only 17 at the end of 1989. In addition, there were 446 Savings Association Insurance Fund (SAIF) insured savings banks with combined assets of $231 billion on the FDIC’s problem list by the end of 1990.
Table 13-2 shows the number and total assets of FDIC insured institutions, as well as their profitability as of the end of 1990.
Table 13-2
Open Financial Institutions Insured by FDIC ($ in Billions)
| Commercial Banks - FDIC Regulated | |||
|---|---|---|---|
| Item | 1989 | 1990 | Percent Change |
| Number | 12,709 | 12,343 | -2.88% |
| Total Assets | $3,299.4 | $3,389.5 | 2.73% |
| Return on Assets | 0.49% | 0.48% | -2.04% |
| Return on Equity | 7.71% | 7.45% | -3.37% |
| Savings Banks - FDIC Regulated | |||
|---|---|---|---|
| Item | 1989 | 1990 | Percent Change |
| Number | 469 | 456 | -2.77% |
| Total Assets | $240.5 | $229.3 | -4.66% |
| Return on Assets | -0.11% | -0.76% | -590.91% |
| Return on Equity | -1.42% | -10.34% | -628.17% |
| Savings Associations - OTS Regulated | |||
|---|---|---|---|
| Item | 1989 | 1990 | Percent Change |
| Number | 2,618 | 2,359 | -9.89% |
| Total Assets | $1,187.0 | $1,029.8 | -13.24% |
| Return on Assets | -0.44% | -0.28% | 36.36% |
| Return on Equity | -9.41% | -5.50% | 41.55% |
Source: Reports from FDIC Division of Research and Statistics.
Bank Failures and Assistance to Open Banks
The FDIC resolved a total of 168 failed banks in 1990, a decrease from the 206 failures in 1989. Total assets of failed banks also declined to about $16.9 billion in 1990, down from $28.9 billion in 1989. A total of ten FDIC insured savings banks failed in 1990, more than in the previous seven years combined.
Of the 168 bank failures in 1990, 148 were purchase and assumption (P&A) transactions, including 43 whole bank deals. Of the remaining 20 bank failures, 8 were resolved by payoffs and 12 through insured deposit transfers (IDTs) to other institutions.
Two of the more significant closings in 1990 were in New York City.
- On April 18, 1990, the Office of Thrift Supervision (OTS) closed one of the largest savings banks in New York City, The Seamen's Bank for Savings, founded in 1829. Chase Manhattan Bank assumed the deposits. The Seamen's Bank had assets of $3.3 billion, and insured deposits totaled about $2.1 billion.
- On November 9, 1990, the Office of the Comptroller of the Currency closed Freedom National Bank of New York, New York City, New York, one of the largest minority-owned banks in the country. The FDIC paid off deposits in Freedom National Bank of New York, which had about $101 million in total deposits and $110 million in assets.
The sole open bank assistance (OBA) transaction in 1990 occurred with Pawnee National Bank, Pawnee, Oklahoma. Pawnee National Bank had assets of approximately $14.2 million, and the assistance transaction produced savings of $500,000 to the FDIC, based on the estimated cost of a deposit payoff.
The Financial Institutions Reform, Recovery, and Enforcement Act (FIRREA) of 1989 made savings associations eligible for FDIC assistance under a revision to a 1986 FDIC policy statement regarding open bank financial assistance. In its revised policy dated March of 1990, the FDIC added new criteria to ensure acceptance of most cost-effective proposals for assistance to open banks and savings associations. By the end of 1990, proposals for assistance were received from 50 savings associations, but none were approved, primarily due to insufficient capitalization from non-FDIC sources and the probability that the cost of the requested assistance would be higher than other alternative methods of resolution.
At the end of 1990, three savings banks remained in the Net Worth Certificate Program. The three institutions made required payments to the FDIC of approximately $80 million during the year, reducing the total for certificates outstanding to about $154 million.
On the regulatory front in 1990, the FDIC amended the FDIC Rules and Regulations as follows:
- Part 327 was amended to increase the deposit insurance assessment paid by BIF insured banks from 12 cents per $100 of insured deposits to 19.5 cents per $100, effective January 1, 1991;
- Part 303 was amended to require state chartered savings associations to (1) follow the same investment limitations applicable to federally chartered associations; (2) divest equity investments not specifically permitted under FIRREA; and (3) prohibit the acquisition of, and require divestiture of, junk bonds;
- Part 323 was added pursuant to FIRREA as follows: to (1) require an appraisal on real estate transactions valued at greater than $50,000; and (2) set minimum standards for performing appraisals.
Significant litigation matters initiated in 1990 included the filing of a $200 million action against the former officers, directors, and attorneys of the failed Silverado Banking, Savings and Loan Association, Denver, Colorado. On November 14, 1990, the FDIC and the RTC filed a $6.8 billion bankruptcy claim against the investment firm of Drexel Burnham Lambert, Inc. to recover on losses in junk bonds and other securities transactions sustained by 45 failed financial institutions.
A recent estimate of losses per transaction type is shown in Table 13-3.
Table 13-3
| 1990 Estimated Losses by Transaction Type ($ in Millions) | ||||
|---|---|---|---|---|
| Transaction Type | Number of Transactions | Total Assets | Estimated Loss* | Estimated Losses as a Percent of Assets |
| OBA | 1 | $14.2 | $2.3 | 16.20% |
| P&As | 148 | 14,388.9 | 2,034.1 | 14.14% |
| IDTs | 12 | 1,660.3 | 482.6 | 29.07% |
| Payoffs | 8 | 874.3 | 267.3 | 30.57% |
| Totals | 169 | $16,937.7 | $2,786.3 | 16.45% |
Source: Reports from FDIC Division of Research and Statistics.
Payments to Depositors and Other Creditors
In the 169 banks that failed or were assisted in 1990, deposits totaled $15.1 billion in 2,168,156 deposit accounts. There was one assistance agreement with an institution with total deposits of $14.6 million. Payoffs accounted for eight transactions with total deposits of $819.3 million in 75,069 deposit accounts. Dividends paid on all active receiverships totaled $5.9 billion in 1990.
Of the 1,813 insured bank resolutions13-13 since the FDIC began operations in 1934, 1,019 were P&A transactions and 173 additional transactions were whole bank deals. There were 552 deposit payoff transactions (including 145 IDTs). There have been 69 OBA transactions since 1981.
Total disbursements by the FDIC since January 1, 1934, amounted to $66.7 billion. Of that amount, the FDIC recovered $39.2 billion, for a net loss of $27.5 billion.
Asset Disposition
At the beginning of 1990, the FDIC had $25.9 billion in assets in liquidation from failed banks. The FDIC handled 168 bank failures and acquired $11.7 billion in BIF assets for liquidation. Principal collections equaled $2.8 billion for BIF and $1.5 billion for the FSLIC Resolution Fund (FRF), for a total of $4.3 billion. By the end of 1990, the FDIC was managing the disposition of $30.9 billion in assets from failed financial institutions. At the end of the year, assets from BIF insured failed banks represented about $18 billion of the total. That was a $6.5 billion increase of failed bank assets over the $11.5 billion held at the close of 1989. The $14.4 billion in assets acquired from FSLIC by the end of 1989 had been decreased through collections by $1.5 billion to reach the 1990 ending balance of $12.9 billion.
In 1990, the FDIC was completing its first year of managing the assistance agreements FSLIC had entered into with acquirers of failed thrifts. Beginning in late 1989, the FDIC had 219 assistance agreements; by the end of the year, the number of agreements had dwindled to 156, as contracts with acquirers expired or were terminated. Booked as a liability of FRF, financial assistance to acquirers under the various agreements in 1990 was approximately $19 billion.
During 1990, the FDIC was also managing a $1.1 billion portfolio of capital instruments, including net worth certificates and stock that had been acquired by FSLIC in assistance transactions in which FSLIC had taken an equity interest in the acquirer. By the end of the year, the FDIC had negotiated the liquidation or restructuring of more than half of those equity interests (about $560 million). Pursuant to FIRREA, most of those capital instruments could no longer qualify as core capital for the acquiring institutions. The FDIC's disposal of the capital instrument portfolio was important to assist the acquirers in their efforts to comply with current capital requirements.
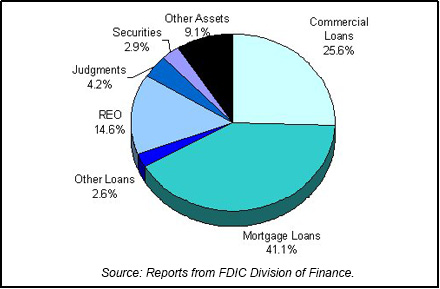
Table 13-4 shows the FDIC's assets in liquidation and Chart 13-1 shows the asset mix.
Table 13-4
| 1990 FDIC End of the Year Assets in Liquidation ($ in Billions*) | ||||||
|---|---|---|---|---|---|---|
| Asset Type | 12/31/89 Book Value | 1990 Assets Acquired | 1990 Prin. Coll. | 1990 Write Downs | 12/31/90 Book Value | 12/31/90 Est. Rec. Value |
| Commercial Loans | $7.1 | $2.9 | $1.1 | $1.0 | $7.9 | $3.2 |
| Mortgage Loans | 8.6 | 5.5 | 1.0 | 0.4 | 12.7 | 7.0 |
| Other Loans | 0.7 | 0.6 | 0.4 | 0.1 | 0.8 | |
| Real Estate Owned | 5.0 | 0.5 | 0.5 | 0.5 | 4.5 | 2.3 |
| Judgments | 0.8 | 0.7 | 0.0 | 0.2 | 1.3 | |
| Securities | 0.5 | 1.2 | 0.8 | 0.0 | 0.9 | 0.8 |
| Other Assets | 3.2 | 0.3 | 0.5 | 0.2 | 2.8 | 1.5 |
| Totals | $25.9 | $11.7 | $4.3 | $2.4 | $30.9 | $14.8 |
Source: Reports from FDIC Division of Finance.
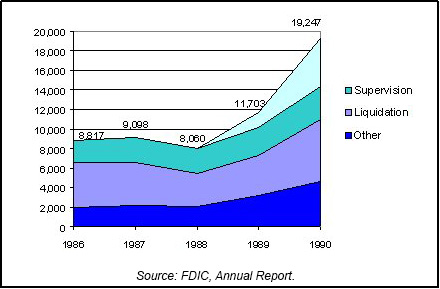
Insurance Fund and Staffing
In 1990, BIF dropped dramatically to $4 billion, down from $13.2 billion a year earlier. FDIC staff grew significantly in 1990, particularly in the Division of Liquidation, Legal Division, and Division of Supervision. Total staff, not including 4,899 at the RTC, had increased to 14,348 by the end of 1990, a 40.8 percent increase over the 10,187 employees at the end of 1989. Division of Supervision staff grew to 3,400, up from 2,903 in 1989. Division of Liquidation staff at the end of 1990 was 6,311, up from 4,141 at the end of 1989. Total staffing including 4,899 RTC employees equaled 19,247. Chart 13-2 shows the staffing levels for the past five years.
The FDIC restructured its regional liquidation operations in 1990, establishing new consolidated field offices in San Antonio, Texas; South Brunswick, New Jersey; and Franklin, Massachusetts.The FDIC also established six real estate sales centers around the country to market major properties acquired from failed institutions. Those centers were located at existing consolidated office sites.
Private Resolutions
The Rhode Island Share and Deposit Indemnity Corporation (RISDIC), created in 1969 to insure deposits at state chartered credit unions, collapsed in December of 1990. Problems at the following member institutions led to the failure of RISDIC:
- Jefferson Loan and Investment Company suffered losses on lease investments purchased from two firms that had since failed;
- Heritage Loan and Investment Company's loan portfolio suffered substantial losses and its president was charged with embezzling $13 million;
- Marquette Credit Union had a negative net worth of $30 million;
- Davisville Credit Union had a negative net worth of $18 million; and
- Rhode Island Central Credit Union had a negative net worth of $19 million and suffered a major run in December of 1990.
When Rhode Island Central Credit Union was denied additional loans from the Rhode Island Credit Union League's Corporate Credit Union, the RISDIC board met on December 31, 1990, to assess the situation and asked that a conservator be appointed.
On January 1, 1991, within a few hours of taking office, the governor of Rhode Island issued an Executive Order closing all 45 RISDIC insured institutions. There were 35 credit unions, seven loan and investment companies, and three banks or trust companies. All closed institutions were ordered to apply for federal insurance. Depositors at nine closed institutions were only allowed to withdraw up to $12,500. By February of 1991, only 27 institutions had reopened. Two had gone out of business (with no losses to depositors) and two were not depository institutions at the time of closing. Fourteen institutions remained closed.
Legislation was enacted to create the Rhode Island Depositors' Economic Protection Corporation (DEPCO). The state issued $150 million to assist in providing 100 percent coverage for all deposits up to $100,000 and partial insurance for deposits over that amount in the 14 closed institutions. The bonds were to be repaid from liquidating the failed institutions' assets and from a 0.5 percent increase in the state sales tax. On February 9, 1991, the governor of Rhode Island promised that payments to depositors would be made within 60 days, but by January of 1992, depositors had received only about 10 percent of their deposits. Nine institutions remained closed despite state efforts to sell them.
By June 1992, 18 months after the closings, all but 38,000 depositors had received their deposits and those depositors had received 90 percent of their money. Costs to the state of Rhode Island reached $471 million as of June 1992.13-14
Table 13-5
Resolution Trust Corporation ($ in Billions)
| 1989 - 1990: RTC at a Glance ($ in Millions) | |||
|---|---|---|---|
| 12/31/89 | 12/31/90 | Percent Change | |
| Number of Conservatorships at the beginning of the year | 0 | 281 | N/A |
| Number of Conservatorships added during the year | 318 | 207 | -34.91% |
| Thrifts in the ARP Program |
0 | 6 |
N/A |
| Total of all thrift takeovers | 318 | 213 | -33.02% |
| Total of thrift resolutions | 37 | 315 | 751.35% |
| Conservatorships resolved during the year | 37 | 309 | 735.14% |
| Conservatorships at the end of the year | 281 | 179 | -36.30% |
| Total Assets at Takeover | |||
|---|---|---|---|
| 12/31/89 | 12/31/90 | Percent Change | |
| Conservatorships | $141,749 | $126,616 | -10.68% |
| Thrifts in the ARP Program | $0 | $3,631 | N/A |
| Total | $141,749 | $130,247 | -8.11% |
| Estimated losses on thrift resolutions |
$51,076 | $20,837 | -59.20% |
| Estimated losses as a percent of total assets | $20,837 | -59.20% | |
| Assets in Liquidation | |||
|---|---|---|---|
| 12/31/89 | 12/31/90 | Percent Change | |
| Conservatorships | $104,899 | $87,467 | -16.62% |
| Receiverships | $7,945 | $59,270 | 646.00% |
| Total | $112,844 | $146,737 | 30.04% |
| RTC Staffing | 1,516 | 4,899 | 223.15% |
Source: RTC, 1990 Annual Report and Reports from FDIC Division of Research and Statistics.
Notable Events
The RTC’s first full year of operation was 1990. Having started operations on August 9, 1989, the RTC faced numerous challenges. In his book, Full Faith and Credit, FDIC Chairman Seidman recalled: “We thought that the size of the problem involved somewhere around 350 to 400 insolvent institutions, with $200 billion in assets. Most would simply have to be taken over and liquidated.”13-15 By the end of 1995, the RTC had closed 747 institutions with a total book value in assets of $402.6 billion; in 1990 alone 315 institutions with $136.2 billion in assets were closed.
Significant events for the RTC in 1990 included the following:
- Peoples Heritage Savings & Loan Association, Salina, Kansas, became the first thrift resolved using a branch breakup method;
- The RTC signed an agreement with the Federal Financing Bank to provide for future quarterly borrowings for working capital;
- Gibraltar Savings, F.A., in Simi Valley, California, with $6.8 billion in assets, was resolved;
- CenTrust Federal Savings Bank, a $6.7 billion thrift in Miami, Florida, was resolved;
- The Accelerated Resolution Program (explained later in this chapter) was announced, and the first four transactions were completed;
- The RTC published an initial $3.7 billion "junk bond” inventory list;
- A program was announced to market hard-to-sell commercial assets in large packages of up to $500 million; and
- The RTC National Sales Center opened in Washington D.C.
S&L Resolutions
At the beginning of 1990, the RTC had 281 thrifts to manage in its conservatorship program. During the year, 207 additional thrifts were placed into conservatorship, and 315 thrifts were resolved (including 6 institutions which had never been placed into conservatorship), leaving 179 thrifts in conservatorship at the end of the year. The 315 resolved thrifts contained 2,362 banking offices located in 42 states.
The RTC conducted 172 P&A transactions involving $77.8 billion in deposits. Premiums paid by acquirers in the P&A transactions totaled $1.25 billion. Premiums paid for deposit portfolios ranged from 1 percent to more than 8 percent of the failed institution's core deposits; the average premium was 2 percent.
There were 96 IDTs in 1990, or about 30 percent of all resolution transactions, involving $13.5 billion in deposits. The IDT method generally was used for smaller institutions, but five thrifts with deposits over $500 million each were resolved in that manner. For the 268 total transactions in which a deposit payoff was avoided, the total estimated savings when compared with the cost of a deposit payoff was $1.4 billion.
Payoffs were conducted for 47 thrifts, or 14.9 percent of all resolutions, in 1990. Total assets at the time of resolution were $4.7 billion. Sixty percent of the payoffs occurred in just three states: Texas, Louisiana, and New Mexico.
Losses per transaction type are shown in Table 13-6 and Table 13-7 shows conservatorships and receiverships at year-end 1990.
Table 13-6
| 1990 Losses by RTC Transaction Type ($ in Millions) | ||||
|---|---|---|---|---|
| Transaction Type | Number of Transactions | Total Assets | Loss* as of 12/31/95 | Estimated Losses as a Percent of Assets |
| P&As | 172 | $77,768.1 | $23,783.6 | 30.58% |
| IDTs | 96 | 13,452.7 | 8,017.6 | 59.60% |
| Payoffs | 47 | 4,746.8 | 3,830.7 | 80.70% |
| Totals | 315 | $95,967.6 | $35,631.9 | 37.13% |
Source: Reports from FDIC Division of Research and Statistics.
Table 13-7
| Conservatorships | |
|---|---|
| Item | Total |
| In Conservatorship at 12/31/89 | 281 |
| Conservatorships added in 1990 | 207 |
| Subtotal | 488 |
| Conservatorships resolved in 1990 (New Receiverships) | 309 |
| Conservatorships remaining 12/31/90 | 179 |
| Receiverships | |
|---|---|
| Item | Total |
| Receiverships as of 12/31/89 | 37 |
| New Receiverships that were previously Conservatorships in 1990 | 309 |
| New Receiverships that were resolved through ARP in 1990 | 6 |
| Total Receiverships during 1990 | 315 |
| Total Receiverships as of 12/31/90 | 352 |
As noted above, the RTC and OTS initiated the Accelerated Resolution Program (ARP), based on the premise that early intervention in troubled institutions could significantly increase savings. In the 1990 pilot program, nine thrifts were targeted, with a total of $3.9 billion in insured deposits. Four of those thrifts were resolved through P&A transactions, with an aggregate total cost of less than half the cost of the 168 non-ARP P&A transactions. In the four ARP resolutions, acquirers purchased 81 percent of all assets compared to 52 percent of all assets purchased in the non-ARP P&A transactions.
The Accelerated Resolution Program (ARP) was designed for open thrifts that failed to meet FIRREA mandated capital levels but that were otherwise perceived as having substantial franchise value. Under the program, troubled institutions were marketed by the RTC, the OTS, and the thrift's management team. When a buyer was found, the thrift was closed and placed with the RTC and reopened immediately under the buyer's new management. The ARP program's results were significant and extremely cost-effective.
The RTC allowed purchasers to bid on all of the branches of a failed thrift (whole franchise basis) or to bid on individual thrift branches or branch clusters (branch breakup basis). The goal of offering options was to expand the universe of potential bidders by allowing institutions interested only in certain branches or markets to participate. The result was more bidders, more competition, and higher premiums. In 1990, 233 thrifts were resolved on a whole franchise basis, while 35 thrifts, or 11 percent of all resolutions, were sold to two or more acquirers. A total of 145 financial institutions acquired one or more branches in the 35 branch breakup transactions.
Early in 1990, RTC Chairman L. William Seidman started "Operation Clean Sweep” to expedite the resolution of a large number of thrifts. On March 21, 1990, Chairman Seidman announced that the RTC would sell or liquidate 141 conservatorship institutions by June 30, 1990, including at least 50 institutions that would be liquidated without any prior sales attempts. The institutions were advertised in The Wall Street Journal.
Payments to Depositors and Other Creditors
In 1990, there were 315 resolutions with total deposits of $87.2 billion in 10,213,526 deposit accounts. Of that total, there were 47 payoff transactions with $5 billion in total deposits in 298,538 deposit accounts.
Of the 352 insured thrift failures since the RTC began operations in August of 1989, 179 were P&A transactions, 51 were payoff transactions, and 122 were IDTs
Asset Disposition
At the beginning of 1990, the RTC had $112.9 billion in assets in liquidation. Assets acquired during the year through conservatorships, other resolved institutions, and putbacks or repurchases totaled $162.1 billion. Losses and collections totaled $128.3 billion for the year. By the end of 1990, the RTC's total for assets in all receiverships and conservatorships was $146.7 billion. Of that total, $59.3 billion were receivership assets.
FIRREA required the RTC to utilize the services of private-sector companies in managing and disposing of assets whenever possible. That was accomplished through the use of interim service agreements, Standard Asset Management and Disposition Agreements (SAMDAs), and other contracting activities. Primarily through those programs, private sector firms were managing $36 billion or 62 percent of the total assets in receivership at the end of the year. Series I SAMDA contractors had $28 billion of that amount.
The SAMDA program was developed to enable the RTC to use private sector contractors whenever possible and appropriate. SAMDAs were contractual agreements for asset management and liquidation services. SAMDAs provided the RTC with a means to dispose of unsold distressed loans and real estate owned. The first SAMDA contract, the Series I contract, began in August 1990. By the end of the year, the RTC had awarded 65 Series I contracts for assets totaling $28 billion in book value.
SAMDA contractors initially focused on working out nonperforming loans or selling properties on an asset-by-asset basis. The Series I SAMDA contracts provided for monthly management fees with incentive disposition fees based on the sale of the individual assets. Management fees were determined as part of the bidding process and could be decreased with each sale or withdrawal of an asset from the pool or increased with each addition of an asset to the pool. Disposition fees were based upon the net proceeds of the sale of each asset and calculated pursuant to certain formulas. Contractors were entitled to earn incentive fees in addition to disposition fees.
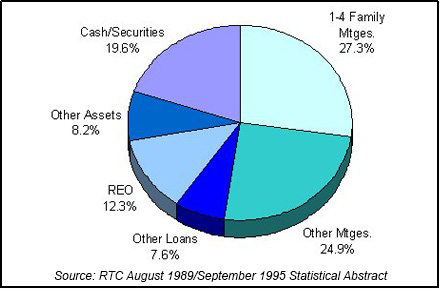
Table 13-8
| 1990 RTC End of the Year Assets in Liquidation ($ in Billions*) | ||||||
|---|---|---|---|---|---|---|
| Asset Type | 12/31/89 Total Book Value | Assets Acq'd During the Year | 1990 Collections | 1990 Losses | 12/31/90 Total Book Value | Memo Item |
| 1-4 Family Mtges | $34.2 | $45.5 | $34.2 | $5.5 | $40.0 | $30.1 |
| Other Mtges | 29.2 | 22.2 | 14.8 | 0.0 | 36.6 | 23.0 |
| Other Loans | 7.2 | 15.9 | 12.0 | -0.1 | 11.2 | 9.2 |
| Real Estate Owned | 14.6 | 9.7 | 2.6 | 3.6 | 18.1 | 8.1 |
| Other Assets | 7.9 | 11.1 | 3.4 | 3.6 | 12.0 | 7.1 |
| Cash/Securities | 19.8 | 57.7 | 45.4 | 3.3 | 28.8 | 14.8 |
| Totals | $112.9 | $162.1 | $112.4 | $15.9 | $146.7 | $92.3 |
Memo Item: Assets transferred from conservatorship to receivership. Does not affect total of assets in liquidation.
Source: RTC August 1989/September 1995 Statistical Abstract.
Staffing
By necessity, the RTC operated at a record-setting pace in establishing an organization that quickly had more assets than any financial institution in the country. From its initial staff of a few hundred FDIC employees, the RTC grew to nearly 5,000 by the end of 1990. During that time, the RTC established a network of four regional offices: Atlanta, Georgia; Dallas, Texas; Denver, Colorado; and Kansas City, Missouri. It also established 14 consolidated offices and 14 sales centers.
13-1 Charles A. Bowsher, Comptroller General of the United States, in a November 1, 1991 letter to the Board of Directors of the Federal Deposit Insurance Corporation. Back to Text
13-2 Bureau of Economic Analysis, Department of Commerce. Back to Text
13-3 CB Commercial Torto/Wheaton Research and Bureau of Labor Statistics, Department of Labor. Back to Text
13-4 Bureau of Labor Statistics, Department of Labor. Back to Text
13-5 Housing Market Statistics, National Association of Home Builders (June 1996), and Federal Home Loan Mortgage Corporation. Back to Text
13-6 CB Commercial Torto/Wheaton Research and Housing Market Statistics, National Association of Home Builders (June 1996). Back to Text
13-7 Bureau of Economic Analysis, Department of Commerce. Back to Text
13-8 National Association of Realtors and CB Commercial Torto/Wheaton Research. Back to Text
13-9 David Brauer and Mark Flaherty, “The New York City Recession,” Federal Reserve Bank of New York Quarterly Review (Spring 1992), 70. Back to Text
13-10 Katherine Morrall, “Weakening Northeast Real Estate Market Raises Concerns,” Savings Institutions Vol. 111, No. 4 Back to Text
13-11 George Salem and Donald Wang, “California Banking: Industry Outlook,” Prudential-Bache Securities (October 15, 1990). Back to Text
13-12 CB Commercial Torto/Wheaton Research and Bureau of Labor Statistic, Department of Labor. Back to Text
13-13 This figure does not include five open bank assistance transactions from 1934-1980. Also, in 1988 there were 21 assistance agreements that resolved 79 institutions. The FDIC annual report (source data) calculates failure data per transaction; this report calculates failures per failed institution. Back to Text
13-14 William B. English, “The decline of private deposit insurance in the United States” (Carnegie-Rochester Conference Series on Public Policy, 1993), 71-72, 119-123. Back to Text
13-15 L. William Seidman, Full Faith and Credit (New York: Times Books, a division of Random House, Inc., 1993) 195. Back to Text
Table of Contents