
Managing the Crisis: The FDIC and RTC Experience — Chronological Overview
Chapter Eleven: 1988
The year 1988 marked a turning point for the FDIC. For the first time since the agency's creation, the FDIC suffered an operating loss?$4.2 billion. That loss was due primarily to the $7.3 billion cost associated with bank failures and assistance transactions in 1988, including $4 billion in estimated costs due to the failure of the insured bank subsidiaries of First RepublicBank Corporation, Dallas, Texas.
Table 11-1
| 1987 - 1988: FDIC at a Glance ($ in Millions) | |||
|---|---|---|---|
| 12/31/87 | 12/31/88 | Percent Change | |
| Number of Bank Failures | 184 | 200 | 8.70% |
| Assistance to Open Banks | 19 | 79 | 315.79% |
| Total Failed and Assisted Banks | 203 | 279 | 37.44% |
| Total Assets of Failed and Assisted Banks | $9,407.0 | $9,407.0 | 472.97% |
| Estimated Losses on Failed and Assisted Banks |
$2,022.8 | $6,920.5 | 242.12% |
| Estimated Losses as a Percent of Total Assets | 21.50% | 12.84% | -40.28% |
| Assets in Liquidation | $11,339.9 | $9,335.9 | -17.67% |
| FDIC Staffing | 9,098 | 8,060 | -11.41% |
| Number of Problem Banks | 1,575 | 1,406 | -10.73% |
| Deposit Insurance Fund Balance | $18,301.8 | $14,061.1 | -23.17% |
| Deposit Insurance Fund Balance as a Percent of Insured Deposits | 1.10% | 0.80% | -27.27% |
Source: FDIC, 1988 Annual Report and Reports from FDIC Division of Finance and Division of Research and Statistics.
Notable Events
Again, a new record was established for the highest number of banks to fail in one day when 40 bank subsidiaries of First RepublicBank Corporation (First RepublicBank) were closed and sold to NCNB Corporation, Charlotte, North Carolina.11-1
Economic/Banking Conditions
Over the year, Gross Domestic Product (GDP) increased by 3.8 percent and the unemployment rate continued to fall.11-2 Employment growth was steady at 2.9 percent, lowering the unemployment rate to 5.5 percent.11-3 Inflation increased slightly to 3.6 percent, up from 3.1 percent in 1987.11-4 The discount rate rose to 6.2 percent, and the 30-year mortgage rate increased slightly to 10.3 percent.11-5 Home sales increased 2 percent while housing starts continued to decrease at a rate of 8.2 percent for the year. The office vacancy rate finally began to stabilize at 17.3 percent.11-6
Bank failures in the Southwest peaked at 214, an overwhelming 76.7 percent of all resolutions. Asset growth rates for the region’s banks were negative for the third consecutive year. The collapse in the oil industry had weakened many banks, and when the real estate market collapsed, banks with large commercial real estate loan portfolios failed in large numbers. There were 174 failed banks in Texas, with assets totaling $46.9 billion. The First RepublicBank chain with assets totaling $33.4 billion was the largest bank failure to date; its estimated loss of $3.9 billion made it the costliest resolution to date (and it remained the costliest through 1997).11-7 The insured subsidiary banks of First City Bancorporation of Texas, Inc. (First City) also were assisted, with $11.2 billion in assets and an estimated loss of $1.1 billion, making First City the third costliest resolution up to that time.11-8
Median home resale prices for the Southwest bottomed out at $61,800, compared to $89,300 for the U.S. in that same year.11-9 Total loans and leases fell for the third straight year to 50.5 percent of assets, but commercial real estate loans at 8.1 percent of assets and Commercial and Industrial loans at 10.1 percent of assets still were above the national medians of 6.6 percent and 8.8 percent of assets, respectively. The regional economy was starting to recover as regional Gross State Product (GSP) outperformed GDP with about 4 percent growth.11-10
Agricultural bank failures began to decline rapidly, both in numbers of failed banks and in percentage of all bank failures. Farm debt also continued to fall to $145.5 billion, down 30 percent from its 1983 peak of $207 billion.11-11 Total failures in the midwest continued their gradual decline to 36 in 1988 after reaching a peak of 56 in 1985.
In 1988, total loans and leases in the Northeast peaked at 73 percent of assets, almost 20 percent higher than the national median. Most banks began to tighten their lending as some industries in the region were seeing cutbacks. With the reduction in defense spending, New England’s defense-related industry shrank, the computer industry in Boston was faltering, and Wall Street employment was decreasing following the stock market crash at the end of 1987.11-12 The repercussions of those cutbacks were not yet being felt, as per capita income in the Northeast was 123 percent of the national average, unemployment for the region stood at 3 percent, and GSP continued to grow at 5 percent.11-13
In California, the “Big Four” banks began to have outstanding results, posting an average return on assets of 1.13 percent, which was 60 basis points above the national average for all banks. The reduction in defense spending led to a decrease in defense-related employment in California.11-14 Japanese investment in California peaked at $16.5 billion, with Japanese ownership of California real estate continuing to increase.11-15 The number of new residential housing permits peaked, and home sales in the state peaked at 562,240.11-16 GSP growth fell to 4.5 percent but was still above national GDP growth.11-17
As stated previously, the Competitive Equality Banking Act (CEBA) of 1987 allowed qualifying agricultural banks to enter a program to amortize losses on agricultural loans and related assets over a seven-year period. A total of 31 banks were in the program by the end of 1988.
The number of banks on the FDIC’s problem bank list declined to 1,406 at the end of 1988 from 1,575 at the end of 1987.
Table 11-2 shows the number and total assets of FDIC insured institutions, as well as their profitability as of the end of 1988.
Table 11-2
Open Financial Institutions Insured by FDIC ($ in Billions)
| Commercial Banks - FDIC Regulated | |||
|---|---|---|---|
| Item | 1987 | 1988 | Percent Change |
| Number | 13,703 | 13,123 | -4.23% |
| Total Assets | $2,999.9 | $3,130.8 | 4.36% |
| Return on Assets | 0.10% | 0.82% | 720.00% |
| Return on Equity | 1.15% | 13.19% | 1,046.96% |
| Savings Banks – FDIC Regulated | |||
|---|---|---|---|
| Item | 1987 | 1988 | Percent Change |
| Number | 463 | 471 | 1.73% |
| Total Assets | $217.1 | $238.1 | 9.67% |
| Return on Assets | 0.80% | 0.46% | -42.50% |
| Return on Equity | 10.17% | 5.93% | -41.69% |
| Savings Associations – FHLBB Regulated | |||
|---|---|---|---|
| Item | 1987 | 1988 | Percent Change |
| Number | 3,139 | 2,967 | -6.08% |
| Total Assets | $1,285.0 | $1,368.40 | 6.49% |
| Return on Assets | -0.58% | -0.44% | 24.14% |
| Return on Equity | -17.24% | -11.75% | 31.84% |
Source: Reports from FDIC Division of Research and Statistics.
Bank Failures and Assistance to Open Banks
There were 200 commercial bank failures in 1988. Texas had more than half of the total with 113, which included the First RepublicBank chain of 40 failed banks. Oklahoma had the second highest number with 23 failures. In all, 28 states had bank failures and/or assistance transactions in 1988.
Purchase and assumption (P&A) transactions accounted for 164 of the bank failures in 1988, and assuming banks paid more than $171 million in premiums. Of the 164 P&As, 69 were whole bank deals. There were 30 insured deposit transfers (IDTs). In two of those cases, transferee institutions purchased all or nearly all of the failed banks' assets. The FDIC received purchase premiums of $4.7 million on those two transactions in 1988. In a year when there were 200 bank failures, the FDIC paid off deposits in only six bank failures.
In 1988, the FDIC entered into 21 assistance transactions that resolved 79 banks, including 59 bank subsidiaries of First City. In addition, there were two banks from the First RepublicBank Corporation chain that received open bank assistance (OBA) early in 1988, but failed later that same year. Those two banks are not counted in the total for assistance transactions.
On April 20, 1988, the FDIC's Board of Directors granted final approval to an assistance plan to recapitalize and to restore to financial health the subsidiary banks of First City, an organization with $13 billion in assets and 59 bank subsidiaries. The FDIC's assistance to First City's subsidiary banks was in the form of $970 million in capital notes. The assistance was short-lived, as all First City banks were closed in 1992. At the time of the assistance, First City held $9.5 billion or 6.43 percent of all Texas deposits.
The largest banking organization to fail in 1988 was First RepublicBank Corporation, Dallas, Texas, which had 40 banks in Texas and one bank in Delaware and had gross assets of $32.4 billion. First RepublicBank Corporation was the largest banking organization in the state of Texas, with $20.6 billion in Texas deposits or 13.64 percent of all Texas deposits and was the 14th largest bank holding company in the country.
In March 1988, the FDIC provided an interim financial assistance package consisting of a $1 billion loan to First RepublicBank's two largest banks, located in Dallas and in Houston. In July 1988, the FDIC notified the other regulators involved that the $1 billion loan would not be renewed, which led to the determination that the lead bank (the Dallas bank) was not viable.
The banks were declared insolvent by their chartering authorities and closed on July 29, 1988. After extensive negotiations with several interested parties, the FDIC entered into an agreement with NCNB, Charlotte, North Carolina. Utilizing the bridge bank legislation enacted in 1987, NCNB Texas National Bank, a bridge bank, was established by the FDIC. The bridge bank was assumed by NCNB Corporation, Charlotte, North Carolina, the same day. In connection with the failure of the First RepublicBank chain, its credit card subsidiary, the First RepublicBank, Delaware, Newark, Delaware, was declared insolvent and closed on August 2, 1988. The Delaware Bridge Bank, N. A., was established to take certain assets and liabilities of the failed credit card subsidiary bank. The Delaware Bridge Bank was assumed by Citibank, New Castle, Delaware, on September 9, 1988.
In 1988, outstanding net worth certificates were reduced by $18.1 million through contractually required payments. New issues, however, caused the total dollar amount outstanding to increase. By the end of the year, three banks had net worth certificates outstanding in the aggregate amount of $322 million.
Since the Capital Forbearance Program began, the FDIC had received 312 applications for forbearance by the end of 1988. Of the 181 banks admitted to the program, 56 were terminated for various reasons, leaving 125 banks in the program at the end of 1988. Applications of 84 banks had been denied, and 21 were being processed. In 26 cases, the applications were withdrawn or not processed for other reasons.
A recent estimate of losses per transaction type is shown in Table 11-3.
Table 11-3
| 1988 Estimated Losses by Transaction Type ($ in Millions) | ||||
|---|---|---|---|---|
| Transaction Type | Number of Transactions | Total Assets | Estimated Loss* | Estimated Losses as a Percent of Assets |
| OBA | 79 | $15,494.0 | $1,540.6 | 9.94% |
| P&As | 164 | 37,028.3 | 4,950.4 | 13.37% |
| IDTs | 30 | 1,244.5 | 391.1 | 31.43% |
| Payoffs | 6 | 132.6 | 38.4 | 28.96% |
| Totals | 279 | $53,899.4 | $6,920.5 | 12.84% |
Source: Reports from FDIC Division of Research and Statistics.
Payments to Depositors and Other Creditors
In the 279 banks that failed or were assisted in 1988, deposits totaled $38.3 billion in over 783,278 deposit accounts.11-18 Of the total, the79 assistance agreements involved $11.8 billion in total deposits. Payoffs accounted for six transactions with 9,200 deposit accounts with total deposits of $135.9 million. Dividends paid on all active receiverships totaled $1.2 billion in 1988.
Of the 1,437 insured bank resolutions11-19 since the FDIC began operations in 1934, 782 were P&A transactions, with 88 additional resolutions involving whole bank transactions. Deposit payoff transactions accounted for 500 cases, of which there were 110 IDTs. Additionally, there have been 67 OBA transactions since 1981.
Total disbursements by the FDIC since January 1, 1934, amounted to $39.9 billion. Of that amount, the FDIC recovered $24.9 billion, for a net loss of $15 billion.
Asset Disposition
At the beginning of 1988, the FDIC had $11.3 billion in failed bank assets. The FDIC handled 200 bank failures during the year and acquired failed bank assets of $2.4 billion for liquidation. Principal collections totaled $2.1 billion, and at the end of 1988, total assets in liquidation totaled $9.3 billion.
The FDIC continued its bulk sale activities in 1988 with 546 transactions involving the sale of 71,865 assets with a book value of $875 million. Asset marketing activities included major sales of nearly all assets at four of the FDIC offices that were scheduled to be closed. The FDIC began planning for a public auction of some of its largest holdings of real estate.
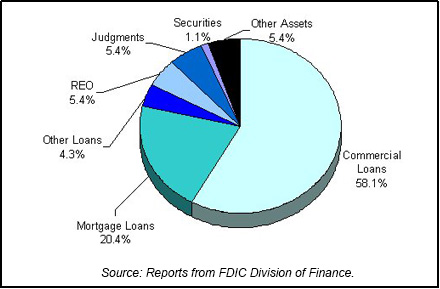
Table 11-4 shows the FDIC's assets in liquidation and Chart 11-1 shows the asset mix.
Table 11-4
| 1988 FDIC End of the Year Assets in Liquidation ($ in Billions*) | ||||||
|---|---|---|---|---|---|---|
| Asset Type | 12/31/87 Book Value | 1988 Assets Acquired | 1988 Prin. Coll. | 1988 Write Downs | 12/31/88 Book Value | 12/31/88 Est. Rec. Value |
| Commercial Loans | $6.89 | $0.9 | $1.0 | $1.3 | $5.4 | $1.9 |
| Mortgage Loans | 1.9 | 0.5 | 0.3 | 0.2 | 1.9 | 1.0 |
| Other Loans | 0.5 | 0.3 | 0.2 | 0.2 | 0.4 | 0.1 |
| Real Estate Owned | 0.6 | 0.4 | 0.3 | 0.2 | 0.5 | 0.3 |
| Judgments | 0.5 | 0.3 | 0.0 | 0.3 | 0.5 | 0.0 |
| Securities | 0.2 | 0.0 | 0.1 | 0.0 | 0.1 | 0.0 |
| Other Assets | 0.8 | 0.0 | 0.2 | 0.1 | 0.5 | 0.2 |
| Totals | $11.3 | $2.4 | $2.1 | $2.3 | $9.3 | $3.5 |
Source: Reports from FDIC Division of Finance.

Insurance Fund and Staffing
The The FDIC's $4.2 billion net loss in 1988 reduced the insurance fund balance from $18.3 billion at the end of 1987 to $14.1 billion at the end of 1988. As a result, the ratio of the insurance fund balance to insured deposits declined to one of its lowest levels ever—0.80 percent of insured deposits.
In 1988, the FDIC continued to make progress in achieving its two main supervision objectives, more frequent examination of banks and more prospective supervision. That was accomplished by increasing the number of safety and soundness examinations and increasing the number of examiners. The number of examiners increased in 1988 to 1,983 field examiners, 74 more than in 1987. The total number of FDIC employees at the end of 1988 was 8,060, down from 9,098 at the end of 1987. Total Division of Liquidation staff was 3,371 compared to 4,400 at the end of the previous year, and Division of Bank Supervision staff numbered 2,594, up from 2,521 in 1987. Chart 11-2 shows the staffing levels for the past five years.
Thrifts
The Federal Savings and Loan Insurance Corporation's (FSLIC's) resolution activities in 1988 dwarfed all previous years in terms of numbers of thrifts resolved, total assets, and resolution costs. In 1988, there were 26 liquidations and 179 Assisted Mergers, with a total cost of more than $31 billion. By the end of the year, the FSLIC fund balance was a negative $75 billion. One of the major causes of the increase in savings and loan activity was a rush by FSLIC to take advantage of two factors that would expire at the end of the year. Those two factors are described as follows in the Federal Home Loan Bank Board's (FHLBB's) 1987 Annual Report.
- The Internal Revenue Code provided that assistance paid by FSLIC in connection with an assisted acquisition would not be considered taxable income. The benefit of that provision was available to the troubled institution or the acquirer. Additionally, it worked to FSLIC's advantage reducing the amount of assistance otherwise needed.
- Special provisions of the Internal Revenue Code's corporate reorganization rules clarified that a FSLIC supervised merger or acquisition could qualify as a tax-free reorganization. The net operating and built in tax losses of the troubled institution could be fully utilized by the acquiring institution.
At the beginning of 1988, the condition of Texas thrift institutions was precarious. According to Generally Accepted Accounting Principles, 125 Texas thrifts with $47 billion in total assets were insolvent. Those institutions represented 25 percent of all U.S. insolvent thrifts and 34 percent of total assets.
Insolvent Texas thrifts were paying higher interest rates on deposits in order to attract cash to increase their liquidity positions, in response to public concerns regarding the volume of problems in the thrift industry and the solvency of FSLIC. Texas thrifts paid an average of 75 basis points more than the national average during 1987. The higher-than-national-average rates being paid, known as the Texas Premium, were driving up costs for solvent Texas institutions and other thrifts throughout the country.
To deal with the increasing thrift problems in Texas and other parts of the Southwest, FHLBB introduced the Southwest Plan in February of 1988. The Southwest Plan combined consolidation of an overbuilt thrift industry with attracting acquirers who would bring in strong management, new capital, and a business plan aimed at cutting operating costs and ultimately reducing the high interest rates being paid on deposits. Nationwide, FHLBB had disposed of 205 insolvent thrifts and had stabilized 18 others.
Legislation to revoke the charter of the Federal Asset Disposition Association (FADA) was passed by the House Committee on Banking, Finance, and Urban Affairs during the early days of October 1988. However, when the bill was voted on by the full House of Representatives on October 12, 1988, it was not approved. In late 1988, a General Accounting Office report stated that FADA was not needed.
11-1 The remaining subsidiary (located in Delaware) of First RepublicBank Corporation was closed 4 days later on August 2, 1988. Back to text
11-2 Bureau of Economic Analysis, Department of Commerce. Back to text
11-3 CB Commercial Torto/Wheaton Research and Bureau of Labor Statistics, Department of Labor. Back to text
11-4 Bureau of Labor Statistics,
Department of Labor. Back to text
11-5 Housing Market Statistics,
National Association of Home Builders (June 1996), and Federal Home
Loan Mortgage Corporation. Back to text
11-6Housing Market Statistics, National Association of Home Builders (June 1996), and CB Commercial Torto/Wheaton Research. Back to text
11-7 Not including Continental Illinois National Bank and Trust Company, which technically did not fail. Back to text
11-8 Again, not including Continental Illinois National Bank and Trust Company. Back to text
11-9 National Association of Realtors. Back to text
11-10 Bureau of Economic Analysis, Department of Commerce. Back to text
11-11 Federal Reserve System, Board of Governors, Flow of Funds Accounts, Table L. 102. Back to text
11-12 Michael Quint, “Northeast Banks Face Heavy Losses on Problem Loans,” New York Times, Dec. 15, 1989, sec. A, 1. Back to text
11-13 Lynn E. Browne, “Why New England Went the Way of Texas Rather than California,” New England Economic Review, Federal Reserve Bank of Boston (January/February 1992), 24, 33; Bureau of Labor Statistics; Department of Labor and Bureau of Economic Analysis, Department of Commerce. Back to text
11-14 California Statistical Abstract, table H-8, 120. Back to text
11-15 Kenneth Leventhal & Company, “1994 Japanese Investment In U.S. Real Estate” (1995). Back to text
11-16 Bureau of the Census, Building Permits Section, Manpower and Construction Statistics Branch. Back to text
11-17 Bureau of Economic Analysis, Department of Commerce. Back to text
11-18 The number of deposit accounts for the First City and the First RepublicBank transactions were unavailable. Back to text
11-19 This figure does not include five open bank assistance transactions from 1934-1980. Also, in 1988 there were 21 assistance agreements that resolved 79 institutions. The FDIC annual report (source data) calculates failure data per Back to text
Table of Contents