
Managing the Crisis: The FDIC and RTC Experience — Chronological Overview
Chapter Twenty-Five: 2002
In 2002, the FDIC continued to position itself to meet the demands of an evolving banking industry, one that was reshaped by institutional consolidation, globalization, and technology.
Table 25-1
| 2001 - 2002: FDIC at a Glance ($ in Millions) | |||
|---|---|---|---|
| 12/31/01 | 12/31/02 | Percent Change | |
| Number of Bank Failures |
4 | 11 | 175.00% |
| Total Assets of Failed and Assisted Banks | $1,821.8 | $2,914.5 | 59.98% |
| Estimated Losses on Failed and Assisted Banks |
$433.5 | $629.8 | 45.28% |
| Estimated Losses as a Percent of Total Assets | 23.80% | 21.61% | -9.20% |
| Assets in Liquidation | $573.4 | $1,240.3 | 116.31% |
| FDIC Staffing | 6,167 | 5,430 | -11.95% |
| Number of Problem Financial Institutions | 114 | 136 | 19.30% |
| Bank Insurance Fund Balance | $30,438.8 | $32,050.3 | 5.29% |
| Bank Insurance Fund Balance as a Percent of Insured Deposits | 1.26% | 1.27% | 0.79% |
| Savings Insurance Fund Balance | $10,935.0 | $11,746.7 | 7.42% |
| Savings Insurance Fund Balance as a Percent of Insured Deposits | 1.36% | 1.38% | 1.47% |
Source: FDIC, 2002 Annual Report and Reports from FDIC Division of Finance and Division of Research and Statistics.
Notable Events
- On January 29, the FDIC Board of Directors adopted an agreement with the Office of Thrift Supervision, the Office of the Comptroller of the Currency, and the Board of Governors of the Federal Reserve System to streamline the FDIC's ability to examine insured institutions that represent a heightened risk to the deposit insurance fund by:
- Enabling the FDIC to conduct special examinations of any insured deposit institution that has a “3”, “4” or “5” CAMELS composite rating.
- Establishing a dedicated FDIC examiner to the eight largest banking institutions, which control approximately 41 percent of industry assets.
- On May 22, the United States House of Representatives passed the Federal Deposit Insurance Reform Act of 2002, by a vote of 408 to 18.
Economic/Banking Conditions
The U.S. economy moved modestly forward with the further reductions of interest rates and belt tightening by corporations in all sectors. GDP improved by 30 basis points to 3.5 percent and inflation was up, but still only at 2.4 percent. The discount rate dropped to 0.75 percent. At the end of the year, the prime rate stood at 4.25 percent, and the 30-year mortgage rate average was down over 100 basis points to 6.05 percent. Encouraged in part by interest rates, housing starts increased by 6.4 percent to 1,705,000, and existing sales were up 7.2 percent. Corporate efficiency efforts cut deeper, however, into employment and office vacancy rates. Total employment remained almost flat with an increase of only 0.3 percent and unemployment increased by 0.3 percent to 6.4 percent. Office vacancies were up over 200 basis points to 16.5 percent.25-1
Although the economy was still sluggish, the profitability in commercial banks remained high, partially attributable to extraordinarily low interest rates. Falling mortgage rates surged mortgage refinancing. Returns on equity and assets both rose, with the latter reaching its highest level in the last 30 years.
Commercial banks' total assets grew by 7.2 percent and holdings of securities increased by 16 percent. Equity capital increased by 7.9 percent. Interest expense fell 37 percent and interest income fell 13 percent. Thus, the net interest margin increased 9 basis points to 4.04 percent. Non-interest income grew 5.3 percent while non-interest expense fell due to lower merger-related costs.
Commercial and Industrial loans fell 7.3 percent, the largest decline since 1991. This decrease was a result of tightening of lending practices and a low demand. There was an increase in delinquency and charge-off rates in corporate loans (several large firms claimed bankruptcy—for example, WorldCom). Commercial real estate loans grew 8.8 percent; this is down from 2001 due to less expansion in construction and land development lending. Residential mortgage loans increased 20 percent, and home equity loans increased almost 40 percent. Core deposits expanded 7.6 percent.25-2
Overall, 9,372 financial institutions were in operation at the end of 2002. The number of banks on the problem bank list continued to increase for the third year in a row and grew from 114 to 136.25-3
Table 25-2 shows the number and total assets of FDIC insured institutions, as well as their profitability as of the end of 2002.
Table 25-2
Open Financial Institutions Insured by FDIC ($ in Billions)
| BIF Members | |||
|---|---|---|---|
| 2001 | 2002 | Percent Change | |
| Number | 8,327 | 8,125 | -2.43% |
| Total Assets | $6,857.5 | $7,336.2 | 6.98% |
| Return on Assets | 1.14% | 1.32% | 15.79% |
| Return on Equity | 12.91% | 14.34% | 11.08% |
| SAIF Members | |||
|---|---|---|---|
| Item | 2001 | 2002 | Percent Change |
| Number | 1,287 | 1,229 | -4.51% |
| Total Assets | $1,011.7 | $1,100.0 | 8.73% |
| Return on Assets | 1.11% | 1.17% | 5.41% |
| Return on Equity | 13.46% | 12.79% | -4.98% |
| US Branches of Foreign Banks | 18 | 18 | 0.00% |
Source: FDIC Quarterly Banking Profile, Fourth Quarter 2003.
Bank Failures
During 2002, the FDIC resolved 11 financial institution failures. These failed institutions had a total of $2.9 billion in assets and $2.5 billion in deposits. Ten of the institutions were insured by the BIF and the remaining one was insured by the SAIF. Four of the failures resulted in insured deposit payoffs, and one other was a partial payoff transaction.
Two resolutions in 2002 warrant special note: Hamilton Bank, N.A., Miami, Florida, and NextBank, Phoenix, Arizona. Hamilton Bank had total assets of $1.4 billion and total deposits of $1.3 billion, and was closed by the Office of the Comptroller of the Currency on January 11. The bank operated eight bank branches in Florida and a single bank branch in Puerto Rico. Hamilton Bank also had a small representative office in Panama and another in Peru. What made this failure so unique was that it was the first time the FDIC was Receiver for such a large volume of international loans. Hamilton's principal focus was commercial trade finance and lending to small companies operating in the United States and throughout Central America.
In resolving this failure, the FDIC took a rarely used approach to protect depositors by transferring all the insured deposits (savings and checking accounts, certificates of deposit, and Individual Retirement Accounts) from three of Hamilton's nine branches, and only the insured transactional accounts (savings and checking) from the remaining six branches to an assuming bank. The Israel Discount Bank, New York, NY assumed $531.6 million of the insured deposits. The FDIC paid out more than $582.6 million of the remaining insured deposits through checks mailed directly to the remaining account holders.
By the end of June, more than $1 billion of Hamilton's assets had either been collected, sold, or booked as a market-determined loss. At that time, Hamilton's Miami-based receivership office was closed, and responsibility for the remaining assets (approximate book value of $100 million) was transferred to the FDIC's office in Dallas, Texas. Those remaining assets principally involve bankruptcies, litigation or investigations. As of December 31, 2003, the cost of the Hamilton Bank failure to the Bank Insurance Fund was estimated to be $171.5 million.
The second noteworthy resolution involved an Internet-only bank, NextBank, N.A., which was chartered in Phoenix, Arizona. NextBank was closed by the Office of the Comptroller of the Currency on February 7. NextBank was formed when its holding company parent, NextCard, Inc. (NCI) purchased Avco National Bank in 1999. NextBank operated as a limited purpose national credit card bank under the provisions of the Competitive Equality Banking Act of 1987 (CEBA). As a limited purpose credit card bank, NextBank operated under the following restrictions: 1) it could only engage in credit card operations; 2) it could not accept demand deposits or deposits that the depositor may withdraw by check or similar means; 3) it could not accept savings or time deposits of less that $100,000 (except as security for loans); 4) it could maintain only one office that accepts deposits; and 5) it could not engage in the business of making commercial loans. NextBank held assets of $700.2 million, and deposits of $551.3 million.
NextBank's principal business was the origination and sale of credit card receivables to a special-purpose trust (Master Trust), which paid for the receivables by selling securities to the public. These securities were backed by the cash flows generated from the receivables. The bank had no brick-and-mortar banking facilities, and its main business was issuing credit cards. The FDIC received no bids for the deposits and paid out the insured deposits by mailing checks directly to depositors. As of December 31, 2003, the cost of the NextBank failure to the Bank Insurance Fund was estimated to be between $300 million and $350 million.
In addition to these two resolution activities, the FDIC filed a lawsuit in the district court for the Northern District of Illinois on November 1 against Ernst & Young, the outside auditors for Superior Bank, Hinsdale, Illinois. Superior Bank, a $2 billion institution, failed on July 27, 2001. The complaint charges Ernst & Young with fraud and negligence in its audits of Superior and seeks actual damages of $548 million and punitive damages in an amount three times the actual damages, as well as interest and costs. The FDIC's complaint asserts that Ernst & Young failed to properly audit Superior's residual assets and then concealed its erroneous auditing for fear that its acknowledgement would damage Ernst & Young's $11 billion sale of its consulting arm to Cap Gemini, a French company. No trial date had been set as of year-end 2003.
A more recent estimate of losses per transaction type is shown in Table 25-3.
Table 25-3
| 2002 Estimated Losses by FDIC Transaction Type ($ in Millions) | ||||
|---|---|---|---|---|
| Transaction Type | Number of Transactions | Total Assets | Estimated Loss* as of 12/31/03 | Estimated Losses as a Percent of Assets |
| P&As | 6 | $586.9 | $141.3 | 24.08% |
| Payoffs | 5 | 2,327.6 | 488.5 | 20.99% |
| Totals | 11 | $2,914.5 | $629.8 | 21.61% |
Source: Reports from FDIC Division of Research and Statistics.
Payments to Depositors and Other Creditors
In the 11 financial institutions that failed in 2002, deposits totaled over $2 billion in 78,170 deposit accounts. Four of the failures resulted in insured deposit payoffs, and one other (Hamilton Bank) was a partial payoff transaction. Dividends paid on all active receiverships totaled over $2.1 billion in 2002.
There have been a total of 2,226 insured financial institution resolutions since the FDIC began operations in 1934. Of this total, 1,477 were P&A transactions, 141 were open bank assistance transactions, and 608 were deposit payoff transactions.
Total disbursements by the FDIC since January 1, 1934, have amounted to $111.6 billion. Of that amount, actual and projected recoveries are anticipated to be approximately $72.5 billion, which equates to a projected loss of $39.1 billion to the BIF/SAIF funds.
Asset Disposition
At the beginning of 2002, the FDIC held $573.4 million in assets from failed institutions. That included $131.7 million in BIF assets, $233.6 million in RTC assets, $14.2 million in FSLIC Resolution Funds (FRF) assets, and $193.9 million in assets from SAIF-insured institutions. During the year, the FDIC acquired an additional $2.5 billion in assets from 11 financial institution failures. The failure of Hamilton Bank, N.A. alone was responsible for almost one half of the assets acquired during the year. The FDIC collected $1.7 billion during the year, and the ending balance for assets in liquidation was $1.2 billion. Of the $1.2 billion, $657 million was assets in liquidation for BIF, $397 million for SAIF, $13 million for FRF, and $173 million for RTC.
Asset marketing continued to play a key role in asset liquidations for the FDIC and their efforts contributed almost $421 million (7,299 loans sold) to the recoveries. The FDIC also had over $77 million in non-asset related collections during this year. While these collections came from a number of different sources, $32.6 million was the result of recoveries from fidelity bond insurance claims, director and professional liability settlements, and criminal restitutions, and another $12 million represented recoveries of state and federal tax benefits due to failed institutions.
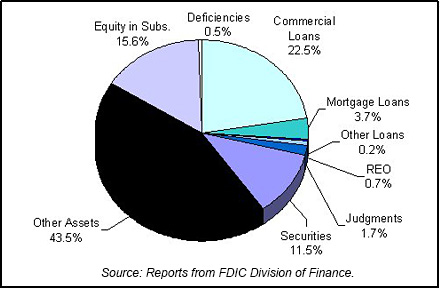
Table 25-4 shows the FDIC's assets in liquidation and Chart 25-1 shows the asset mix.
Table 25-4
| 2002 FDIC End of the Year Assets in Liquidation ($ in Millions*) | |||||||
|---|---|---|---|---|---|---|---|
| Asset Type | 12/31/01 Book Value |
2002 Assets Acquired |
2002 Prin. Coll. |
2002 Write Downs |
2002 Write Downs |
2002 Write Downs |
|
| Commercial Loans | $24.8 | $1,275.5 | $19.1 | $1,041.0 | $278.5 | $775.3 | |
| Mortgage Loans | 13.6 | 143.5 | 2.3 | 113.6 | 45.8 | 92.4 | |
| Other Loans | 1.0 | 328.9 | 23.8 | 350.5 | 3.1 | 251.3 | |
| Real Estate Owned | 12.4 | 3.3 | 1.7 | 8.1 | 9.3 | 7.7 | |
| Judgments | 43.0 | 0.0 | -21.8 | 0.3 | 21.0 | 17.7 | |
| Securities | 122.6 | 247.8 | 25.5 | 253.4 | 142.5 | 253.5 | |
| Other Assets | 149.1 | 534.3 | 283.1 | 427.0 | 539.5 | 0.0 | |
| Equity in Subs. | 200.2 | 0.2 | 104.7 | 111.2 | 193.9 | 0.2 | |
| Deficiencies | 6.7 | 0.0 | 0.0 | 0.0 | 6.7 | 313.0 | |
| Totals | $573.4 | $2,533.5 | $438.3 | $2,305.0 | $1,240.3 | $1,711.1 | |
Source: Reports from FDIC Division of Finance.
Insurance Fund and Staffing
The Corporation's investment strategy reflected prudent management of the $32.1 billion BIF and $11.7 billion SAIF. It is noteworthy that the interest earned on investment securities accounted for 94.2 percent of revenues for the BIF and 95.8 percent of revenues for the SAIF, with $2.3 billion in combined interest earned.
The FDIC substantially revamped its internal organizational structure to improve operational efficiency and unify corporate efforts in each of the three major business lines: insurance, supervision, and receivership management. As part of this major restructuring, the FDIC also streamlined the Corporation's management and support structures.
The major organizational changes made in 2002 include:
- The Division of Insurance and the Division of Research and Statistics were merged into a new Division of Insurance and Research to facilitate a more integrated and effective research and policy leadership capability.
- The Division of Supervision and the Division of Compliance and Consumer Affairs were merged into a new Division of Supervision and Consumer Protection. The regional and field structure of the new division was also streamlined, with a reduction in the number of regional offices from eight to six. Additionally, 89 field offices were consolidated into 52 territories for safety and soundness functions, and 73 field offices were consolidated into 30 territories for compliance functions.
- The receivership accounting operations of the Division of Finance were transferred to the Division of Resolutions and Receiverships to better align business processes in the Corporation's receivership management program.
- Personnel and training functions were merged to create a new Human Resources Branch within the Division of Administration. program.
Downsizing
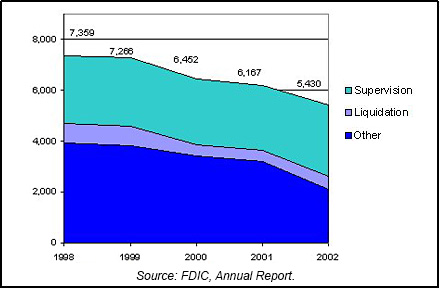
The Corporation continued the downsizing that it has been addressing for much of the past decade. Employment dropped from 6,167 at the beginning of 2002 to 5,430 at year-end 2002 as a result of declining workloads and organizational streamlining. Much of the needed reduction in staffing was accomplished voluntarily through targeted buyout programs that resulted in the retirement or resignation of approximately 700 employees and the reassignment of surplus employees to vacant positions elsewhere within the Corporation. In addition, approximately 30 surplus attorney positions were eliminated through a reduction-in-force in May. Chart 25-2 shows the staffing levels for the past five years.
The savings resulting from corporate restructuring, downsizing and other initiatives directed toward cost containment and improved operating efficiency will, when fully realized, reduce future corporate operating costs by an estimated $80 million annually. The initial impact can be seen in the 2003 budget adopted by the Board of Directors in December 2002. Estimated 2003 spending will decline by 7 percent from 2002 spending.
25-1 Bureau of Labor and Statistics, Department of Labor; Bureau of Economic Analysis, Department of Commerce; Housing Market Statistics, National Association of Home Builders; and Federal Home Loan Mortgage Corporation. Back to Text
25-2
Federal Reserve Bulletin Volume 89, Number 6, June 2003. Back
to Text
25-3
FDIC Quarterly Banking Profile, Fourth Quarter 2002. Back
to Text
Table of Contents