
Managing the Crisis: The FDIC and RTC Experience — Chronological Overview
Chapter Nine: 1986
Post-Depression records were again set in 1986 as the number of FDIC insured bank failures totaled 138. Records were also set for the number of assets in liquidation and the size of FDIC staffing.
Table 9-1
| 1985 - 1986: FDIC at a Glance ($ in Millions) | |||
|---|---|---|---|
| 12/31/85 | 12/31/86 | Percent Change | |
| Number of Bank Failures | 116 | 138 | 17.97% |
| Assistance to Open Banks | 4 | 7 | 75.00% |
| Total Failed and Assisted Banks | 120 | 145 | 20.83% |
| Total Assets of Failed and Assisted Banks | $8,977.3 |
$8,069.1 | -10.12% |
| Losses on Failed and Assisted Banks | $1,007.2 | $1,775.7 | 76.30% |
| Losses as a Percent of Total Assets | 11.22% | 22.01% | 96.17% |
| Assets in Liquidation | $9,731.3 | $10,856.0 | 11.56% |
| FDIC Staffing | 7,125 | 8,817 | 23.75% |
| Number of Problem Banks | 1,140 | 1,484 | 30.18% |
| Deposit Insurance Fund Balance | $17,956.9 | $18,253.3 | 1.65% |
| Deposit Insurance Fund Balance as a Percent of Insured Deposits | 1.19% | 1.12% | -5.88% |
Source: FDIC, 1986 Annual Report and Reports from FDIC Division of Finance and Division of Research and Statistics.
Notable Events
For the first time in 25 years, overall bank profitability declined, as net income dropped 1.4 percent from 1985's level. About 20 percent of all FDIC insured banks lost money in 1986 compared to less than 17 percent in 1985.
Economic/Banking Conditions
In 1986, the Gross Domestic Product growth rate continued at 3 percent. 9-1 Employment growth slowed to 2.3 percent, and the unemployment rate fell to 7 percent.9-2 Interest rates and inflation continued to drop over the year. The discount rate was down to 6.3 percent, and the 30-year mortgage rate fell to 10.2 percent.9-3 Inflation was at 2.5 percent. 9-4 The real estate sector continued to expand, with home sales up 10.5 percent and housing starts also up 3.7 percent. The office vacancy rate continued to climb to 17.9 percent.9-5
The situation in the Southwest continued to worsen as the overbuilt real estate market was beginning to collapse, adding to the already weakened agriculture and oil industries in the region. In August, oil prices bottomed out at $10 a barrel, which was down from $25 in 1985. Energy conservation, along with an increase in production around the world and a flood of OPEC oil, led to the drop in the price of oil.9-6
U.S. agricultural exports dropped to $26 billion, from their peak of $44 billion in 1981, and farm prices continued to drop.9-7 Nonperforming loans at agricultural banks peaked at 6.7 percent of assets, almost double the level at other comparable small banks. The proportion of agricultural banks with negative net incomes also reached a peak. Sixty agricultural banks failed during the year. A large portion of those banks were in the Midwest region which had a total of 51 failures.
The Southwest banking industry had negative asset growth, and net charge-offs peaked at more than 0.7 percent of assets. In the real estate market, residential home prices started to decline and fell below the national median.9-8 Commercial real estate loans peaked at almost 9 percent of assets, while the national median for the same year was under 6 percent. Commercial and Industrial loans continued to decline and were at 13.3 percent of assets, down from 15 percent a year before, and total real estate loans kept pace with the rest of the nation at 20.2 percent of assets. Construction started to decline; 40 percent of the decline in employment was in construction.9-9 In the first nine months of the year, the unemployment rate in Houston, Texas, jumped from 7.4 percent to 10.5 percent.9-10
The situation in the Northeast was different. Total real estate loans continued to rise and were at 39 percent of assets, compared to 20.2 percent nationally. Residential permits were up 172 percent from 1982.9-11 Banks in the region experienced 12 percent asset growth over the year, compared to 8.2 percent for the nation. In 1986, mutual savings banks converted to stock owned savings banks in record numbers.
With the first cuts in defense spending, California’s defense-related employment peaked.9-12 Multi-family and commercial housing starts began to decline, and the number of commercial permits peaked.9-13 Office vacancy rates also peaked, but building continued.9-14 The California commercial real estate loan ratio continued to increase to approximately 15 percent of assets and was well above the national median of 5.7 percent.
The Tax Reform Act was passed in 1986 and removed the generous tax treatment on commercial real estate, which may have contributed to overbuilding in commercial real estate markets around the country.
In March of 1986, the FDIC, the Office of the Comptroller of the Currency, and the Federal Reserve Board released a Joint Policy Statement outlining a Capital Forbearance Program for agricultural banks. Later, energy banks also were included under that program. The intent of that program was to employ supervisory policies that would support sound, well-managed banks in weathering the economic difficulties associated with the agricultural and energy sector downturns.
Under the Capital Forbearance Program, the banking agencies would not issue a capital directive to enforce normal capital standards, nor would the FDIC take formal administrative action under Section 8(b) of the Federal Deposit Insurance Act to enforce capital standards or obtain other corrective actions relating to capital adequacy. In other words, a well-managed bank suffering because of the energy and agricultural crises would be permitted to operate with capital levels below regulatory standards if the bank had adequate plans to restore capital. The banking agencies also encouraged the use of Financial Accounting Standards Board Rule 15, which allowed restructured debt to be carried on the bank's books without loss recognition, provided it was probable that the borrower could repay the loan under the new terms and that the future cash payments were at least equal to the amount on the bank's books.
The FDIC concluded that insider abuse and fraud had occurred in about 32 percent of the bank failures in 1986. In response, the FDIC stepped up its efforts to uncover fraud and insider abuse by making review of those areas a primary objective of bank examinations. The FDIC began a system of “red flags” to be used by examiners, covering internal and management controls, the loan portfolio, reserve for loan losses, and other areas. Money laundering became a federal crime with the enactment of the Anti-Drug Abuse Act of 1986, and the Bank Secrecy Act was amended to prohibit structuring transactions to avoid currency reporting requirements. Regulations promulgated following the passage of the Bank Secrecy Act required banks to maintain procedures to assure compliance with Treasury Department currency reporting regulations.
In response to the substantial numbers of bank failures in the agricultural sector, the FDIC entered into an agreement with Farmers Home Administration (FmHA) to initiate two new programs for farmers affected by bank closings. Under the first program, FmHA provided teams of personnel to evaluate loans in failed banks shortly after the closing and to provide letters of intent to guarantee loans for the 1986 crops. That program enabled some farmers to obtain financing more readily for their new crops than otherwise would have been possible.
The second program was introduced as a pilot program in Nebraska. Under that program, FmHA reviewed each agricultural loan and indicated the dollar amount of the guarantee it would provide. The loan was then offered for sale. The highest qualified bidder purchased the loan and then took over the creditor relationship with the farmer. This program also was used with some success in Missouri and Kansas.
At the end of 1986, the FDIC's list of problem banks included 1,484 of the nation's commercial and savings banks. That was a 30.2 percent increase over the 1,140 on the list at the end of 1985.
Table 9-2 shows the number and total assets of FDIC insured institutions, as well as their profitability as of the end of 1986.
Table 9-2
Open Financial Institutions Insured by FDIC ($ in Billions)
| Commercial Banks - FDIC Regulated | |||
|---|---|---|---|
| Item | 1985 | 1986 | Percent Change |
| Number | 14,407 | 14,199 | -1.44% |
| Total Assets | $2,730.7 | $2,940.7 | 7.69% |
| Return on Assets | 0.69% | 0.63% | -8.70% |
| Return on Equity | 11.07% | 9.94% | -10.21% |
| Savings Banks – FDIC Regulated | |||
|---|---|---|---|
| Item | 1985 | 1986 | Percent Change |
| Number | 364 | 445 | 22.25% |
| Total Assets | $157.4 | $184.6 | 17.28% |
| Return on Assets | 0.74% | 1.04% | 40.54% |
| Return on Equity | 13.08% | 14.88% | 13.76% |
| Savings Associations – FHLBB Regulated | |||
|---|---|---|---|
| Item | 1985 | 1986 | Percent Change |
| Number | 3,262 | 3,232 | -0.92% |
| Total Assets | $1,105.3 | $1,202.3 | 8.78% |
| Return on Assets | 0.42% | 0.09% | -78.57% |
| Return on Equity | 14.14% | 2.70% | -80.91% |
Source: Reports from FDIC Division of Research and Statistics.
Bank Failures and Assistance to Open Banks
In 1986, Texas had the largest number of failures with 26; followed by Oklahoma, 16; Kansas, 14; and Iowa, 10. Of the nation's 138 commercial bank failures, 60 were agricultural banks.
Purchase and assumption (P&A) transactions were used in 98 of the bank failures, and in 97 of the cases, assuming banks paid premiums for a total of more than $113 million. The remaining P&A transaction involved the First National Bank and Trust Company of Oklahoma City, Oklahoma City, Oklahoma where the FDIC incurred a “negative premium” of $72 million after it determined that the bank's continued operation was essential to the local economy. Three of the P&A transactions involved acquisitions by out-of-state bidders through the FDIC's use of its emergency assistance and extraordinary acquisition powers. The FDIC arranged for insured deposit transfers (IDTs) in 19 cases; a total of over $4 million in premiums was received from the acquiring banks in those transactions. In 21 of the failures, the FDIC paid off deposits.
As of December 31, 1986, the FDIC's Net Worth Certificate Program included 12 savings banks with aggregate certificates outstanding of $526 million, down from 21 institutions with $705.4 million outstanding at the end of 1985. The Net Worth Certificate Program was extended twice by Congress but expired on October 13, 1986. The program was later reinstated through October 13, 1991, by the Competitive Equality Banking Act of 1987. Banks were required to repay outstanding certificates according to the original terms.
In December 1986, the FDIC adopted a revised statement of policy to provide guidelines to bankers considering open bank assistance (OBA) under Section 13(c) of the FDI Act. In 1986, the FDIC provided OBA to commercial banks in seven instances.
A recent estimate of losses per transaction type is shown in Table 9-3.
Table 9-3
| 1986 Estimated Losses by Transaction Type ($ in Millions) | ||||
|---|---|---|---|---|
| Transaction Type | Number of Transactions | Total Assets | Losses | Losses as a Percent of Assets |
| OBA | 7 | $712.5 | $93.2 | 13.08% |
| P&As | 98 | 5,974.1 | 1,266.2 | 21.19% |
| IDTs | 19 | 793.3 | 212.7 | 26.81% |
| Payoffs | 21 | 589.2 | 203.6 | 34.56% |
| Totals | 145 | $8,069.1 | $1,775.7 | 22.01% |
Source: Reports from FDIC Division of Research and Statistics.
In 1986, the FDIC encountered an increasing number of cases in which few bids or no bids were being submitted to acquire failed banks. To reduce its costs, the FDIC requested an extension and expansion of the emergency acquisition authority provided under the Garn-St Germain Depository Institutions Act of 1982. The FDIC requested authority to seek buyers under other than extraordinary circumstances from outside the home state in which the failed bank was chartered. The FDIC further sought authority to operate failed banks for a period of time to bridge the gap between insolvency and an orderly acquisition by a healthy institution. The Competitive Equality Banking Act of 1987 (discussed more fully in the next chapter) expanded the FDIC's authority to seek out-of-state purchasers and provided the FDIC with bridge bank authority.
Payments to Depositors and Other Creditors
In the 145 banks that failed or were assisted in 1986, deposits totaled $7.2 billion in 904,000 deposit accounts. The seven assistance transactions represented $585.2 million in total deposits in 70,400 deposit accounts. Payoffs accounted for 21 transactions with 85,800 accounts totaling $566 million. Dividends paid on all active receiverships totaled $1.2 billion in 1986.
Of the 1,013 insured bank failures9-15 since the FDIC began operations in 1934, there were 573 P&A transactions and 413 deposit payoff transactions, of which 40 were IDTs. The FDIC has also provided assistance to 27 troubled financial institutions to prevent them from failing since 1981.
Total disbursements by the FDIC since January 1, 1934, amounted to $25.7 billion. Of that amount, the FDIC recovered $16.9 billion for a net loss of $8.8 billion.
Asset Disposition
At the beginning of 1986, the FDIC held $9.7 billion in assets from failed banks. During the year, 138 commercial banks failed, and the FDIC acquired $4.3 billion in assets and collected $1.8 billion in principal. The FDIC ended the year with a total of $10.9 billion assets in liquidation.
Asset disposition efforts were becoming increasingly important. By the end of 1986, the FDIC's asset marketing staff had closed 196 sales involving approximately 129,000 loans, with an aggregate book value of $342 million. The sales ranged in size from very small agricultural loan portfolios of fewer than ten loans, to a package of 90,000 accounts from a failed bank's insurance premium funding department. Loan packages included performing and/or nonperforming loans.
On July 14, 1986, approximately $1.5 billion in assets of the failed First National Bank and Trust Company of Oklahoma City were placed in an asset pool under a P&A transaction. First Interstate Bank of Oklahoma City, the acquiring bank, set up a subsidiary corporation, Consolidated Asset Management Company (CAMCO), to administer and liquidate the assets. The FDIC maintained an oversight function throughout the five-year term of the agreement.
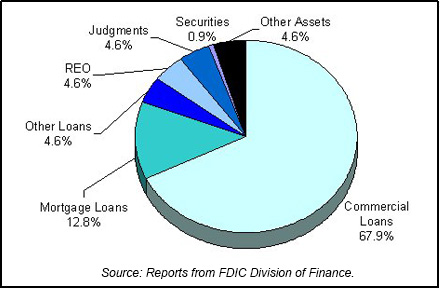
Table 9-4 shows the FDIC's assets in liquidation and Chart 9-1 shows the asset mix.
Table 9-4
| 1986 FDIC End of the Year Assets in Liquidation ($ in Billions*) | ||||||
|---|---|---|---|---|---|---|
| Asset Type | 12/31/85 Book Value | 1986 Assets Acquired | 1986 Prin. Coll. | 1986 Write Downs | 12/31/86 Book Value | 12/31/86 Est. Rec. Value |
| Commercial Loans | $7.0 | $2.2 | $1.0 | $0.8 | $7.4 | $5.2 |
| Mortgage Loans | 1.0 | 0.8 | 0.3 | 0.1 | 1.4 | 1.0 |
| Other Loans | 0.4 | 0.3 | 0.1 | 0.1 | 0.5 | |
| Real Estate Owned | 0.3 | 0.4 | 0.1 | 0.1 | 0.5 | 0.5 |
| Judgments | 0.5 | 0.2 | 0.0 | 0.2 | 0.5 | |
| Securities | 0.1 | 0.2 | 0.2 | 0.0 | 0.1 | 0.1 |
| Other Assets | 0.4 | 0.2 | 0.1 | 0.0 | 0.5 | 0.2 |
| Totals | $9.7 | $4.3 | $1.8 | $1.3 | $10.9 | $7.0 |
Source: Reports from FDIC Division of Finance.
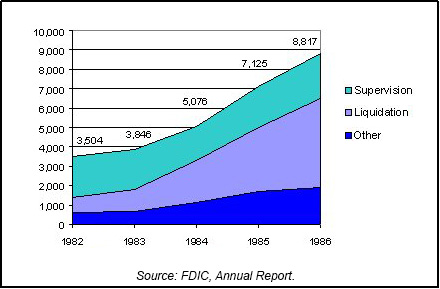
Insurance Fund and Staffing
The deposit insurance fund grew to $18.3 billion, up 1.7 percent over 1985. However, the fund declined as a percentage of insured deposits to 1.12 percent of such deposits, because the total of expenses and losses was $3 billion, or more than $1 billion in excess of 1985 expenses and losses. The total payroll increased to 8,817 employees, up from 7,125 at the end of 1985. Division of Liquidation staff was 4,586, an increase of 1,268 over 1984. Division of Bank Supervision staff increased to 2,299, up from 2,123 in 1985. Chart 9-2 shows the staffing levels for the past five years.
Private Resolutions
The Colorado state legislature had created a private, nonprofit corporation providing deposit insurance for state chartered industrial banks. That corporation was known as the Industrial Bank Savings Guaranty Corporation (IBSGC). Each industrial bank in the state was required to be either a member of the IBSGC or insured by the FDIC. The IBSGC was funded by an initial membership fee and by annual assessments; no state funds were provided nor was protection backed by the state of Colorado. As of June 30, 1983, the IBSGC guaranteed deposits totaling some $436 million in 144 industrial banks with a reserve fund of $6.2 million.
Industrial Banks were very similar to commercial banks except that industrial banks could not carry demand deposit accounts. Most industrial banks were connected to an industry or parent that needed some kind of financing vehicle. In that regard, industrial banks operated more like finance companies, with savings and time deposits and some funding from the parent in the form of borrowings. Another difference was that an industrial bank could be owned by a corporation, not necessarily a bank holding company. However, to acquire FDIC insurance, the industrial bank was limited in powers to those normally associated with depository institutions.
Beginning in 1986, weakening economic conditions combined with poor lending practices and inexperienced management resulted in the failure of three IBSGC insured institutions, which seriously depleted the IBSGC fund. As a result, the Colorado legislature required that all industrial banks apply for FDIC insurance by September 1, 1987; institutions that were not FDIC insured by July 1, 1989, were to cease accepting public deposits. Membership in the IBSGC went from 111 members at the end of 1984 to only 13 in September 1987. Those that left the fund had taken one of the following actions: (1) obtained federal deposit insurance, (2) voluntarily ceased accepting deposits and started liquidating themselves, or (3) made other arrangements for deposit protection that were satisfactory to the state banking commissioner. Of the 13 remaining banks with deposits totaling $42 million, 9 were placed in the possession of the state and 4 had sought protection under Chapter 11 of the U.S. Bankruptcy Code.9-16 Pursuant to legislation, the Financial Management Task Force (FMTF) was appointed the receiver of the state controlled institutions. Subsequently, the bankruptcy proceedings of all of the institutions were dismissed and FMTF served as receiver of all of the failed institutions.
In December 1988, FMTF made its first distribution to depositors of 12 of the institutions. Amounts represented from 7 percent to 23 percent of claims, depending on the institution. It was six more years before FMTF made its final distribution to depositors in June of 1995. Although asset liquidation and IBSGC funds disbursed to depositors totaled only 58 percent of total deposits, ultimately, 100 percent of depositors' funds, including uninsured amounts, were paid by the state of Colorado.
State insurance funds proved to be susceptible to changes in a state's economy and generally were not sufficiently capitalized to cover losses from the failures of several institutions at the same time.
Thrifts
A report from the General Accounting Office (GAO) in September 1987 reviewed the performance of 45 thrift institutions in the Federal Savings and Loan Insurance Corporation's (FSLIC's) Management Consignment Program (MCP) through the end of 1986. At the beginning of the period, 38 institutions were already insolvent. Of the 45 thrifts in the sample, 26 were in California or Texas. During the period, the 45 thrifts had losses of $2 billion: $1.3 billion in operating losses and $0.7 billion in nonoperating losses. Without considering asset write-downs, those institutions experienced significant losses, and both types of losses (operating and nonoperating) increased over time. The decline would have been worse had the GAO report considered that additional forbearance and Income Capital Certificates (ICC) were used by the institutions in the sample. Borrowings from Federal Home Loan Banks increased for the group from $2.9 billion to $3.7 billion.
Income Capital Certificates (ICCs) were first used in September 1981 by the FSLIC as a form of noncash assistance to mutual institutions. A troubled thrift would issue an ICC to FSLIC in exchange for a FSLIC note. The FSLIC note was an asset on the thrift's books with the offsetting liability (the ICC) counting as regulatory capital. If the thrift had earnings and had achieved a certain level of net worth, it paid a portion of its net income to FSLIC in the form of interest (dividends) based on a variable rate. The FSLIC generally paid interest on the note to the institution in cash. The ICC program was in effect from 1981 through 1986. The first ICC was issued as part of the assistance portion in a Supervisory Merger.
Income Capital Certificates (ICC) were used by the institutions in the sample. Borrowings from Federal Home Loan Banks increased for the group from $2.9 billion to $3.7 billion.
From 1981 through 1986, approximately 50 thrifts issued ICCs for a total assistance amount of $2.3 billion. The total outstanding as of March 31, 1986, was $2.5 billion at 38 institutions. Although participation in the program was not widespread, the amount of assistance was significant in terms of claims on the FSLIC insurance fund. For example, ICCs at the end of 1985 (net of those issued for cash) represented 58 percent of FSLIC's $3.78 billion primary reserves.
During 1986, FSLIC handled 10 liquidations and 36 Assisted Mergers, for a total cost to the FSLIC Insurance Fund of slightly more than $3 billion. In addition, there had been five Supervisory Mergers and 29 MCP cases. It is important to note that at the end of the year, the FSLIC fund balance was a negative $6.3 billion. The Federal Home Loan Bank Board estimated a total $10.5 billion as the present value cost to resolve problem thrifts on FSLIC's case list at that time.
The passage of the Tax Reform Act of 1986 provided special rules that would help the resolution of insolvent thrifts. Some of the key provisions were:
- Allowing a 3-year carryback of net operating losses of troubled thrifts to their acquirers and a 15-year carryforward to offset operating income, providing an effective tax shelter,
- Exempting FSLIC assistance from federal taxation through 1988, and
- Allowing the deduction of losses on sales of nonperforming assets.
In March 1986, the Federal Asset Disposition Association (FADA) received $25 million from FSLIC to be used to cover capital expenditures and start-up costs. In July 1986, FADA received its first assignment, the management of 64 assets with a book value of $131 million. Within a year of that start, FADA had established operations in six major cities, with a staff of approximately 250 personnel.
9-1 Bureau of Economic Analysis, Department of Commerce. Back to text
9-2 CB Commercial Torto/Wheaton Research and Bureau of Labor Statistics, Department of Labor. Back to text
9-3 Housing Market Statistics, National Association of Home Builders (June 1996), and Federal Home Loan Mortgage Corporation. Back to text
9-4 Bureau of Labor Statistics, Department of Labor. Back to text
9-5 Housing Market Statistics, National Association of Home Builders (June 1996), and CB Commercial Torto/Wheaton Research. Back to text
9-6 Jack L. Hervey, “The 1973 Oil Crisis: One Generation and Counting,” Chicago Fed Letter, no. 86 (October 1994), 1-3. Back to text
9-7 Economic Report of the President, 1996. Back to text
9-8 National Association of Realtors. Back to text
9-9 D’Ann M. Petersen, Mine K. Yucel, and Keith R. Phillips, “The Texas Construction Sector: The Tail that Wagged the Dog,” Federal Reserve Bank of Dallas, Economic Review-Second Quarter 1994, 26. Back to text
9-10 Bureau of Labor Statistics, Department of Labor. Back to text
9-11 Bureau of the Census, Building Permits Section, Manpower and Construction Statistics Branch. Back to text
9-12 California Statistical Abstract Table H-8, 120. Back to text
9-13 Bureau of the Census, Building Permits Section, Manpower and Construction Statistics Branch. Back to text
9-14 CB Commercial Torto/Wheaton Research. Back to text
9-15 This figure does not include five open bank assistance transactions from 1934-1980. The FDIC did not begin including assistance agreements with
the failures for reporting purposes until 1981. Five assistance agreements, with total deposits of $6.8 billion, should be included in the overall totals. Back to text
9-16 William B. English, “The decline of private deposit insurance in the United States” (Carnegie-Rochester Conference Series on Public
Policy, 1993), 73. Back to text
Table of Contents