
Managing the Crisis: The FDIC and RTC Experience — Chronological Overview
Chapter Twenty-Two: 1999
In 1999, the U.S. economy marked its ninth year of a remarkably strong economic expansion, which contributed to record profits for the banking industry. Insured commercial banks posted record earnings for the eighth consecutive year, and insured savings institutions recorded their third consecutive year of record earnings.
Table 22-1
| 1998 - 1999: FDIC at a Glance ($ in Millions) | |||
|---|---|---|---|
| 12/31/98 | 12/31/99 | Percent Change | |
| Number of Bank Failures |
3 | 8 | 166.67% |
| Total Assets of Failed and Assisted Banks | $290.2 | $1,592.2 | 448.66% |
| Estimated Losses on Failed and Assisted Banks |
$227.5 | $831.5 | 265.49% |
| Estimated Losses as a Percent of Total Assets | 78.39% | 52.22% | -33.38% |
| Assets in Liquidation | $2,375.5 | $1,981.5 | -16.59% |
| FDIC Staffing | 7,359 | 7,266 | -1.26% |
| Number of Problem Financial Institutions | 84 | 79 | -5.95% |
| Bank Insurance Fund Balance | $29,612.3 | $29,414.2 | -0.67% |
| Bank Insurance Fund Balance as a Percent of Insured Deposits | 1.38% | 1.36% | -1.45% |
| Savings Insurance Fund Balance | $9,839.8 | $10,280.7 | 4.48% |
| Savings Insurance Fund Balance as a Percent of Insured Deposits | 1.39% | 1.45% | 4.32% |
Source: FDIC, 1999 Annual Report and Reports from FDIC Division of Finance and Division of Research and Statistics.
Notable Events
- During 1999, the FDIC took an aggressive approach to supervising insured financial institutions to assure readiness for the Year 2000 (Y2K) date conversion and engaged in an extensive program of Y2K public education and outreach.
- Throughout the year, FDIC?s Division of Supervision (DOS) examiners, with assistance from state bank regulators, performed comprehensive on-site Y2K readiness assessments of FDIC supervised financial institutions and their service providers, a well as software vendors that the FDIC is responsible for examining. On December 13, FDIC Chairman Donna Tanoue announced that every FDIC-insured financial institution in the nation had achieved a satisfactory assessment.
- During the year, the Y2K issue of FDIC Consumer News was one of the most popular publications offered by the Consumer Information Center, which distributed more than 500,000 copies to the public.
- Throughout the day on January 1, 2000, Chairman Tanoue appeared on NBC and CNN, withdrawing money from an automated teller machine illustrating that it was business as usual for banking. Banks reported no significant Y2K problems. Public confidence in the banking sector was maintained.
- On November 12, the Gramm-Leach-Bliley Act, was signed by President Clinton. The Act (Public Law 106-102) repeals Sections 20 and 32 of the Banking Act of 1933 (Glass-Steagall Act) and amends the Bank Holding Company Act of 1956. The amendment allows affiliations between any insured depository institution and any ?financial? company, including securities and insurance firms, in new types of bank holding companies known as financial holding companies. The Act also allows certain financial activities, permitted by financial holding companies, to be carried out through bank subsidiaries, subject to safe guards and restrictions.
Economic/Banking Conditions
While the U.S. economy as a whole continued to steam forward throughout 1999, the breadth of prosperity was not as great as during 1998. On the bullish side, GDP growth climbed sharply once again, rising by 5.6 percent. Likewise, unemployment fell another 30 basis points to 4.1 percent, a very low level by historical standards. Moreover total employment, rose by 1.5 percent, as 1,857,000 more individuals found work. Also bullish was the inflation rate which added only a modest 2.7 percent to the average cost of goods and services. The final piece of bullish economic news came from a 3 percent increase in new housing starts, to 1,665,000.
By contrast, new home sales were flat to down slightly, losing 70 basis points from the 1998 level. Also bearish were the 60 basis-point rise in office vacancy, a 50 basis-point climb in the discount rate, and a 104 basis-point rise in interest charged on 30-year mortgages.22-1
This was an extremely strong year for banks. Both returns on assets and equity rose above last year’s levels. Profits were concentrated in the top 100 banks because of a large increase in non-interest income and a decrease in non-interest expense.
Growth in commercial bank assets decreased from 8.2 percent to 5.4 percent. Net income grew 16 percent (to $71.5 billion) while capital growth slowed 4 percent. Growth of securities slowed to 5.1 percent.
There were record profits due to an increase in non-interest income, which was largely due to non-deposit fee income. The net interest margin remained constant at 4.1 percent. Most profitability was evident in medium to large size banks. The top ten banks held 35 percent of industry’s assets, and the next 90 also held 35 percent. The next 900 held 18 percent, and the remaining banks held 12 percent.
Total Loans expanded 8 percent. Commercial and Industrial loans expanded 8.1 percent, however this pace was slower than the past two years. Commercial real estate loans increased more than 15 percent; the greatest increase since 1987. The largest loan category increase was in construction and land development loans, which increased 27 percent. There were three main reasons for the strong increase commercial real estate loans: the strong economy, the decrease in REITs (which allowed private developers to develop), and the issuance of domestic securities backed by commercial mortgages was off 24 percent. Consumer loans grew 4.7 percent and home equity loans increased 5.9 percent.
Core deposits were constant for the entire year. As a share of total liabilities, core deposits were down 3 basis points, to about 52 percent. This caused banks to rely on more expensive managed liabilities—this area advanced more than 15 percent. Foreign deposits and large time deposits rose. Dividends (primarily paid to parent companies) increased more than 26 percent. Bank holding companies’ stock prices were down 20 percent.22-2
Overall, 10,242 financial institutions were in operation at the end of 1999 and there were 79 banks on the problem bank list.22-3
Table 22-2 shows the number and total assets of FDIC insured institutions, as well as their profitability as of the end of 1999.
Table 22-2
Open Financial Institutions Insured by FDIC ($ in Billions)
| BIF Members | |||
|---|---|---|---|
| 1998 | 1999 | Percent Change | |
| Number | 9,032 | 8,835 | -2.18% |
| Total Assets | $5,702.9 | $5,980.1 | 4.86% |
| Return on Assets | 1.18% | 1.29% | 9.32% |
| Return on Equity | 13.82% | 15.11% | 9.33% |
| SAIF Members | |||
|---|---|---|---|
| Item | 1998 | 1999 | Percent Change |
| Number | 1,432 | 1,387 | -3.14% |
| Total Assets | $828.2 | $903.5 | 9.09% |
| Return on Assets | 0.98% | 0.99% | 1.02% |
| Return on Equity | 11.29% | 11.97% | 6.02% |
| US Branches of Foreign Banks | 25 | 20 | 20.00% |
Source: FDIC Quarterly Banking Profile, Fourth Quarter 2003.
Bank Failures
Eight institutions insured by the FDIC were closed during 1999. Seven of those institutions were insured by the BIF and one was insured by the SAIF. These failed entities had combined assets of approximately $1.6 billion. All eight resolutions involved purchase and assumption transactions.
The First National Bank of Keystone, Keystone, West Virginia, was closed on September 1, 1999, by the Office of the Comptroller of the Currency. The bank?s failure was the result of fraudulent activities involving $515 million in loans carried on the bank?s books that should have been removed after they were securitized and sold, along with embezzlement and excessive compensation in the form of fees and commissions. The bank reported total assets of just over $1 billion and total liabilities of $976.4 million. On September 3, 1999, the FDIC and AmeriBank, Inc., Welch, West Virginia, reached an agreement whereby AmeriBank would assume the insured local deposits totaling $135 million and purchase $74.2 million in assets for a discount of $105,000. The FDIC paid out the non-local insured deposits not assumed by AmeriBank. The uninsured deposits totaled approximately $27.9 million in about 674 accounts. The estimated total loss to the deposit insurance fund is $751 million.
A more recent estimate of losses per transaction type is shown in Table 22-3.
Table 22-3
| 1999 Estimated Losses by FDIC Transaction Type ($ in Millions*) | ||||
|---|---|---|---|---|
| Transaction Type | Number of Transactions | Total Assets | Estimated Loss* as of 12/31/03 | Estimated Losses as a Percent of Assets |
| P&As | 8 | $1,592.2 | $831.5 | 52.22% |
Source: Reports from FDIC Website ? Historical Statistics on Banking.
Payments to Depositors and Other Creditors
In the eight financial institutions that failed in 1999, deposits totaled $1.3 billion in 59,601 deposit accounts. Dividends paid on all active receiverships totaled almost $959 million in 1999.
There have been a total of 2,204 insured financial institution resolutions since the FDIC began operations in 1934. Of this total, 1,460 were P&A transactions, 141 were open bank assistance transactions, and 603 were deposit payoff transactions.
Total disbursements by the FDIC since January 1, 1934, have amounted to $108.1 billion. Of that amount, actual and projected recoveries are anticipated to be approximately $70.1 billion, which equates to a projected loss of $38 billion to the BIF/SAIF funds.
Asset Disposition
At the beginning of 1999, the FDIC held $2.4 billion in assets from failed institutions. That included $1.3 billion in BIF assets, $349 thousand in SAIF assets, $105 million in FSLIC Resolution Fund (FRF) assets, and $947 million in Resolution Trust Corporation (RTC) assets. During the year, the FDIC acquired an additional $1.5 billion in assets from seven bank failures and one thrift failure. The FDIC collected $980 million during the year, and the ending balance for assets in liquidation was $2 billion, a reduction of $394 million. Of the $2 billion, $1.5 billion was assets in liquidation for BIF, $10 million for SAIF, $42 million for FRF, and $467 million for RTC.
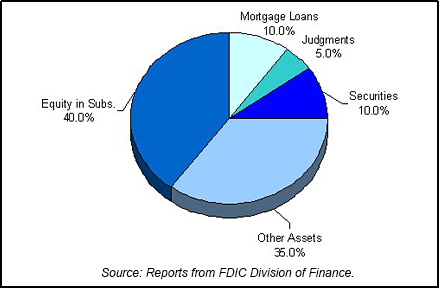
During 1999, the FDIC sold real estate properties for a total of $67 million, yielding a recovery of 83 percent of average appraised value. More than 16,976 loans and other assets totaling $567 million in book value were sold through asset marketing efforts. Table 22-4 shows the FDIC?s assets in liquidation and Chart 22-1 shows the asset mix.
Table 22-4 shows the FDIC's assets in liquidation and Chart 22-1 shows the asset mix.
Table 22-4
| 1999 FDIC End of the Year Assets in Liquidation ($ in Billions*) | |||||||
|---|---|---|---|---|---|---|---|
| Asset Type | 12/31/98 Book Value | 1999 Assets Acquired | 1999 Asset Adj. | 1999 Coll. & Write Downs | 12/31/99 Book Value | 12/31/99 Book Val. Recovery | |
| Commercial Loans | $0.3 | $0.1 | $0.1 | $0.3 | $0.0 | $0.1 | |
| Mortgage Loans | 0.4 | 0.2 | 0.0 | 0.4 | 0.2 | 0.2 | |
| Other Loans | 0.3 | 0.0 | 0.0 | 0.3 | 0.0 | 0.0 | |
| Real Estate Owned | 0.1 | 0.0 | 0.0 | 0.1 | 0.0 | 0.1 | |
| Judgments | 0.2 | 0.0 | 0.0 | 0.1 | 0.1 | 0.1 | |
| Securities | 0.3 | 0.1 | -0.1 | 0.1 | 0.2 | 0.1 | |
| Other Assets | 0.3 | 1.1 | -0.6 | 0.1 | 0.7 | 0.0 | |
| Equity in Subs. | 1.4 | 0.0 | 0.5 | 0.1 | 0.8 | 0.0 | |
| Deficiencies | 0.1 | 0.0 | 0.0 | 0.1 | 0.0 | 0.1 | |
| Totals | $2.4 | $1.5 | ($0.2) | $1.7 | $2.0 | $0.7 | |
Source: Reports from FDIC Division of Finance.
Insurance Fund and Staffing
At year-end 1999, the BIF had a balance of $29.4 billion, representing a loss of $198 million for the year. This was the first year-end loss reported since 1991 and the loss was primarily attributable to insurance losses recognized in 1999. During the year, BIF-insured deposits grew by 0.76 percent, yielding a reserve ratio of 1.36 percent of insured deposits at year-end 1999. The reserve ratio at year-end 1998 was slightly higher, at 1.39 percent.
The SAIF ended 1999 with a fund balance of $10.3 billion, a 4.5 percent increase over the year-end 1998 balance of $9.8 billion. Estimated insured deposits increased by 0.34 percent in 1999. The reserve ratio grew from 1.39 percent of insured deposits at year-end 1998 to 1.45 percent.
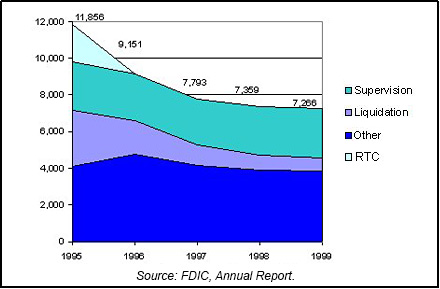
After reducing the size of its workforce by over 4,500 or 38.7 percent over the previous four years, staffing remained relatively constant during 1999, decreasing by only 93 (1.3 percent) down to 7,266. The Corporation continued its practicing of allowing temporary and term appointments to expire, which accounted for almost 50 percent of the staff reductions. Additionally, the Corporation utilized an Early Out Retirement authority, and the Legal Division offered a buyout opportunity in its continued efforts to remedy staffing imbalances. Chart 22-2 shows the staffing levels for the past five years.
22-1 Bureau of Labor and Statistics, Department of Labor; Bureau of Economic Analysis, Department of Commerce; Housing Market Statistics, National Association of Home Builders; and Federal Home Loan Mortgage Corporation. Back to Text
22-2 Federal Reserve Bulletin Volume 86 Number 6 June 2000. Back to Text
22-3 FDIC Quarterly Banking Profile, Fourth Quarter 1999. Back to Text
Table of Contents