
Managing the Crisis: The FDIC and RTC Experience — Chronological Overview
Chapter Twelve: 1989
The savings and loan industry's worst year was 1989, with losses totaling more than $19 billion. The FDIC's insurance fund was under severe pressure as well. In the FDIC's 1989 Annual Report, Chairman L. William Seidman described 1989 as ?the most demanding year in the 56-year history of the FDIC and a likely harbinger of more tough times ahead.?
Table 12-1
| 1988 - 1989: FDIC at a Glance ($ in Millions) | |||
|---|---|---|---|
| 12/31/88 | 12/31/89 | Percent Change | |
| Number of Bank Failures | 200 | 206 | 3.00% |
| Assistance to Open Banks | 79 | 1 | -98.73 |
| Total Failed and Assisted Banks | 279 | 207 | -25.81% |
| Total Assets of Failed and Assisted Banks | $53,889.4 | $28,935.0 | -46.32% |
| Estimated Losses on Failed and Assisted Banks |
$6,920.5 | $6,198.8 | -10.43% |
| Estimated Losses as a Percent of Total Assets | 12.84% | 21.42% | 66.82% |
| Assets in Liquidation | $9,335.9 | $25,930.6 | 177.75% |
| FDIC Staffing | 8,060 | 10,187 | 26.39% |
| Number of Problem Banks | 1,406 | 1,109 | -21.12% |
| Deposit Insurance Fund Balance | $14,061.1 | $13,209.5 | -6.06% |
| Deposit Insurance Fund Balance as a Percent of Insured Deposits | 0.80% | 0.70% | -12.50% |
Source: FDIC, 1989 Annual Report and Reports from FDIC Division of Finance and Division of Research and Statistics.
Notable Events
On February 6, 1989, President George H. W. Bush announced proposed legislation to address the thrift crisis, including a program to place troubled institutions into conservatorship under an interagency effort led by the FDIC. The resulting landmark Financial Institutions Reform, Recovery, and Enforcement Act (FIRREA) of 1989 was passed on August 9, 1989. That legislation abolished the Federal Home Loan Bank Board (FHLBB) as regulator of savings and loan institutions, and dissolved the insurer, the Federal Savings and Loan Insurance Corporation (FSLIC). The Act also created the Resolution Trust Corporation (RTC) to clean up the savings and loan crisis and to take over the management of conservatorships on August 9, 1989. The RTC's mission was to merge or to liquidate savings associations declared insolvent during the period from January 1, 1989, through (initially) August 8, 1992 (later extended through September 30, 1993 and then to June 30, 1995.) In the beginning, the FDIC was to be the manager of the RTC, handling day-to-day operations.
FIRREA also created the following:
- The Savings Association Insurance Fund (SAIF)?established to insure deposits in savings associations and was to be directed and administered by the FDIC separately from the Bank Insurance Fund (formerly the Deposit Insurance Fund). SAIF replaced the former FSLIC insurance fund.
- The FSLIC Resolution Fund (FRF)?established under the FDIC's management to handle most of the assets and liabilities of the former FSLIC.
- The Resolution Funding Corporation?established to fund the activities of the RTC, primarily through bond sales.
- The Office of Thrift Supervision?established to take over the duties of examining and supervising thrifts and their holding companies. That function was formerly performed by the FHLBB, which was abolished by FIRREA.
Upon the signing of FIRREA, the FDIC also assumed liabilities of FRF and the administrative responsibilities for 219 thrift assistance agreements entered into by the former FHLBB. In addition, the FDIC also assumed responsibility for overseeing other contracts and financial operations of the former FSLIC, including management of the 98 thrift receiverships with about $13 billion in assets that were closed before August 9, 1989.
Economic/Banking Conditions
Gross Domestic Product growth continued steadily at 3.4 percent, and the unemployment rate continued to fall.12-1 Employment growth was at 2.2 percent, and the unemployment rate was 5.3 percent.12-2 The discount rate increased to 6.9 percent while the 30-year mortgage rate held constant at 10.3 percent.12-3 Inflation rose for the third year in a row to 4.2 percent.12-4 As the office vacancy rate rose slightly to 17.6 percent, commercial real estate loans continued to steadily increase. Residential real estate activity was slowing, however, with home sales down 4.6 percent and housing starts down 7.5 percent.12-5
The Southwest continued to experience a high percentage of the country's bank resolutions, 167 failures (80.7 percent), with resolution costs totaling $5 billion. A year after having the first and third costliest bank resolutions, Texas had the second and fourth costliest bank resolutions to date with the failures of the bank subsidiaries of MCorp ($2.8 billion estimated loss) and Texas American Bancshares ($1.1 billion estimated loss).12-6 There were large increases in problem real estate loans among the region's banks. Smaller banks were getting healthier as their earnings increased and their numbers of problem assets decreased.
Northeastern banks were beginning to be negatively affected. During the year, nonperforming real estate loans in the region increased from $3.6 billion to $9.1 billion, and mortgage foreclosures also increased.12-7 Total real estate loans peaked at 51 percent of total assets as did commercial real estate loans, at 14 percent of assets. Both were well above the national medians of 23 percent and 7 percent, respectively. Home prices in New York City fell 5 percent during the year.12-8
California's unemployment rate was at 5 percent, its lowest rate in 20 years.12-9 The economy started to slow as the Gross State Product growth rate fell back to the national level.12-10 Median home prices peaked for the state as a whole. Los Angeles and San Francisco in particular were cities where housing was believed to be overvalued.12-11 The banking industry in California had a record income of $3.7 billion, and the number of identified problem banks in the state fell to 36. The “Big Four” continued to outperform the national average with a return on assets of 1.3 percent compared to the national level of 0.7 percent.
Money center banks' total reserves were almost 50 percent of outstanding lesser developed country's loans and had increased $13 billion since the previous year. Return on equity bounced back for all banks to 4.8 percent from 1.6 percent in 1988 and -1.9 percent in 1987, but net charge-offs continued to increase for large banks, to 1.02 percent of total loans.
Commercial bank performance looked bleak in 1989. Some of the unfavorable trends were as follows:
- The industry ended 1989 in worse condition than it started;
- Provisions for loan losses were more than $13 billion higher than in 1988, as banks prepared for future charge-offs on both domestic and foreign loans;
- Net loan charge-offs were the highest in the 42 years that the industry had reported them and were still insufficient to reduce the industry's inventory of troubled assets; and
- Problem assets increased and equity capital declined as a proportion of total assets.
There were, however, encouraging signs in other bank performance indicators for 1989:
- Smaller banks in the Southwest were doing better; they reported increased earnings, fewer full year losses, and a decline in problem assets;
- Banks in the midwest and west enjoyed improved profitability;
- The number of commercial banks on the FDIC's problem bank list declined for the second straight year, to the lowest level since 1985;
- The total of banks that failed or required assistance to avert failure was 15 fewer than 1988's combined total; and
- The average asset size of failed or assisted banks in 1989 was roughly half that of 1988
Many large institutions in the Southwest continued to struggle with weak local real estate markets and nonperforming assets from earlier economic troubles. Of the 207 banks that failed or required assistance during 1989, 167 were in the Southwest. Agricultural bank failures as a percentage of all bank failures fell for the first time to below 1980 levels, to 8.2 percent.
The number of insured commercial banks fell for the fifth straight year from 13,123 at the end of 1988 to 12,709 at the end of 1989. New bank charters declined to the lowest level since 1978. The number of banks on the FDIC's problem bank list declined from 1,406 in 1988 to 1,109 at the end of 1989.
Table 12-2 shows the number and total assets of FDIC insured institutions, as well as their profitability as of the end of 1989.
Table 12-2
Open Financial Institutions Insured by FDIC ($ in Billions)
| Commercial Banks - FDIC Regulated | |||
|---|---|---|---|
| Item | 1988 | 1989 | Percent Change |
| Number | 13,123 | 12,709 | -3.15% |
| Total Assets | $3,130.8 | $3,299.4 | 5.39% |
| Return on Assets | 0.82% | 0.49% | -40.24% |
| Return on Equity | 13.19% | 7.71% | -41.55 |
| Savings Banks - FDIC Regulated | |||
|---|---|---|---|
| Item | 1988 | 1989 | Percent Change |
| Number | 471 | 469 | -0.42% |
| Total Assets | $238.1 | $240.5 | 1.01% |
| Return on Assets | 0.46% | -0.11% | -- |
| Return on Equity | 5.93% | -1.42% | -- |
| Savings Associations - FHLBB/OTS Regulated | |||
|---|---|---|---|
| Item | 1988 | 1989 | Percent Change |
| Number | 2,967 | 2,618 | -11.76% |
| Total Assets | $1,368.4 | $1,187.0 | -13.26% |
| Return on Assets | -0.44% | -0.44% | 0.00% |
| Return on Equity | -11.75% | -9.41% | 19.91% |
Percent change is not provided if either the latest period or the year-ago period contains a negative number.
Source: Reports from FDIC Division of Research and Statistics.
Bank Failures and Assistance to Open Banks
In 1989, the FDIC resolved 207 FDIC insured commercial banks (including one assistance agreement), surpassing the record of 200 bank closings in 1988. The failed banks had total assets of almost $29 billion. Approximately 75 percent of the total assets brought under the FDIC's control in 1989 were from three failures: (1) the 20 subsidiary banks of MCorp, Dallas, Texas, with assets totaling $15.6 billion; (2) the 24 subsidiary banks of Texas American Bancshares, Inc., Fort Worth, Texas, with assets totaling $4.7 billion; and (3) First American Bank and Trust, North Palm Beach, Florida, with nearly $1.4 billion in assets.
Under the authority provided by the Competitive Equality Banking Act in 1987, the FDIC established bridge banks in connection with the three largest failures of 1989: MCorp, Texas American Bancshares, and First American Bank and Trust. That bridge bank authority had been used only three times previously, twice with the failure of the bank subsidiaries of First RepublicBank Corporation, Dallas, Texas and once for Capital Bank & Trust, Baton Rouge, Louisiana.
In 1989, the largest bank in the state of Alaska failed. The 1988 FDIC assisted merger of the two banks that created Alliance Bank, Anchorage, Alaska, crumbled in April 1989. At the time of the closing, Alliance Bank had $779 million in assets. From 1986 to 1989, eight banks, or 40 percent of all banks in Alaska, failed.
Purchase and assumption (P&A) transactions resolved 174 of the bank failures in 1989. Premiums totaling more than $40 million were paid by acquiring institutions, resulting in an estimated savings compared to the cost of payoffs of about $100 million. Of the 174 P&A transactions, 42 were whole bank transactions. Insured deposit transfers (IDTs) accounted for 23 failed bank resolutions, and payoffs occurred in 9 cases. Only one open bank assistance (OBA) transaction took place in 1989, Metropolitan National Bank, San Antonio, Texas. Metropolitan was a very small bank with assets totaling $4.4 million. The transaction resulted in an estimated savings of $410,000 over the estimated cost of a deposit payoff.
By the end of 1989, outstanding net worth certificates were reduced by $63.4 million through contractually required payments and $25.1 million in other payments, and only three savings banks had certificates outstanding for a total of $233.5 million.
The Capital Forbearance Program expired December 31, 1989. During its existence, the FDIC received 352 applications for forbearance and admitted 204 banks into the program. Of the 204 banks, 112 were still in the program at the end of 1989. The other 92 banks left the program for reasons that included merging or increasing capital to satisfactory levels. Applications of 96 banks were denied. In 34 cases, the application was withdrawn or not processed. At the end of 1989, 18 applications were still being processed.
A recent estimate of losses per transaction type is shown in Table 12-3.
Table 12-3
| 1989 Estimated Losses by Transaction Type ($ in Millions) | ||||
|---|---|---|---|---|
| Transaction Type | Number of Transactions | Total Assets | Estimated Loss* | Estimated Losses as a Percent of Assets |
| OBA | 1 | $4.4 | $2.3 | 52.27% |
| P&As | 174 | 26,533.6 | 5,342.1 | 20.13% |
| Payoffs | 9 | 533.3 | 233.4 | 43.77% |
| Totals | 207 | $28,935.0 | $6,198.8 | 21.42% |
Source: Reports from FDIC Division of Research and Statistics.
Payments to Depositors and Other Creditors
Of the 207 banks that failed or were assisted in 1989, deposits totaled $24.2 billion in over 822,800 deposit accounts.12-12 There was one assistance agreement with a bank that had total deposits of $6.4 million. Payoffs accounted for nine transactions with 32,700 deposit accounts with total deposits of $502.1 million. Dividends paid on all active receiverships totaled $3.1 billion in 1989.
Of the 1,644 insured bank resolutions12-13 since the FDIC began operations in 1934, P&A transactions totaled 914 cases, with 130 additional transactions involving whole bank deals. There were 532 deposit payoffs (including 133 IDTs). Additionally, there have been 68 OBA transactions since 1981.
Total disbursements by the FDIC since January 1, 1934, amounted to $51.5 billion. Of that amount, the FDIC recovered $29.1 billion, for a net loss of $22.4 billion.
Asset Disposition
At the beginning of 1989, the FDIC held $9.3 billion in failed bank assets. By the end of 1989, the FDIC was managing the disposition of $25.9 billion in assets from failed institutions, a substantial increase over 1988. That increase was primarily due to the FDIC's assumption of responsibility for the administration and oversight of the FRF in addition to its responsibility for the Bank Insurance Fund (BIF). That resulted in an immediate addition of $11 billion in FRF assets plus $3.5 billion during the remainder of the year. Additionally, the FDIC acquired $5.6 billion in assets from failing institutions. Total assets acquired in 1989 for both BIF and FRF were $20.1 billion. Principal collections for BIF assets were $1.7 billion, and principal collections for FRF were $139 million, for a total of $1.8 billion. At the end of the year, assets from BIF insured failed banks represented $11.5 billion of the total. The remaining $14.4 billion of assets were in liquidation for FRF.
The FDIC's account officers collected nearly $1.8 billion in assets from banks and thrifts. Through bulk sales efforts, the Division of Liquidation sold more than 28,000 loans with a book value of $493 million. While 1989's bulk sales efforts represented a small percentage of the total asset portfolio in terms of dollars, the numbers of loans sold was significant because it reduced the volume of small loans requiring servicing.
In 1989, the FDIC developed a specialized program to negotiate contracts with third-party loan servicers for the disposition of asset pools arising from major transactions nationwide and to monitor and oversee those servicing agreements. Establishing contracts was a major effort for the FDIC to use more private-sector resources. That program was largely patterned after the contracts arising from the 1986 resolution of First National Bank and Trust Company of Oklahoma City, and the 1988 resolution of First RepublicBank Corporation.
The FDIC held its first public nationwide auction of large real estate holdings in March 1989. The auction was conducted by Cushman & Wakefield at Christie's in New York City. Fourteen properties were sold for $40.7 million, a significant 99.4 percent of their appraised value.
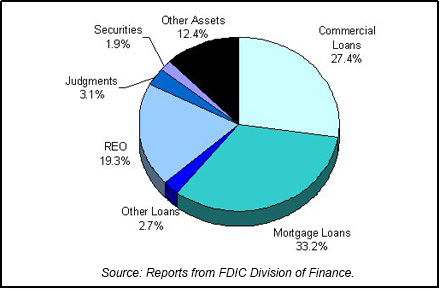
Table 12-4 shows the FDIC's assets in liquidation and Chart 12-1 shows the asset mix.
Table 12-4
| 1989 FDIC End of the Year Assets in Liquidation ($ in Billions*) | ||||||
|---|---|---|---|---|---|---|
| Asset Type | 12/31/88 Book Value | 1989 Assets Acquired | 1989 Prin. Coll. | 1989 Write Downs | 12/31/89 Book Value | 12/31/89 Est. Rec. Value |
| Commercial Loans | $5.4 | $3.3 | $0.7 | $0.9 | $7.1 | $2.6 |
| Mortgage Loans | 1.9 | 7.2 | 0.3 | 0.2 | 8.6 | 5.2 |
| Other Loans | 0.4 | 0.5 | 0.1 | 0.1 | 0.7 | |
| Real Estate Owned | 0.5 | 4.8 | 0.2 | 0.1 | 5.0 | 3.5 |
| Judgments | 0.5 | 0.5 | 0.0 | 0.2 | 0.8 | |
| Securities | 0.1 | 0.7 | 0.3 | 0.0 | 0.5 | 0.5 |
| Other Assets | 0.5 | 3.1 | 0.2 | 0.2 | 3.2 | 1.9 |
| Totals | $9.3 | $20.1 | $1.8 | $1.7 | $25.9 | $13.7 |
Source: Reports from FDIC Division of Finance.
Insurance Fund and Staffing
In 1989, the FDIC's insurance fund lost money for the second straight year. The level of the fund was $13.2 billion. As a percentage of insured deposits, that was an all time low to that date, ending the year with the equivalent of 70 cents for every $100 of deposits insured by the FDIC. At the end of 1988, when the deposit insurance fund hit its previous low of $14.1 billion, the FDIC had 80 cents in reserve for every $100 of insured deposits.
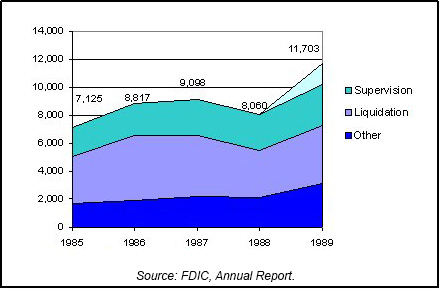
At the end of 1989, the FDIC had 10,187 total staff (not including 1,516 RTC employees), compared to 8,060 at the end of 1988, an increase of 2,127 employees or 26.4 percent. Division of Liquidation staff increased from 3,371 at the end of 1988 to 4141 at the end of 1989, and Division of Supervision, formerly Division of Bank Supervision, staff grew from 2,594 at the end of 1988 to 2,903 at the end of 1989. Total staffing, including 1,516 RTC employees, equaled 11,703. Chart 12-2 shows the staffing levels for the past five years.
Table 12-5
Resolution Trust Corporation
| 1989: RTC at a Glance ($ in Millions) | |
|---|---|
| 12/31/89 | |
| Number of Conservatorships at the beginning of the year | 0 |
| Number of Conservatorships added during the year | 318 |
| Conservatorships resolved during the year | 37 |
| Conservatorships at the end of the year | 281 |
| Total Assets at Takeover | |
|---|---|
| 12/31/89 | |
| Conservatorships | $141,749 |
| Estimated Losses on Thrift Resolutions |
$51,076 |
| Estimated Losses as a Percent of Total Assets | 36.03% |
| Assets in Liquidation | |
|---|---|
| 12/31/89 | |
| Conservatorships | $104,899 |
| Receiverships | $7,945 |
| Total | $112,844 |
| RTC Staffing | 1,516 |
Source: RTC, 1989 Annual Report and Reports from FDIC Division of Research and Statistics.
Notable Events
The RTC was created by the passage of FIRREA on August 9, 1989. That new government corporation became responsible for all management and sale of savings and loans' assets in receivership and all savings and loans in conservatorships since January 1, 1989. In addition, it assumed responsibility for completing all future resolution activity of the former FSLIC through August 8, 1992 (later extended to September 30, 1993 and then to June 30, 1995.)
The FDIC, using moneys from FRF, was to remain responsible for completing the resolution of all thrifts that failed before January 1, 1989, or which were assisted before August 9, 1989. The FDIC, using SAIF funds, was to replace the RTC in resolving thrifts beginning on August 9, 1992.
The FDIC was authorized under FIRREA to act as the RTC's exclusive manager, subject to approval by the RTC Oversight Board. The FDIC carried out all the duties and responsibilities of the RTC and was reimbursed for its services by the RTC. The FDIC Board of Directors served as the RTC Board of Directors, with the FDIC's Chairman serving as RTC Chairman. RTC activities were subject to the general oversight of a newly established Oversight Board, consisting of five members: the secretary of the Treasury; the chairman of the Federal Reserve Board of Governors; the secretary of Housing and Urban Development; and two independent members appointed by the president with the advice and consent of the Senate.
FIRREA also established the Resolution Funding Corporation (REFCORP) to provide funds to the RTC to carry out its mandate. Subject to the Oversight Board's review, REFCORP was granted authority to issue up to $30 billion in long term debt securities, the net proceeds of which were to purchase capital certificates issued by the RTC or to refund previously obligations. The RTC had an initial sunset date of December 31, 1996 (later shortened to December 31, 1995.)
As of the end of 1989, the Treasury had contributed capital of $18.8 billion, and the RTC had issued capital certificates of $5.7 billion to REFCORP. The RTC assumed $55.2 billion of liability for estimated losses on unresolved cases from FSLIC on August 9, 1989, resulting in an accumulated deficit being reported as of the RTC's inception.
As directed by FIRREA, with the exception of a final distribution of funds, the FDIC liquidated the Federal Asset Disposition Association (FADA). Only the resolution of outstanding litigation claims remained before final distribution could be made to FRF as the sole shareholder of FADA. In addition, although the RTC was not created until August 9, 1989, FIRREA directed the RTC to review all insolvent institution cases resolved by FSLIC between January 1, 1988, and August 9, 1989.
S&L Resolutions
On August 9, 1989, the RTC assumed control of 262 insolvent thrift associations with total assets of $115.3 billion and which had been in conservatorship. During the months that remained in 1989, 56 additional thrifts with total assets of $26.4 billion were placed into the RTC's conservatorship program for a total of 318 thrifts. The RTC resolved 37 institutions with total assets at the time of resolution of $10.8 billion during that period. A total of 281 thrifts remained in conservatorship at the end of the year. Those 281 thrifts had a total asset book value of $104.9 billion as of December 31, 1989.
RTC Executive Director David C. Cooke stated in RTC's 1989 Annual Report: "The objectives of a Conservatorship were to establish control and oversight while promoting customer confidence; to evaluate the condition of the institution and determine the most cost-effective method of resolution; and to operate the institution in a safe and sound manner pending resolution. Shrinking an institution by curtailing new lending activity and selling assets was a high priority. A Managing Agent and one or more Credit Specialists oversaw each conservatorship's operations."
Of the 37 resolutions, 7 were P&A transactions, with total assets of $8.6 billion. IDTs accounted for 26 resolutions, with total assets in those institutions of $2 billion. Four institutions with total assets of $196 million were resolved through payoffs.
The RTC's initial duty was to determine the fair market value of the thrifts' assets and estimate the preliminary loss. The estimated preliminary total loss from the 318 thrifts for which the RTC assumed control during 1989 was approximately $31.3 billion as of November 30, 1989. At the end of the year, the RTC had advanced $9.2 billion to 156 thrifts in conservatorship.
Table 12-6
| 1989 Losses by RTC Transaction Type ($ in Millions) | ||||
|---|---|---|---|---|
| Transaction Type | Number of Transactions | Total Assets | Loss* as of 12/31/95 | Estimated Losses as a Percent of Assets |
| OBA | 7 | $8,604.7 | $4,337.4 | 50.41% |
| P&As | 26 | 2,006.0 | 1,397.1 | 69.65% |
| Payoffs | 4 | 195.8 | 154.4 | 78.85% |
| Totals | 37 | $10,806.5 | $5,888.9 | 54.49% |
Source: Reports from FDIC Division of Research and Statistics.
Table 12-7
| Conservatorships | |
|---|---|
| Item | Total |
| In Conservatorship at 8/9/89 | 262 |
| Conservatorships added in 1989 | 56 |
| Subtotal | 318 |
| Conservatorships resolved in 1989 (New Receiverships) | 37 |
| Conservatorships remaining 12/31/89 | 281 |
| Receiverships | |
|---|---|
| Item | Total |
| Receiverships as of 8/9/89 | 0 |
| New Receiverships that were previously Conservatorships in 1989 | 37 |
| Total Receiverships as of 12/31/89 | 37 |
Source: RTC, 1994 Annual Report.
Payments to Depositors and Other Creditors
Of the 37 thrifts that failed in 1989, deposits totaled $10.5 billion in 1,126,043 deposit accounts. Of the four payoffs, total deposits equaled $264.5 million in 25,270 deposit accounts.
Asset Disposition
The RTC initially acquired assets of $115.3 billion in 262 conservatorships. At the end of 1989, the RTC held $8 billion in assets of savings and loans in receivership and in $104.9 billion in assets of conservatorships, for a total of $112.9 billion in assets.
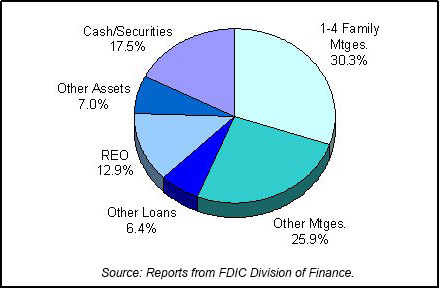
On December 31, 1989, the RTC compiled and published an inventory of real estate assets. The inventory contained approximately 30,000 real property assets, including commercial, residential properties and land. Table 12-8 shows the RTC's assets in liquidation and Chart 12-3 shows the asset mix.
Table 12-8
| 1989 RTC End of the Year Assets in Liquidation ($ in Billions*) | ||||||
|---|---|---|---|---|---|---|
| Asset Type | 8/9/89 Total Book Value | Assets Acq'd During the Year | 1989 Collections | 1989 Losses | 12/31/89 Total Book Value | Memo Item |
| 1-4 Family Mtges | $39.2 | $4.8 | $0.3 | $34.2 | $1.9 | |
| Other Mtges | 33.7 | 3.1 | 1.4 | 29.2 | 4.7 | |
| Other Loans | 9.3 | 1.7 | 0.4 | 7.2 | 0.8 | |
| Real Estate Owned | 15.4 | 1.5 | -0.7 | 14.6 | 1.7 | |
| Other Assets | 12.9 | 0.7 | 4.3 | 7.9 | 0.7 | |
| Cash/Securities | 33.4 | 13.8 | -0.2 | 19.8 | 1.0 | |
| Totals | $143.9 | $25.6 | $5.5 | $112.9 | $10.8 | |
Memo Item: Assets transferred from conservatorship to receivership. Does not affect total of assets in liquidation.
Source: RTC August 1989/September 1995 Statistical Abstract.
Staffing
Upon the enactment of FIRREA, the RTC began building what Executive Director David C. Cooke, described as a decentralized organization. Four regional offices and 14 consolidated field offices were established as operations centers. The regional offices were in charge of all resolutions and asset and contracting operations. The consolidated field offices functioned as service centers for the RTC's asset and real estate management activities. At the end of 1989, the RTC had a total staff of 1,516 employees, most of whom were in the consolidated field offices.
12-1 The tables and charts throughout this book are shown for ease of comparison. They are formatted the same way in every chapter. Refer to the Appendix for a guide that includes definitions of terms used in the tables and charts. Back to text
12-2 Bureau of Economic Analysis, Department of Commerce. Back to text
12-3 CB Commercial Torto/Wheaton Research and Bureau of Labor Statistics, Department of Labor. Back to text
12-4 Housing Market Statistics, National Association of Home Builders (June 1996). Back to text
12-5 CB Commercial Torto/Wheaton Research. Back to text
12-6 Housing Market Statistics, National Association of Home Builders (June 1996), and Federal Home Loan Mortgage Corporation. Back to text
12-7 CB Commercial Torto/Wheaton Research.Back to text
12-8 Economic Report of the President, 1986. Back to text
12-9 National Agricultural Statistics Service, U.S. Department of Agriculture. Economic Research Service, U.S. Department of Agriculture. Federal Reserve System, Board of Governors, Flow of Funds Accounts, Table L. 102. Gerald H. Anderson, “The Decline in U.S. Agricultural Exports,” Federal Reserve Bank of Cleveland Economic Commentary (February 15, 1987), 1. Back to text
12-10 Annual Energy Review, Department of Energy. Back to text
12-11 John F. Bovenzi and Maureen E. Muldoon, “Failure-Resolution Methods and Policy Considerations,” FDIC Banking Review 3, no. 1 (fall 1990), 1. Back to text
12-12 This figure does not include open bank assistance transactions. The FDIC did not begin including assistance agreements with the failures for reporting purposes until 1981. Five assistance agreements, with total deposits of $6.8 billion, including First Penn, should be included in the overall totals. Back to text
12-13 Liquidation staff does not include support personnel from other FDIC divisions, such as the Legal Division and the Division of Accounting and Corporate Services (later the Division of Finance), who also were working on liquidation matters. Back to text
Table of Contents