
Managing the Crisis: The FDIC and RTC Experience — Chronological Overview
Chapter Six: 1983
Unveiling of the design for a commemorative U.S. postage stamp marked the fiftieth anniversary of the FDIC. Although the anniversary was observed in a festive atmosphere, 1983 was a year of serious and intense activity for the FDIC.
Table 6-1
| 1983 - 1983: FDIC at a Glance ($ in Millions) | |||
|---|---|---|---|
| 12/31/82 | 12/31/83 | Percent Change | |
| Number of Bank Failures |
34 | 45 | 32.35% |
| Assistance to Open Banks | 8 | 3 | -62.50% |
| Total Failed and Assisted Banks | 42 | 48 | 14.29% |
| Total Assets of Failed and Assisted Banks | $11,722.6 | $7,191.7 | -38.65% |
| Losses on Failed and Assisted Banks | $1,168.6 | $1,407.0 | 20.43% |
| Losses as a Percent of Total Assets | 9.97% | 19.56% | 96.29% |
| Assets in Liquidation | $2,155.1 |
$4,259.6 | 97.65% |
| FDIC Staffing | 3,504 | 3,846 | 9.76% |
| Number of Problem Banks | 369 | 642 | 73.98% |
| Deposit Insurance Fund Balance | $13,770.9 | $15,429.1 | 12.04% |
| Deposit Insurance Fund Balance as a Percent of Insured Deposits | 1.21% | 1.22% | 0.83% |
Source: FDIC, 1983 Annual Report and Reports from FDIC Division of Finance and Division of Research and Statistics.
Notable Events
Two years after the passage of the Depository Institutions Deregulation and Monetary Control Act of 1980, Congress passed the Garn-St Germain Depository Institutions Act (Garn-St Germain) of 1982. Garn-St Germain took deregulation even further and gave the regulators more flexibility in dealing with failing or failed institutions, including the authority to seek out-of-state bidders for emergency acquisitions.
Legislation was introduced late in 1983 to strengthen and refine the provisions of the Federal Deposit Insurance Act of 1950. Among its provisions, The Federal Deposit Insurance Improvements Act of 1983 authorized the FDIC to vary deposit insurance premium rebates on the basis of the risk that any insured bank represented to the insurance fund. It also required that the FDIC be designated receiver of any closed bank, and it would set priorities for the payment of claims against the failed bank.
Economic/Banking Conditions
The country saw much better economic times in 1983, as the economy began to rebound from the recent recession. Gross Domestic Product (GDP) was up about 4 percent.6-1 Inflation was less than half what it was just two years previously, standing at 4.3 percent.6-2 The unemployment rate held steady at 9.6 percent.6-3 Employment growth was meager at 0.2 percent.6-4 Interest rates continued to fall; the discount rate was 8.5 percent, and the 30-year mortgage rate was at 13.2 percent.6-5 Following the rapid expansion of lending in commercial real estate markets, the office vacancy rate continued to rise and was at 13.4 percent.6-6 Growth in the residential real estate markets was substantial with home sales up 38.2 percent and housing starts up 60.4 percent, after both had experienced a three-year skid.6-7
In the Southwest, farmers were still experiencing hard times as farm loans peaked and farm debt continued to increase. Agriculture prices continued their decline.6-8 The downturn in the agricultural sector in recent years was beginning to take its toll on agricultural banks. Real farm income was down to $8.2 billion (from $22.8 billion in 1980) while total farm business liabilities had nearly tripled from their 1970 values, reaching a peak for the 1980s of $207 billion.6-9 The percentage of nonperforming loans at agricultural banks continued to rise.
Commercial vacancy rates were on the rise in the Southwest; for instance, the commercial vacancy rate in Houston, Texas, was up to 27 percent.6-10 Despite the rising vacancy rates, total real estate loans rose to 15.1 percent of assets, up from 12.4 percent in 1982, including a large increase in commercial real estate loans, from 5.1 percent of assets in 1982 to 6.4 percent in 1983. Gross State Product growth for the Southwest region was minimal and well below the national GDP growth rate.6-11
The Northeast enjoyed a quick recovery from the national recession, and expansion began in the real estate market. Institutions’ real estate portfolios increased at a rate two times the national average. The region also saw above average growth in overall production and lower unemployment rates than the rest of the U.S.6-12
California also saw expansion in its economy, especially in the construction industry, as the number of housing permits increased.6-13 There continued to be many newly chartered banks in the state. Total real estate loans increased to 17.9 percent of assets, up from 15.2 percent a year earlier, and commercial real estate loans, at 3.4 percent of assets, also rose throughout the state.
The downturn in the agricultural sector in recent years was beginning to take its toll on agricultural banks, and the percentage of nonperforming loans at those banks continued to rise. There were, however, 378 newly chartered banks. The Office of the Comptroller of the Currency and the Federal Reserve Board extended capital reserve requirements to include multi-national banks. Lesser developed countries (LDC) debt improved as twenty-seven countries were able to reach restructuring agreements regarding the payments of their obligations.6-14
The need for major changes in the regulatory and deposit insurance structures became increasingly apparent in 1983. Mechanisms crafted half a century earlier to regulate and insure banks were no longer adequate. The most fundamental change flowing from deregulation had been the growth of competition in banking markets. That enhanced competition led to increased risk-taking and greater opportunities for banks to fail.
At the end of 1983, there were 642 banks on the problem bank list, compared with 369 on the list at the end of 1982. The increase in the number of banks on the list during 1983 reflected the continued affects of the 1981-1982 recession and increased competition among banks due to deregulation.
Table 6-2 shows the number and total assets of FDIC insured institutions, as well as their profitability as of the end of 1983.
Table 6-2
Open Financial Institutions Insured by FDIC ($ in Billions)
| Commercial Banks – FDIC Regulated | |||
|---|---|---|---|
| 1982 | 1983 | Percent Change | |
| Number | 14,451 |
14,469 |
0.12% |
| Total Assets | $2,193.3 |
$2,342.1 |
6.78% |
| Return on Assets | 0.70% |
0.66% |
-5.71% |
| Return on Equity | 12.02% |
11.90% |
-1.00% |
| Savings Banks – FDIC Regulated | |||
|---|---|---|---|
| 1982 | 1983 | Percent Change | |
| Number | 315 |
294 |
-6.67% |
| Total Assets | $155.0 |
$170.7 |
10.13% |
| Return on Assets | -0.79% |
-0.10% |
87.34% |
| Return on Equity | -15.62% |
-2.18% |
86.04% |
| Savings Associations – FHLBB Regulated | |||
|---|---|---|---|
| 1982 | 1983 | Percent Change | |
| Number | 3,349 |
3,183 |
-4.96% |
| Total Assets | $699.5 |
$819.1 |
17.10% |
| Return on Assets | -0.63% |
0.26% |
-- |
| Return on Equity | -17.52% |
8.51% |
-- |
Percent change is not provided if either the latest period or the year-ago period contains a negative number.
Source: Reports from FDIC Division of Research and Statistics.
Bank Failures and Assistance to Open Banks
Despite the turnaround in the economy, there were 45 bank failures and 3 assisted mergers of mutual savings banks, a post-Depression record. That number included several large institutions, which resulted in a substantial increase in the volume of failed bank assets held by the FDIC, as receiver. In order to handle those assets more efficiently, the FDIC decentralized its liquidation operations. It opened and staffed five new area liquidation offices, with each office responsible for ten states. The offices were located in Atlanta, Chicago, Dallas, and San Francisco, (the New York office opened in November 1982.)
In 1983, the FDIC developed an alternative to a deposit payoff when no assuming bank could be found for the failed bank. In an Insured Deposit Transfer (IDT), the FDIC transferred all the insured deposits to a healthy institution. Former depositors of the failed bank could then leave their accounts in the transferee bank or move their deposits to another financial institution. An IDT minimized the disruption to the closed bank’s customers and to the affected community. The procedure also reduced the FDIC’s cost in handling a failure because the FDIC did not have the burden of directly paying each customer.
Of the 48 banks that failed or were assisted, the FDIC resolved 36 institutions through purchase and assumption (P&A) transactions. There were seven deposit payoffs, and two institutions were resolved using a new procedure called “insured deposit transfer (IDT).” The three assisted mergers of mutual savings banks are discussed below.
- The FDIC assisted the merger in New York City of Dry Dock Savings Bank into The Dollar Savings Bank under the Voluntary Merger Plan. The resulting institution had combined assets exceeding $5 billion.
- In Oregon, a change in state law made possible the conversion of Oregon Mutual Savings Bank into a stock-form state chartered bank and its subsequent acquisition by Moore Financial Group, Inc., Boise, Idaho. The FDIC assistance consisted of a cash payment of $11.8 million.
- Auburn Savings Bank, Auburn, New York, was absorbed by Syracuse Savings Bank. The cost of the FDIC assistance was $2.9 million.
At the end of the year 1983, 23 depository institutions had net worth certificates outstanding which totaled $376.8 million.
A recent estimate of losses per transaction type is shown in Table 6-3.
Table 6-3
| 1983 Losses by Transaction Type ($ in Millions) | ||||
|---|---|---|---|---|
| Transaction Type | Number of Transactions | Total Assets | Losses | Losses as a Percent of Assets |
| OBA | 3 | $2,851.1 | $71.3 | 2.50% |
| P&As | 36 | 4,143.2 | 1,309.8 | 31.61% |
| IDTs | 2 | 47.3 | 13.9 | 29.39% |
| Payoffs | 7 | 150.1 | 12.0 | 7.99% |
| Totals | 48 | $7,191.7 | $1,407.0 | 19.56% |
Source: Reports from FDIC Division of Research and Statistics.
The failure of the United American Bank (UAB), Knoxville, Tennessee on February 15, initially made headlines because its owner, Jake Butcher, was the principal organizer and promoter of the 1982 World?s Fair and twice was a candidate for governor of the State of Tennessee. The deposit liabilities and assets of UAB were transferred to First Tennessee Bank of Knoxville, a subsidiary of First Tennessee Corporation, Tennessee?s largest bank holding company. The transaction was noteworthy because it marked the first use of the extraordinary acquisition provisions of the Garn-St Germain Depository Institutions Act of 1982. Before the year was out, seven more Tennessee banks controlled by Jake Butcher or his brother, C.H. Butcher, Jr., failed. There were almost daily reports of an excessive volume of classified loans, loans to insiders, loans far from the bank?s trade area, and evidence of inaccurate or deliberately misleading accounting.
The insolvency of United American Bank and, subsequently, of other Butcher-related institutions, was discovered only because the FDIC undertook a simultaneous examination of the major Butcher-affiliated banks, committing to the task nearly 10 percent of its field workforce for almost three months. At the end of 1983, the FDIC estimated that its losses in connection with the eight failed Butcher banks would amount to approximately $382.6 million.
Payments to Depositors and Other Creditors
In the 48 banks that failed or were assisted in 1983, there were 934,023 deposit accounts with $5.8 billion in deposits. Of those totals, the seven deposit payoffs represented 16,813 deposit accounts and $139.2 million in deposits. The three assistance agreements represented 388,290 deposit accounts with $2.4 billion in deposits. Of the 668 banks6-15 that failed or were assisted since the FDIC?s inception in 1934, there were 340 P&A transactions and assistance agreements and 328 deposit payoffs including IDTs. All the accounts in the P&A transactions and the assistance agreements, with deposits aggregating $24.2 billion, were fully protected. In the deposit payoffs, 85.5 percent of the $1.1 billion in deposits had been paid by year-end 1983.
Total disbursements by the FDIC since January 1, 1934, amounted to $10.9 billion. Of that amount, the FDIC recovered $8.3 billion for a net loss of $2.6 billion.
Asset Disposition
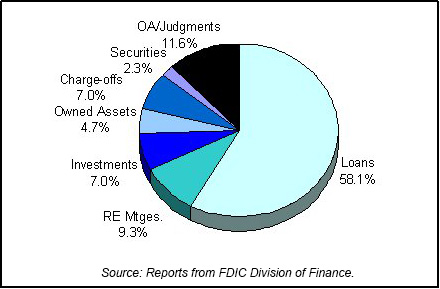
At the beginning of 1983, the FDIC had $2.2 billion in failed bank assets. The 45 bank failures in 1983 had an aggregate of $4.3 billion in assets, some of which were sold at resolution. The FDIC?s inventory of assets in liquidation almost doubled. Gross collections for the year were $269 million. At the end of 1983, the FDIC?s total workload had increased to 65,000 assets with a book value of $4.3 billion. Table 6-4 shows the FDIC?s assets in liquidation and Chart 6-1 shows the asset mix.
Table 6-4
| 1983 FDIC End of the Year Assets in Liquidation ($ in Billions) | ||||
|---|---|---|---|---|
| Asset Type | 12/31/82 Book Value | 12/31/83 Book Value | 12/31/83 Est. Recovery Value | |
| Loans | $1.1 | $2.5 | $1.6 | |
| Real Estate Mortgages | 0.4 | 0.4 | 0.4 | |
| Investments | 0.2 | 0.3 | 0.3 | |
| Owned Assets | 0.1 | 0.2 | 0.1 | |
| Charge-Offs | 0.0 | 0.3 | 0.3 | |
| Securities | 0.1 | 0.1 | 0.0 | |
| Other Assets/Judgments | 0.3 | 0.5 | 0.2 | |
| Totals | $2.2 | $4.3 | $2.9 | |
Source: Reports from FDIC Division of Finance.
Insurance Fund and Staffing
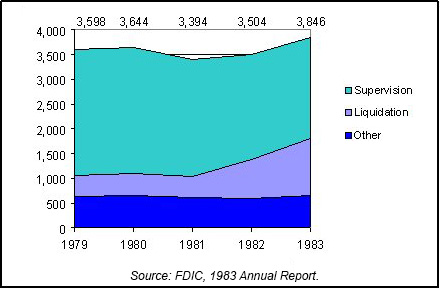
The deposit insurance fund continued to grow in 1983, although numerous bank failures created large expenses for the FDIC. The fund reached a new high of $15.4 billion, an increase of $1.7 billion. The FDIC ended 1983 with 3,846 employees, an increase of 342 over 1982. The Division of Liquidation staff increased from 778 at the end of 1982 to 1,153; most of that increase involved temporary employees hired to cope with the increased number of bank closings. The Division of Bank Supervision staff, however, fell from 2,129 at the end of 1982 to 2,053. Chart 6-2 shows the staffing levels for the past five years.
Private Resolutions
The failure of the Nebraska Depository Institution Guaranty Corporation (NDIGC) was caused by the failure of its largest member, Commonwealth Savings Company (Commonwealth), Lincoln, Nebraska, which held approximately 20 percent of the deposits insured by NDIGC. The state closed Commonwealth on November 1, 1983, freezing deposits of $67 million. That failure was due to a combination of factors, including mismanagement, insider fraud and abuse, and hesitancy on the part of state regulators. To conserve liquidity, state regulators ordered NDIGC members not to make early payments on investment certificates, which were similar to certificates of deposits.
The closure sparked runs on other NDIGC insured institutions. Losses to depositors from the Commonwealth failure were initially about $56 million; the NDIGC’s reserves were only $1.5 million. In July 1984, State Security Company, NDIGC’s second largest member, went into bankruptcy, followed by American Savings Company, the third largest member, in January 1985. By March 1992, liquidation of the three failed industrial savings companies had reduced aggregate losses to depositors to about $33 million. Part of the gain for depositors included a payment of $8.5 million made by the state of Nebraska in 1986 to settle a negligence suit against the Department of Banking and Finance.6-16
State insurance funds were more vulnerable to depositor runs than the FDIC?s insurance fund. Runs on deposits, usually a regional occurrence, strained liquidity, leading to insolvency of the state insurance fund. Whereas, the FDIC?s insurance fund withstood regional disturbances.
6-1 Bureau of Economic Analysis, Department of Commerce. Back to Text
6-2 Bureau of Labor Statistics, Department of Labor. Back to Text
6-3 Bureau of Labor Statistics, Department of Labor. Back to Text
6-4 CB Commercial Torto/Wheaton Research. Back to Text
6-5 Housing Market Statistics, National Association of Home Builders (June 1996), and Federal Home Loan Mortgage Corporation. Back to Text
6-6 CB Commercial Torto/Wheaton Research. Back to Text
6-7
Housing Market Statistics, National Association of Home Builders (June
1996). Back to Text
6-8
Economic Report of the President, 1986. Back to Text
6-9
Federal Reserve System, Board of Governors, Flow of Funds Accounts, Table
L. 102. Kevin L. Kliessen and R. Alton Gilbert, “Are Some Agricultural
Banks Too Agricultural?” Federal Reserve Bank of St. Louis Review 78,
No. 1 (January/February 1996): 26. Sada L. Clarke, “The Outlook for
Agriculture in ‘82,” Federal Reserve Bank of Richmond Economic
Review (January/February 1982): 25-29. Back to Text
6-10
CB Commercial Torto/Wheaton Research. Back to Text
6-11
Bureau of Economic Analysis, Department of Commerce. Back
to Text
6-12
Bureau of Economic Analysis and Bureau of Labor Statistics, Department
of Labor. Back to Text
6-13
Bureau of the Census, Building Permits Section, Manpower and Construction
Statistics Branch. Back to Text
6-14
Philip A. Wellons, Passing the Buck: Banks, Government and Third World
Debt (1987), 225. Back to Text
6-15
This figure does not include open bank assistance transactions from 1934-1980.
The FDIC did not begin including assistance agreements with the failures
for reporting purposes until 1981. Five assistance agreements, with total
deposits of $6.8 billion, should be included in the overall totals. Back
to Text
6-16
William B. English, “The decline of private deposit insurance in the
United States” (Carnegie-Rochester Conference Series on Public Policy,
1993), 67-68, 114-115.Back to Text
Table of Contents