
Managing the Crisis: The FDIC and RTC Experience — Chronological Overview
Chapter Nineteen: 1996
Acting Chairman Andrew C. Hove is quoted in the FDIC's 1997 Annual Report as stating, “The FDIC spent much of 1997 preparing for a new financial world being shaped by consolidation and technical change. Our freedom to focus on the future was, in large part, a reflection of the extraordinary healthy state of the banking and thrift industries. Low and stable interest rates, and a growing economy, gave both industries the opportunity to register record profits in 1997.”
Table 19-1
| 1995 - 1996: FDIC at a Glance ($ in Millions) | |||
|---|---|---|---|
| 12/31/95 | 12/31/96 | Percent Change | |
| Number of Bank Failures |
6 | 6 | 0.00% |
| Total Assets of Failed and Assisted Banks | $802.1 | $232.6 | -71.00% |
| Estimated Losses on Failed and Assisted Banks |
$84.5 | $60.6 | -28.28% |
| Estimated Losses as a Percent of Total Assets | 10.53% | 26.05% | 147.39% |
| Assets in Liquidation | $10,308.2 | $8,711.2 | -15.49% |
| FDIC Staffing | 9,789 | 9,151 | -6.52% |
| Number of Problem Banks | 193 | 117 | -39.38% |
| Bank Insurance Fund Balance | $25,453.7 | $26,854.4 | 5.50% |
| Bank Insurance Fund Balance as a Percent of Insured Deposits | 1.30% | 1.34% | 3.08% |
| Savings Insurance Fund Balance | $3,357.8 | $8,888.4 | 164.71% |
| Savings Insurance Fund Balance as a Percent of Insured Deposits | 0.47% | 1.30% | 176.60% |
Source: FDIC, 1996 Annual Report and Reports from FDIC Division of Finance and Division of Research and Statistics.
Notable Events
- On January 29, Joseph H. Neely, former Mississippi banking commissioner, was sworn in as a member of the FDIC Board of Directors. His appointment brought the Board to its full membership of five directors for the first time since August 1992.
- On February 9, at a FDIC symposium on derivatives, Chairman Helfer announced new efforts to monitor and assess risk at insured institutions. The efforts were designed to enhance the FDIC's traditional approach to risk assessment allowing the agency to respond more quickly and efficiently to emerging risks. The FDIC developed specific guidelines for examiners on how to factor relevant economic and other data into their risk evaluations of specific institutions.
- On July 16, the FDIC's Legal Division issued guidance to help bank and thrifts decide whether the stored-value cards they issue qualify for federal deposit insurance. The FDIC Board of Directors approved General Counsel Opinion No. 8 that states in most cases the stored-value cards are not protected by deposit insurance because the issuing institution would typically maintain a single pooled account to hold the funds represented by all their customers' stored-value cards.
- On October 29, responding to the FDIC's declining workload, Deputy to the Chairman and Chief Operating Officer Dennis F. Geer outlined the Corporation's plans for downsizing in 1997 and subsequent years.
- On December 8, the FDIC created the new Division of Resolutions and Receiverships (DRR), to handle the reduced levels of resolution and liquidation work projected over the next several years. The new division represented a merger of the Division of Depositor and Asset Services and the Division of Resolutions.
- On December 10, the FDIC unveiled a new service called “Institution Directory,” which enables the public to obtain information about individual banks and savings institutions via the Internet.
- On December 20, the FDIC Board adopted the interagency Federal Financial Institutions Examination Council's revised “CAMELS” rating system for assessing the soundness of financial institutions on a uniform basis. Along with: capital (C), asset quality (A), management (M), earnings (E), and liquidity (L), the banking agencies added a sixth component to the rating system ? sensitivity to market risk (S).
Economic/Banking Conditions
The U.S. economy grew rapidly in 1996, as GDP expanded by a robust 5.6 percent. Unemployment reflected this favorable trend, declining 20 basis points from 5.6 percent to 5.4 percent. An additional 2,272,000 individuals found employment during 1996. Reflecting the improved economy, new home sales spiked by 13.5 percent during 1996 to 757,000. Also, new housing starts rose 9.1 percent. This strong performance in the residential sector is especially impressive in light of the 63 basis-point rise in the 30 year mortgage rate from 7.51 percent to 8.14 percent. Moving in the opposite direction was the discount rate which declined modestly from 5.25 percent to 5 percent during the year. Another favorable trend was the decline in the office vacancy rate from 13.6 percent to 12 percent.19-1
It was a very strong year for commercial banks as profits grew, and there were high levels of returns on both equity and assets. Commercial bank assets also grew this year, however slower than in 1995. The increase in assets was due largely to an increase in loan volume that was spurred by the strong economy. Net income increased by 8 percent and return on assets experienced a new high. Security holdings grew less than 1 percent. Both interest income and interest expense fell. Non-interest income increased 17 basis points and non-interest expense increased 8 basis points as a percentage of assets. The increase in non-interest expense was attributed to the restructuring costs of several large bank mergers.
Commercial and Industrial loans grew by 7.25 percent. Good conditions in the real estate market, an increase in real estate prices, and a reduction in vacancy rates allowed commercial real estate loans to increase 7.75 percent. The balance of consumer loans increased 5 percent. Delinquency and charge-off rates were low in business loans, especially in the real estate area. However, household delinquency rates continued to rise. Core deposits increased slowly which was partly be explained by low yields on bank deposits relative to alternative investments.19-2
At end of 1996, there were 11,484 financial institutions in the United States and 117 institutions on the problem bank list. 19-3
Table 19-2 shows the number and total assets of FDIC insured institutions, as well as their profitability as of the end of 1995.
Table 19-2
Open Financial Institutions Insured by FDIC ($ in Billions)
| BIF Members | |||
|---|---|---|---|
| 1995 | 1996 | Percent Change | |
| Number | 10,243 | 9,823 | -4.10% |
| Total Assets | $4,577.9 | $4,857.8 | 6.11% |
| Return on Assets | 1.15% | 1.17% | 1.74% |
| Return on Equity | 14.32% | 14.14% | -1.26% |
| SAIF Members | |||
|---|---|---|---|
| Item | 1995 | 1996 | Percent Change |
| Number | 1,727 | 1,629 | -5.67% |
| Total Assets | $760.5 | $749.6 | -1.43% |
| Return on Assets | 0.76% | 0.67% | -11.84% |
| Return on Equity | 9.47% | 8.08% | -14.68% |
| US Branches of Foreign Banks | 39 | 32 | -17.95% |
Source: FDIC Quarterly Banking Profile, Fourth Quarter 2001.
Bank Failures
During 1996, the FDIC resolved six institutions ? five insured by the BIF and one insured by the SAIF. One of the BIF-insured institutions, however, had a portion of its deposits insured by the SAIF (this is known as an “Oakar” institution ? refer to Chapter 16 ? 1993). The five BIF-insured failures had combined assets of $200 million. The one SAIF-insured institution that closed, with total assets of $32.6 million, was the first SAIF-insured failure since the FDIC took over that responsibility from the Resolution Trust Corporation (RTC).
Purchase-and-assumption (P&A) transactions were used to resolve all six failures in 1996. In two of the six failures, all deposits were assumed. In the remaining four failures, the acquiring institution assumed only the insured deposits, and those depositors with balances above the $100,000 insurance limit received a proportionate share of the proceeds from the liquidation of the failed institution's assets.
In 1996, DRR unveiled the Standard Asset Valuation Estimation (SAVE) project, which provides consistent asset valuation methodology in the resolution and liquidation process. This is done by employing standard discounted cash flow models and valuation assumptions in the valuation of assets. The SAVE methodology is also used to calculate loss reserve estimations for assets held by the BIF, the SAIF, and the FSLIC Resolution Fund (FRF) as a part of the FDIC year-end 1996 financial statements.
A recent estimate of losses per transaction type is shown in Table 19-3.
Table 19-3
| 1996 Estimated Losses by Transaction Type ($ in Millions) | ||||
|---|---|---|---|---|
| Transaction Type | Number of Transactions | Total Assets | Estimated Loss* as of 12/31/03 | Estimated Losses as a Percent of Assets |
| P&As | 6 | $232.6 | $60.6 | 26.05% |
Source: Reports from FDIC Website ? Historical Statistics on Banking.
Payments to Depositors and Other Creditors
In the six financial institutions that failed in 1996, deposits totaled $230.4 million in 16,970 deposit accounts. Dividends paid on all active receiverships totaled almost $10.2 billion in 1996.
There have been a total of 2,133 18-5 insured financial institution resolutions since the FDIC began operations in 1934. Of this total, 1,451 were P&A transactions, 79 were open bank assistance transactions, and 603 were deposit payoff transactions.
Total disbursements by the FDIC since January 1, 1934, have amounted to $104.4 billion. Of that amount, actual and projected recoveries are anticipated to be approximately $66.5 billion, which equates to a projected loss of $37.9 billion to the BIF/SAIF funds.
Asset Disposition
At the beginning of 1996, the FDIC held $10.3 billion in assets from failed institutions. That total included $8.8 billion in BIF assets, $6 million in SAIF assets, $1.5 billion in FRF assets. Assets totaling $7.7 billion were transferred from the RTC to the FDIC at the beginning of 1996. During the year, the FDIC acquired an additional $213 million in assets from five bank failures and one thrift failure. The FDIC collected $5.9 billion during the year 19-5 and the ending balance for assets in liquidation was $8.7 billion, a reduction of $9.3 billion. Of the $8.7 billion, $3.8 billion was assets in liquidation for BIF, $36 million for SAIF, $476 million for FRF, and $4.4 billion for RTC.
During 1996, the FDIC sold real estate properties for a total of $353 million, yielding a recovery of 95 percent of average appraised value. More than 17,112 loans and other assets totaling $4.1 billion in book value were sold through asset marketing efforts, with net sales proceeds during 1996 representing 98 percent of appraised value.
When the RTC's unfinished work was transferred to the FDIC at the end of 1995, the FDIC assumed responsibility for the RTC Affordable Housing Program. The program was revised in 1996 to meet standards for asset disposition set forth in the FDIC Improvement Act of 1991. The revised program included the following: a 90-day period during which all single and multi-family properties designated as affordable housing were to be marketed exclusively to eligible individuals or organizations; an expanded clearinghouse program to provide property lists to potential buyers; and a technical assistance program to advise nonprofit organizations and public agencies when purchasing multifamily properties.
During 1996, the FDIC sold more than 3,266 affordable housing units from failed thrifts and banks for $39.9 million under this program. Sales included 46 multifamily and 455 single-family properties. Since 1990, the FDIC and RTC programs have had cumulative sales of more than 123,900 affordable housing units for $1.8 billion.
In addition, 32 state housing agencies and nonprofit organizations acting under a memorandum of understanding with the FDIC monitored 38,567 rental units for low- and very low-income households to ensure that purchasers were making units available to these households at adjusted rents as specified in the purchase agreement. These units originally were sold under the FDIC/RTC affordable housing program.
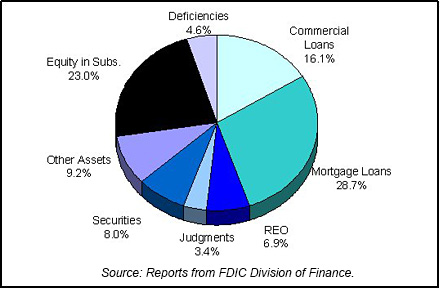
Table 19-4 shows the FDIC's assets in liquidation and Chart 19-1 shows the asset mix.
Table 19-4
| 1996 FDIC End of the Year Assets in Liquidation ($ in Billions*) | |||||||
|---|---|---|---|---|---|---|---|
| Asset Type | 12/31/95 FDIC Book Value | 12/31/95 RTC Book Value | 1996 Assets Acquired | 1996 Prin. Coll. | 1996 Write Downs | 12/31/96 Book Value | 12/31/96 Est. Rec. Value |
| Commercial Loans | $2.6 | $0.5 | $0.1 | $0.0 | $1.8 | $1.4 | $0.5 |
| Mortgage Loans | 4.0 | 1.8 | 0.0 | 0.7 | 4.1 | 2.5 | 2.4 |
| Other Loans | 0.0 | 0.1 | 0.0 | 0.0 | 0.1 | 0.0 | 0.0 |
| Real Estate Owned | 0.7 | 0.8 | 0.1 | 0.2 | 1.1 | 0.6 | 0.6 |
| Judgments | 1.5 | 1.1 | 0.0 | 0.2 | 1.5 | 0.3 | 0.8 |
| Securities | 0.0 | 1.3 | 0.0 | 0.7 | 1.3 | 0.7 | 0.1 |
| Other Assets | 0.7 | 0.1 | 0.0 | -0.3 | 0.1 | 0.8 | 0.0 |
| Equity in Subs. | 0.1 | 1.5 | 0.0 | 0.3 | 1.0 | 2.0 | 0.1 |
| Deficiencies | 0.7 | 0.5 | 0.0 | 0.3 | 0.7 | 0.4 | 0.4 |
| Totals | $10.3 | $7.7 | $0.2 | $2.1 | $11.7 | $8.7 | $4.8 |
Source: Reports from FDIC Division of Finance.
Insurance Fund and Staffing
With the recapitalization of the BIF in May 1995, the FDIC Board of Directors lowered the assessment rates for BIF-assessable deposits, creating a significant disparity in the assessment rates paid to the BIF and the SAIF. This disparity created incentives for institutions to move deposits from the SAIF to the BIF which, in turn, raised the question of whether a shrinking SAIF-assessable deposit base could continue paying the interest on debt and also capitalize the SAIF.
To address the financial problems of the SAIF, Congress passed the Deposit Insurance Funds Act of 1996 (DIFA), which became law on September 30, 1996The DIFA required the FDIC to impose a one-time special assessment to capitalize the SAIF on October 1, 1996, at the statutorily required Designated Reserve Ratio of 1.25 percent of insured deposits.
The FDIC Board set the special assessment at 65.7 cents per $100 of SAIF-assessable deposits. With the SAIF fully capitalized, the Board approved a reduction in SAIF assessment rates effective October 1, 1996.
With banks experiencing yet another record-breaking year of profitability and only a handful of bank failures, 1996 was another positive year for the BIF. In recent years, the BIF had climbed steadily, reaching $26.9 billion in 1996, its third consecutive record year-end high. With the special assessment adding $4.5 billion to the SAIF on October 1, the fund ended the year with a balance of $8.9 billion, a 164.7 percent rise over the $3.4 billion balance at year-end 1995.
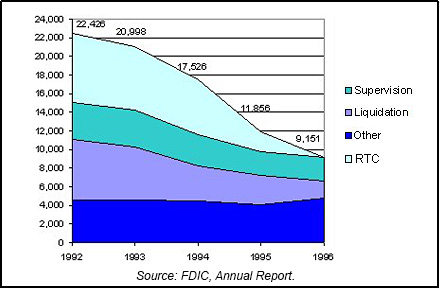
The Corporation continued to shrink the size of its workforce substantially during 1996 because of reduced workload. Total FDIC staffing was reduced by approximately 22.8 percent, from 11,856 on December 31, 1995 (including more than 2,000 RTC employees transferred to the FDIC on that date), to 9,151 on December 31, 1996. This was accomplished primarily through the expiration of term and temporary appointments, and the second phase of the buyout program. The program was open to almost 7,000 FDIC and RTC employees from November 1995 through January 1996. Approximately 300 employees applied for buyouts during the first phase and were required to leave the Corporation by December 31, 1995. About 600 employees applied during the second phase, and most left the Corporation at various times during 1996. Both phases of the buyout program saved the Corporation an estimated $97.5 million in employee-related costs. Chart 19-2 shows the staffing levels for the past five years.
19-1 Bureau of Labor and Statistics, Department of Labor; Bureau of Economic Analysis, Department of Commerce; Housing Market Statistics, National Association of Home Builders; and Federal Home Loan Mortgage Corporation. Back to Text
19-2 Federal Reserve Bulletin; Volume 83; Number 6; June 1997. Back to Text
19-3 FDIC Quarterly Banking Profile, Fourth Quarter 1996. Back to Text
19-4 In 1988 there were 21 assistance agreements that resolved 79 institutions. The FDIC annual report (source data) calculates failure data per transaction; this report calculates failures per failed institution. Actual resolutions through 1996 totaled 2,191. Back to Text
19-5 After 1996, a joint DRR, DOF, DRS task force redefined what constitutes a collection. The $5.9 billion in collections is based on the new definition. In 1996, FDIC actually reported collections of $6.6 billion. Back to Text
Table of Contents