
Managing the Crisis: The FDIC and RTC Experience — Chronological Overview
Chapter Ten: 1987
Another post-Depression record was set as insured bank failures in 1987 totaled 184, almost a one-third increase over the previous year?s record of 138. More than half of the 1987 bank failures and most of the assistance transactions took place in three states: Texas, Oklahoma, and Louisiana.
Table 10-1
| 1986 - 1987: FDIC at a Glance ($ in Millions) | |||
|---|---|---|---|
| 12/31/86 | 12/31/87 | Percent Change | |
| Number of Bank Failures | 138 | 184 | 33.33% |
| Assistance to Open Banks | 7 | 19 | 171.43% |
| Total Failed and Assisted Banks | 145 | 203 | 40.00% |
| Total Assets of Failed and Assisted Banks | $8,069.1 | $9,407.0 | 16.58% |
| Losses on Failed and Assisted Banks | $1,775.7 | $2,022.8 | 13.92% |
| Losses as a Percent of Total Assets | 22.01% | 21.50% | -2.32% |
| Assets in Liquidation | $10,856.0 | $11,339.9 | 4.46% |
| FDIC Staffing | 8,817 | 9,098 | 3.19% |
| Number of Problem Banks | 1,484 | 1,575 | 6.13% |
| Deposit Insurance Fund Balance | $18,253.3 | $18,301.8 | 0.27% |
| Deposit Insurance Fund Balance as a Percent of Insured Deposits | 1.12% | 1.10% | -1.79% |
Source: FDIC, 1987 Annual Report and Reports from FDIC Division of Finance and Division of Research and Statistics.
Notable Events
On October 19, 1987, the Dow Jones Industrial average plummeted 508 points, or 22.6 percent?the largest one-day point and percentage loss in market history. On December 3, 1987, nine banks failed, the largest number of commercial banks that had ever closed in one day. In addition, one assistance transaction occurred on that same date.
In early 1987, the Federal Savings and Loan Insurance Corporation (FSLIC) was declared insolvent as of December 31, 1986, by the General Accounting Office (GAO). In a letter to the Chairman of the Federal Home Loan Bank Board (FHLBB), Edwin J. Gray, GAO reported the following regarding the financial condition of FSLIC: “The accompanying financial statements reflect a net loss of almost $11 billion for 1986 and a deficit of more than $6 billion at the end of 1986. Troubled sectors of the savings and loan industry have placed a severe strain on the Corporation. The average size of savings and loan institutions that have failed and the number of institutions receiving financial assistance or special supervisory attention from the Corporation have steadily increased during the last several years. From December 31, 1985, to December 31, 1986, the Corporation’s caseload of institutions in serious financial trouble virtually doubled—from 93 to 183.”10-1
Economic/Banking Conditions
In 1987, Gross Domestic Product (GDP) growth and employment growth remained virtually unchanged at 2.9 percent and 2.4 percent, respectively.10-2 The unemployment rate continued to fall and was at 6.2 percent.10-3 Inflation rose slightly to 3.1 percent.10-4 Growth in the real estate market began to decline, with home sales falling 2.8 percent and housing starts falling 10.2 percent. The office vacancy rate remained just under 18 percent.10-5 The discount rate fell to 5.7 percent while the 30-year mortgage rate remained at 10.2 percent.10-6
While overall bank failures continued to rise rapidly, the number of agricultural bank failures remained steady at 58. The proportion of agricultural banks with negative net incomes also began to decrease, despite a continued decrease in farmland value per acre.10-7 Total failures in the midwest declined to 46 from 51 in 1986.
In the Southwest, the number of bank failures continued to rise. During the year, 110 banks failed in the region, and 39 percent of surviving banks had negative asset growth rates. That caused the regional average asset growth rate to be negative for the second consecutive year. Nonperforming assets peaked at 4.2 percent of assets, as did nonperforming loans at more than 10 percent of total loans and leases. Commercial vacancy rates soared in major Texas cities: Austin’s was at 40 percent; Houston’s, 31 percent; and Dallas’ was at 28 percent.10-8 Commercial real estate loans, at 8.6 percent of assets, and Commercial and Industrial (C&I) loans, at 11.6 percent of assets, continued to fall but were still above the national medians of 6.2 percent and 9 percent of assets, respectively.
The Northeast’s real estate market, however, was very healthy, especially compared to the rest of the U.S. Commercial real estate activity was booming, with the number of new permits up 100 percent from 1983 in Massachusetts, up 137 percent in Connecticut and up 87 percent in New Jersey over the same time period.10-9 The percentage of commercial real estate loans was at 12.1 percent of total assets in the region, and total real estate loans were 45.8 percent of assets. In the Northeast, average Gross State Product growth continued to increase to 5.2 percent and was well above the GDP growth rate of 2.9 percent.10-10
The California economy also was outperforming the rest of the country. In the banking sector, the “Big Four” banks (Bank of America, First Interstate, Security Pacific, and Wells Fargo) were dominating the industry. Those four banks held 72 percent of statewide assets and earned 70 percent of total income of all California banks. Commercial real estate loans continued to rise to 16 percent of assets, while C&I loans fell to 19 percent. Nevertheless, both state medians were well above the national medians of 6.2 percent of assets for commercial real estate loans and 9 percent for C&I loans.
In 1987, money center banks started to recognize the massive losses on their lesser developed countries (LDC) loans. For those banks, LDC loans were 211 percent of capital, and net income to capital was -22.2 percent. The return on assets average for large banks (banks with assets greater than $1 billion) dropped almost 40 basis points for the year. Chartering activity slowed a bit as 228 banks were chartered in the year.
On August 10, 1987, the Competitive Equality Banking Act (CEBA) was enacted. Under CEBA, qualifying agricultural banks were permitted to amortize losses over a seven-year period for agricultural loans and for losses resulting from reappraisal of other related assets, rather than having to deduct the amount of loss from capital as soon as the losses were recognized.
In November, the FDIC had adopted an interim rule establishing eligibility requirements and application procedures for banks interested in amortizing farm loan losses in distressed agricultural regions of the country. By the end of the year, 20 state nonmember banks had applied for the program: 1 had been accepted, 2 were denied, and 17 were in process.
The total number of insured commercial banks declined to 13,703 by year-end 1987, compared with 14,199 in 1986 and 14,407 in 1985. The number of problem banks peaked at 1,575, or 11.5 percent of all insured banks. In 1986, there were 1,484 or 10.5 percent problem banks, and only 1,140 or 7.9 percent problem banks in 1985.
Table 10-2 shows the number and total assets of FDIC insured institutions, as well as their profitability as of the end of 1987.
Table 10-2
Open Financial Institutions Insured by FDIC ($ in Billions)
| Commercial Banks - FDIC Regulated | |||
|---|---|---|---|
| Item | 1986 | 1987 | Percent Change |
| Number | 14,199 | 13,703 | -3.49% |
| Total Assets | $2,940.7 | $2,999.9 | 2.01% |
| Return on Assets | 0.63% | 0.10% | -84.13% |
| Return on Equity | 9.94% | 1.15% | -88.43% |
| Savings Banks – FDIC Regulated | |||
|---|---|---|---|
| Item | 1986 | 1987 | Percent Change |
| Number | 445 | 463 | 4.04% |
| Total Assets | $184.6 | $217.1 | 17.61% |
| Return on Assets | 1.04% | 0.80% | -23.08% |
| Return on Equity | 14.88% | 10.17% | -31.65% |
| Savings Associations – FHLBB Regulated | |||
|---|---|---|---|
| Item | 1986 | 1987 | Percent Change |
| Number | 3,232 | 3,159 | -2.26% |
| Total Assets | $1,202.3 | $1,285.0 | 6.88% |
| Return on Assets | 0.09% | -0.58% | -- |
| Return on Equity | 2.70% | -17.24% | -- |
Percent change is not provided if either the latest period or the year-ago period contains a negative number.
Source: Reports from FDIC Division of Research and Statistics.
Bank Failures and Assistance to Open Banks
Of the 184 bank failures in 1987, 56 (30 percent) involved agricultural banks, and of the 19 banks assisted in 1987, two were agricultural banks. Texas, Oklahoma, and Louisiana had the most failures with 50, 31, and 14, respectively. The average asset size of all failed banks was $34.1 million, and the average amount of insured deposits was $35.6 million. The total dollar amount of deposits for all failed and assisted banks in 1987 was $8.9 billion, compared to $7.2 billion in 1986 and only $8.5 billion in 1985.
Of the 184 banks that failed in 1987, 133 were resolved with purchase and assumption (P&A) transactions. Assuming banks in those transactions paid premiums of more than $52 million. The FDIC saved approximately $241 million from those transactions, compared to the cost of deposit payoffs. Insured deposit transfers (IDTs) accounted for 40 of the failed bank resolutions. The FDIC received purchase premiums totaling $33 million from the transferee banks. In 11 bank failures, the FDIC handled payoffs.
The FDIC provided open bank assistance (OBA) to prevent failures in nine cases involving 19 banks in 1987. Of the 19 banks assisted, 11 were subsidiaries of BancTexas Group, Inc., a Dallas, Texas bank holding company that collapsed. The FDIC made a one-time cash contribution of $150 million. The FDIC did not assume any of the subsidiary banks? problem assets; instead, the new investors and managers of the new holding company were to carry out their own strategies for dealing with such assets and for maintaining the subsidiary banks in sound condition. The assistance transactions resulted in an estimated savings to the FDIC of $170.4 million. The savings were estimated by calculating the cost of the assistance transactions and comparing that cost with the estimated cost had the banks failed.
During 1987, preliminary approval was given to provide financial assistance to Alaska Mutual Bank and United Bank of Alaska, both in Anchorage, Alaska, and for First City Bancorporation of Texas, Houston, Texas. The FDIC established loss reserves of $295 million for the Alaska banks and $942 million for First City Bancorporation. The assistance transactions were not consummated until early 1988 and are not included in the 19 assisted banks discussed above.
In 1987, outstanding net worth certificates were reduced by $211 million, and at the end of the year, only three banks had net worth certificates still outstanding for a total of $315 million.
In 1987, the FDIC broadened its 1986 capital forbearance guidelines, which had formerly applied only to agricultural and so called energy banks, to include any bank with difficulties primarily attributable to economic problems not within the bank?s control. Under the Capital Forbearance Program, a bank was permitted to operate temporarily with capital below normal supervisory standards, provided the bank was viable and had a reasonable plan for restoring capital. By the end of 1987, the FDIC had received 232 applications for the Capital Forbearance Program. Of the 135 banks admitted to the program, 16 were terminated for various reasons, leaving 119 banks in the program at the end of the year. Applications of 56 banks were denied, and 31 were still in process. In ten cases, the bank was closed before a decision was made on the application.
A recent estimate of losses per transaction type is shown in Table 10-3.
Table 10-3
| 1987 Estimated Losses by Transaction Type ($ in Millions) | ||||
|---|---|---|---|---|
| Transaction Type | Number of Transactions | Total Assets | Losses | Losses as a Percent of Assets |
| OBA | 19 | $2,478.1 | $160.2 | 6.46% |
| P&As | 133 | 4,431.5 | 1,160.3 | 26.18% |
| IDTs | 40 | 2,144.5 | 586.0 | 27.33% |
| Payoffs | 11 | 352.9 | 116.3 | 32.96% |
| Totals | 203 | $9,407.0 | $2,022.8 | 21.50% |
Source: Reports from FDIC Division of Research and Statistics.
In a Whole Bank Transaction, prospective bidders were invited to analyze a failing bank?s assets and submit bids to purchase essentially all of the assets ?as is? on a discounted basis. The bid provided the amount the purchaser required from the FDIC to take over the failed bank; the lowest bidder would win. The whole bank approach was regarded as advantageous by the FDIC because the impact on the local community was softened as the failing bank?s loan customers would continue to be served locally by a viable financial institution rather than by FDIC liquidators. That approach also decreased the number of assets held by the FDIC for liquidation.
In 1987, the FDIC developed a new way to handle bank failures: the ?whole bank transaction,? a new approach to the P&A transaction. A whole bank transaction was structured so that an acquiring institution purchased the maximum possible number of a failed bank?s assets, thereby relieving the FDIC of the responsibility and expense of liquidating the assets. In 1987, there were 133 P&A transactions. In 52 of those situations, the FDIC attempted whole bank transactions, of which 19 proved successful.
The 1987 CEBA also extended and expanded the FDIC?s emergency interstate acquisition authority by permitting, among other things, out-of-state holding companies to acquire qualified failing or failed stock institutions and mutual savings banks prior to failure provided the institutions had assets of $500 million or more.
CEBA gave the FDIC an important tool that would be used in the resolution of some of the largest bank failures: the authority to establish a bridge bank to assume certain deposit10-12 liabilities and to purchase certain assets of a failed bank at the discretion of the FDIC, if the following conditions were met:
A bridge bank provided a temporary solution for a failed bank. By establishing a bridge bank under FDIC control and effecting a P&A with the bridge bank and the FDIC as receiver of the failed bank, the FDIC had sufficient time to evaluate the bank’s situation and to determine an appropriate resolution. Creating a bridge bank also allowed prospective acquirers more time to assess the bank’s condition and to make a reasonable offer on the institution.
- The cost of establishing a bridge bank did not exceed the cost of liquidation;
- The continued operation of the failed bank was essential to provide adequate banking services in the local community; or
- The continued operation of the failed bank was in the best interest of the depositors and the public.
Just two months after the passage of CEBA, the FDIC used its new bridge bank authority for the first time with the closing of Capital Bank & Trust Company, Baton Rouge, Louisiana, on October 30, 1987. Capital Bank & Trust Company had total assets of $384.4 million at the time of its failure. The FDIC determined that a bridge bank was the most cost-effective way to preserve existing banking services while giving the FDIC sufficient time to put together a permanent transaction. Pursuant to CEBA, the bridge bank was chartered as a national bank, Capital Bank & Trust Co., N.A., and a five-member board of directors was appointed by the FDIC. By the end of 1987, the FDIC was actively seeking an acquirer for the bridge bank.
Payments to Depositors and Other Creditors
In the 203 banks that failed or were assisted in 1987, deposits totaled $8.9 billion in 1,317,000 deposit accounts. Nineteen assistance agreements contained $2.3 billion in total deposits in over 348,700 deposit accounts. Eleven payoffs accounted for $348.7 million in 42,000 deposit accounts. Dividends paid on all active receiverships totaled $755.8 million in 1987.
Of the 1,216 insured bank failures10-13 since the FDIC began operations in 1934, 687 were P&A transactions, with 19 additional resolutions involving whole bank transactions. Deposit payoff transactions accounted for 464 cases, of which 80 were IDTs. There have been 46 open bank assistance transactions since 1981.
Total disbursements by the FDIC since January 1, 1934, amounted to $31.2 billion. Of that amount, the FDIC recovered $20.4 billion, for a net loss of $10.8 billion.
Asset Disposition
At the beginning of 1987, the FDIC had $10.9 billion in assets from failed banks. The FDIC handled 184 bank closings and acquired $5.1 billion in liquidation assets. Principal collections amounted to $2.6 billion. At the end of 1987, assets in liquidation totaled $11.3 billion.
In 1987, the FDIC produced a national publication for investors that contained a list of large ($500,000 or greater) commercial real estate properties owned by the FDIC; the publication included detailed information on each parcel. The FDIC asset marketing staff closed an unprecedented 574 sales of approximately 91,000 loans with an aggregate book value of $860 million. That was nearly triple the 196 sales with an aggregate book value of $342 million completed in 1986. While most of the loan sales were completed through a sealed bid process, the FDIC also began experimenting with selling loans at public auction.
In 1987, the FDIC developed an automated program to assist asset marketing efforts that automatically selected loans from the FDIC?s mainframe and put the loans into sale packages with specific, predetermined parameters. Performing loans were priced by the system; nonperforming loans were priced individually by FDIC account officers working the loans.
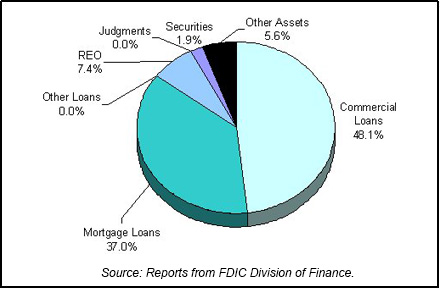
Table 10-4 shows the FDIC?s assets in liquidation and Chart 10-1 shows the asset mix.
Table 10-4
| 1987 FDIC End of the Year Assets in Liquidation ($ in Billions*) | ||||||
|---|---|---|---|---|---|---|
| Asset Type | 12/31/86 Book Value | 1986 Assets Acquired | 1986 Prin. Coll. | 1986 Write Downs | 12/31/86 Book Value | 12/31/86 Est. Rec. Value |
| Commercial Loans | $7.4 | $2.1 | $1.4 | $1.3 | $6.8 | $2.6 |
| Mortgage Loans | 1.4 | 1.1 | 0.4 | 0.2 | 1.9 | 1.0 |
| Other Loans | 0.5 | 0.3 | 0.2 | 0.1 | 0.5 | |
| Real Estate Owned | 0.5 | 0.5 | 0.2 | 0.2 | 0.6 | 0.4 |
| Judgments | 0.5 | 0.2 | 0.0 | 0.2 | 0.5 | |
| Securities | 0.1 | 0.3 | 0.2 | 0.0 | 0.2 | 0.1 |
| Other Assets | 0.5 | 0.6 | 0.2 | 0.1 | 0.8 | 0.3 |
| Totals | $10.9 | $5.1 | $2.6 | $2.1 | $11.3 | $4.4 |
Source: Reports from FDIC Division of Finance.
Insurance Fund and Staffing
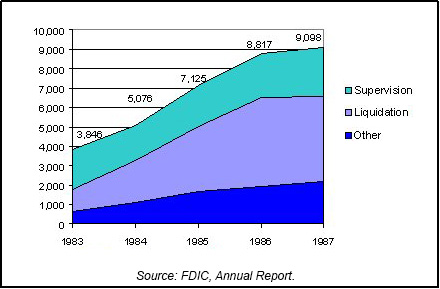
The insurance fund peaked in 1987 at $18.3 billion. FDIC staffing efforts were focused mainly on bringing the Division of Bank Supervision (DBS) up to full strength. By the end of the year, the FDIC employed 1,909 field examiners, with 421 new examiners hired in 1987. Total DBS staff was 2,521, an increase of 222 over 1986. The Division of Liquidation staff numbered 4,400, compared to 4,586 in 1986. The FDIC had more than 400 attorneys. Total staff for the FDIC in 1987 was 9,098, up 281 from 8,817 in 1986. Chart 10-2 shows the staffing levels for the past five years.
Thrifts
In 1987, FSLIC conducted 17 liquidations and 30 Assisted Mergers for an estimated total cost of $3.7 billion. By the end of the year, there also had been five Supervisory Mergers. There were 25 thrifts in the Management Consignment Program, and the FSLIC fund balance was at a negative $13.7 billion. In August 1987, CEBA established a capital ratio floor of 0.5 percent for troubled but well-managed institutions whose problems resulted from economic conditions beyond their control. In February 1987, FHLBB announced it was unlikely that the Board would take administrative action to enforce minimum capital requirements. At the end of the year, FHLBB estimated a present value cost of $22.7 billion to resolve thrifts in the FSLIC caseload at that time, in addition to some thrifts in the Southwest and an allowance for 300 insolvent thrifts not in the caseload. In early 1987, the GAO declared the FSLIC insurance fund insolvent as of December 31, 1986.
The Federal Asset Disposition Association?s (FADA) costs outpaced revenues; in 1986 FADA lost nearly $3.5 million. In the first three quarters of 1987, it lost almost $6 million. In late 1987, FADA?s Chief Operating Officer resigned.
10-1 Charles A. Bowsher, Comptroller General of the United States, in a letter dated May 1, 1987, as presented in a Federal Home Loan Bank Board 1986 Annual Report. Back to text
10-2 Bureau of Economic Analysis
and CB Commercial Torto/Wheaton Research. Back to text
10-3 Bureau of Labor Statistics,
Department of Labor. Back to text
10-4 Bureau of Labor Statistics,
Department of Labor. Back to text
10-5 Housing Market Statistics,
National Association of Home Builders (June 1996), and CB Commercial Torto/Wheaton Research. Back to text
10-6
Housing Market Statistics, National Association of Home Builders (June 1996), and Federal Home Loan Mortgage Corporation. Back to text
10-7
Economic Research Service, U.S. Department of Agriculture. Back to text
10-8 CB Commercial Torto/Wheaton Research. Back to text
10-9 Bureau of the Census, Building Permits Section, Manpower and Construction Statistics Branch. Back to text
10-10 Bureau of Economic Analysis, Department of Commerce. Back to text
10-11 In 1989, this statute was amended to allow three one-year extensions. Back to text
10-12 In 1989, this statute was amended to allow FDIC to assume all deposits or insured deposits only. Back to text
10-13 This figure does not include five open bank assistance transactions from 1934-1980. Back to text
Table of Contents