
Managing the Crisis: The FDIC and RTC Experience — Chronological Overview
Chapter Eight: 1985
Newly appointed FDIC Chairman, L. William Seidman, reflected on his position in the 1985 annual report as follows: “When I became Chairman in October, the FDIC was in the midst of another year of record levels of problem and failed banks…These problem and failed banks substantially increased the workload in all areas of the FDIC.”
Table 8-1
| 1984 - 1985: FDIC at a Glance ($ in Millions) | |||
|---|---|---|---|
| 12/31/84 | 12/31/85 | Percent Change | |
| Number of Bank Failures |
78 | 116 | 48.72% |
| Assistance to Open Banks | 2 | 4 | 100.00% |
| Total Failed and Assisted Banks | 80 | 120 | 50.00% |
| Total Assets of Failed and Assisted Banks | $43,432.5 |
$8,977.3 | -79.33% |
| Losses on Failed and Assisted Banks | $1,640.2 | $1,007.2 | -38.59% |
| Losses as a Percent of Total Assets | 3.78% | 11.22% | 196.83% |
| Assets in Liquidation | $10,299.8 | $9,731.3 | -5.52% |
| FDIC Staffing | 5,076 | 7,125 | 40.37% |
| Number of Problem Banks | 848 | 1,140 | 34.43% |
| Deposit Insurance Fund Balance | $16,529.4 | $17,956.9 | 8.64% |
| Deposit Insurance Fund Balance as a Percent of Insured Deposits | 1.19% | 1.19% | 0.00% |
Source: FDIC, 1985 Annual Report and Reports from FDIC Division of Finance and Division of Research and Statistics.
Notable Events
Seven banks failed on May 31, 1985, the largest number of insured banks ever to close in one day (up to that date). L. William Seidman was appointed chairman of the FDIC on October 21, 1985. Prior to his appointment to the FDIC, Mr. Seidman had an extensive career in the financial arena in both the private and public sectors.
Economic/Banking Conditions
In 1985, the Gross Domestic Product growth of 3.7 percent was not as strong as the previous year’s 6.8 percent growth.8-1 Employment growth also slowed a bit, with a 3.9 percent increase.8-2 The unemployment rate and inflation held steady at 7.2 percent and 3.6 percent, respectively.8-3 Interest rates fell after the slight increases in 1984, to a discount rate of 7.7 percent and a 30-year mortgage rate of 12.4 percent.8-4 Home sales were up 10.2 percent while the number of housing starts held steady. The office vacancy rate continued to increase to 16.5 percent with the expansion of commercial real estate markets around the country.8-5
Economic conditions continued to get worse for the Southwest and its banking industry. A recession began in the agricultural industry. Southwest bank failures more than doubled to 29 for the year. Agricultural bank failures peaked at 62 for the year. Those failures were primarily concentrated in Midwestern states with agriculturally dependent economies that had experienced farmland price declines of as much as 49 percent in some areas. Midwest bank failures hit a peak, nearly doubling the 1984 total, to 56 for the year.
Despite the number of agricultural bank failures, losses to the deposit insurance fund were relatively low since those institutions were relatively small. Deposit insurance fund losses in 1985 were the lowest for the period 1982-1990, totaling approximately $1 billion, an average of just $8.4 million per bank.
Late in the year, oil prices dropped sharply, to $25 a barrel.8-6 As a result, the oil industry in the Southwest continued to experience hardships. Conversely, construction in the real estate market was still booming. In Austin, Texas, the value of new permits for 1985 to 1987 was nearly double the value only a few years earlier. However, demand for real estate was not keeping up with the supply, as office vacancy rates in the region’s major cities continued to increase steadily.8-7 There was an increase in total real estate loans for the region, reaching the national median. There continued to be drastic increases in commercial real estate loans to 8.3 percent of assets, well above the national median of 5.2 percent of assets. The year 1985 marked the beginning of a steady decline in Commercial and Industrial (C&I) loans for the region after the upsurge during the early 1980s.
In the Northeast, housing prices continued to rise, including home prices in Boston, Massachusetts, which rose 34 percent over the preceding year.8-8 Lending also increased, with a concentration in real estate loans, both commercial and residential. C&I loans fell to 7.8 percent of assets after holding steady for four years at around 9.3 percent. The national median was 10.4 percent of assets during that period.
California also experienced an upward trend in real estate lending, with commercial real estate loans increasing to around 13 percent of assets and C&I loans increasing to 21.9 percent of assets, both well above the national medians of 5.2 percent and 10.4 percent of assets, respectively. The banking market was also experiencing an upward trend; over the preceding five years there were 272 newly chartered banks in California alone.
The number of new bank charters dropped to 344 from 402 in 1984. The FDIC, the Office of the Comptroller of the Currency, and the Federal Reserve set a common capital requirement that covered all banks. Agricultural banks continued a downward slide that had become quite marked during the latter part of 1984. Although comprising only 27 percent of all FDIC insured institutions, agricultural banks accounted for 53.5 percent (62 of 116) of commercial bank failures, and by the end of 1985, accounted for approximately 37 percent of the banks on the FDIC's problem bank list. The number of problem banks rose to 1,140 from 848 in 1984.
Table 8-2 shows the number and total assets of FDIC insured institutions, as well as their profitability as of the end of 1985.
Table 8-2
Open Financial Institutions Insured by FDIC ($ in Billions)
| Commercial Banks - FDIC Regulated | |||
|---|---|---|---|
| Item | 1984 | 1985 | Percent Change |
| Number | 14,483 | 14,407 | -0.52% |
| Total Assets | $2,508.9 | $2,730.7 | 8.84% |
| Return on Assets | 0.64% | 0.69% | 7.81% |
| Return on Equity | 10.40% | 11.07% | 6.44% |
| Savings Banks – FDIC Regulated | |||
|---|---|---|---|
| Item | 1984 | 1985 | Percent Change |
| Number | 268 | 364 | 35.82% |
| Total Assets | $136.5 | $157.4 | 15.31% |
| Return on Assets | 0.07% | 0.74% | 957.14% |
| Return on Equity | 1.37% | 13.08% | 854.74% |
| Savings Associations – FHLBB Regulated | |||
|---|---|---|---|
| Item | 1984 | 1985 | Percent Change |
| Number | 3,150 | 3,262 | 3.56% |
| Total Assets | $1,008.7 | $1,105.3 | 9.58% |
| Return on Assets | 0.11% | 0.42% | 281.82% |
| Return on Equity | 3.81% | 14.14% | 271.13% |
Source: Reports from FDIC Division of Research and Statistics.
Bank Failures and Assistance to Open Banks
By the end of the year, 116 banks had failed. There were also two open bank assistance agreements and two assisted mergers of mutual savings banks. Total deposits from all failed banks (including assisted mergers) amounted to $8.5 billion in 1985, compared with only $2.7 billion in 1984, exclusive of Continental Illinois National Bank and Trust Company (Continental). The states with the most failures were Kansas, Oklahoma, and Nebraska, each with 13; Texas and Iowa followed with 12 and 11, respectively.
Purchase and assumption (P&A) transactions were used in 87 of the bank failures of 1985. The FDIC performed insured deposit transfers (IDTs) in seven of the failed banks; in one of those, the FDIC made an advance dividend payment of 50 percent to uninsured depositors and other creditors. The FDIC conducted payoffs for 22 bank failures. In four of the payoffs, the FDIC made advance dividend payments ranging from 45 percent to 50 percent of claims to uninsured depositors and other creditors.
Two mutual savings banks, Bowery Savings Bank (Bowery), New York City, New York with $5 billion in deposits and Home Savings Bank, White Plains, New York, with $405 million in deposits, were assisted under the Voluntary Merger Plan. In the most noteworthy case, Bowery, the FDIC formed a financial assistance package to recapitalize the bank and to facilitate its acquisition by a private investor group. The Bowery assistance package began in 1984 with a competitive, nationwide bidding process, in which FDIC insured institutions and other parties were invited to submit proposals to acquire Bowery. An investor group submitted the winning proposal, which included a $100 million equity contribution by the investors and the installation of a new management team. Bowery was merged into a newly chartered stock savings bank that retained the Bowery name. A payoff of the bank's insured deposits would have cost the FDIC an estimated $620 million, based on the Bowery's negative book capital and the market depreciation in its asset portfolio.
The FDIC also provided open bank assistance (OBA) to two commercial banks during 1985 to prevent their failures and facilitate their mergers with sound institutions. The two failing banks were Bank of Oregon, Woodburn, Oregon, and The Commercial Bank, Andalusia, Alabama.
The Net Worth Certificate Program was due to expire on October 15, 1985, but Congress extended the program to July 15, 1986. By the end of 1985, the FDIC's Net Worth Certificate Program included 21 institutions with aggregate certificates outstanding totaling $705.4 million.
A recent estimate of losses per transaction type is shown in Table 8-3.
Table 8-3
| 1985 Losses by Transaction Type ($ in Millions) | ||||
|---|---|---|---|---|
| Transaction Type | Number of Transactions | Total Assets | Losses | Losses as a Percent of Assets |
| OBA | 4 | $5,886.4 | $359.0 | 6.10% |
| P&As | 87 | 2,465.7 | 535.6 | 21.72% |
| IDTs | 7 | 315.1 | 33.9 | 10.76% |
| Payoffs | 22 | 310.1 | 78.7 | 25.38% |
| Totals | 120 | $8,977.3 | $1,007.2 | 11.22% |
Source: Reports from FDIC Division of Research and Statistics.
Payments to Depositors and Other Creditors
In the 120 banks that failed or were assisted in 1985, deposits totaled $8.5 billion in 1,254,567 deposit accounts. Bowery alone held $5 billion in 637,676 deposit accounts. Institutions for the remaining three assistance agreements held $578.4 million in deposits in 94,478 deposit accounts. The 22 payoff transactions accounted for 45,977 deposit accounts and $287.7 million in total deposits.
Of the 868 insured bank failures 8-9 since the FDIC began operations in 1934, P&A transactions totaled 475 cases, and there were 373 deposit payoffs, including 21 IDTs. The FDIC has also provided assistance to 20 troubled financial institutions to prevent their failures since 1981.
Total disbursements by the FDIC since January 1, 1934, amounted to $15.7 billion. Of that amount, the FDIC recovered $11 billion for a net loss of $4.7 billion.
Asset Disposition
At the beginning of 1985, the FDIC had $10.3 billion in assets from failed institutions. Despite handling the failures of 116 commercial banks with total assets of $3.1 billion during the year, the FDIC managed to end the year with total failed bank assets in liquidation of $9.7 billion.
Approximately one-half of the bank failures in 1985 were agricultural banks, which meant that many of the assets acquired for liquidation were farm loans and agriculture-related collateral. At first, the FDIC's disposition manual did not cover those types of credits. Therefore, the FDIC developed an agricultural credit manual describing the planting and harvesting process that addressed the cyclical nature of farm borrowings. The depressed agricultural economy in 1985 made it necessary for FDIC employees to quickly learn the very specialized area of agricultural loans and credits.
In 1985, the FDIC developed a nationwide automated asset marketing system with a database containing information on all marketable assets acquired by the FDIC as receiver. The FDIC also developed an automated investor profile list, which included local, regional, and national investors known to the FDIC, along with the types of assets each wanted to purchase and the corresponding cost range.
In the previous year, 1984, the FDIC had entered into a contract with a national mortgage servicer to handle quality mortgage loans acquired from failed banks. That contract provided centralized servicing and enhancement of loan marketability and pricing. Under the arrangement, the FDIC sold approximately $100 million in mortgage-backed securities through its servicer. That was the FDIC's first major bulk sales effort.
In the fourth quarter of 1985, the Atlanta Regional Office conducted the first sale of nonperforming loans. It was a small sale conducted under regional authority, with an approximate value of $1 to $2 million. Previously, the FDIC would only negotiate with borrowers for settlement of nonperforming loans rather than offering the loans for sale on the open market.
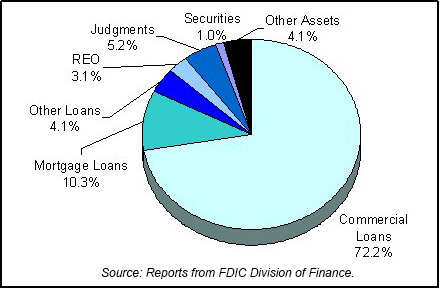
Table 8-4 shows the FDIC's assets in liquidation and Chart 8-1 shows the asset mix.
Table 8-4
| 1985 FDIC End of the Year Assets in Liquidation ($ in Billions |
|||
|---|---|---|---|
| Asset Type | 12/31/84 Book Value | 12/31/85 Book Value | 12/31/85 Estimated Recovery Value |
| Loans | $7.7 | ||
| Commercial Loans | $7.0 | $5.5 | |
| Mortgage Loans | 0.9 | 1.0 | 0.4 |
| Other Loans | 0.4 | ||
| Real Estate Owned | 0.3 | 0.3 | 0.8 |
| Charge-Offs | 0.3 | ||
| Investments | 0.3 | ||
| Judgments | 0.5 | ||
| Securities | 0.1 | 0.1 | 0.1 |
| Other Assets | 0.4 | 0.2 | |
| Other Assets/Judgments | 0.7 | ||
| Totals | $10.3 | $9.7 | $7.0 |
Source: Reports from FDIC Division of Finance.
Insurance Fund and Staffing
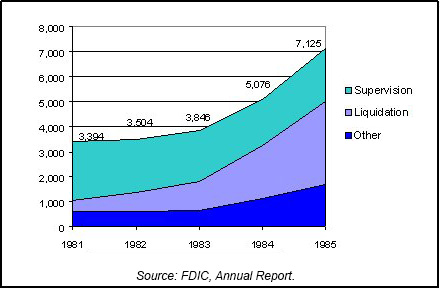
At the end of 1985, the fund was $18 billion. The fund's reserve for losses was increased to $2.3 billion, raising total reserves to $4.5 billion, including a loss allowance of $1.3 billion for the 1984 assistance agreement with Continental. By the end of 1985, the FDIC had 7,125 employees, up 2,049 from 1984, due primarily to the hiring of temporary employees, who represented nearly 46 percent of the FDIC's staff. Division of Liquidation had 3,318 employees, an increase of 1,160 over 1984, while Division of Bank Supervision staff totaled 2,123, up from 1,800. Chart 8-2 shows the staffing levels for the past five years.
Private Resolutions
The year 1985 proved to be disastrous for privately insured savings institutions in Ohio and Maryland. Seventy-one state chartered savings and loan institutions, about one fourth of Ohio thrifts, were insured by the Ohio Deposit Guarantee Fund (ODGF), a private insurance cooperative. In March of 1985, the ODGF became insolvent after the following series of events:
- ESM Government Securities, Ft. Lauderdale, Florida, was closed amidst fraud allegations on March 4, 1985.
- Home State Savings Bank (Home State), Cincinnati, Ohio?the largest ODGF member with 19 percent of ODGF insured deposits—lost about $545 million on ESM repurchase agreements.
- Publicity surrounding Home State's loss, in turn, caused a depositor run that exceeded $150 million by March 8, 1985.
- On March 9, 1985, Home State was declared insolvent, setting off a panic among depositors of other ODGF member thrifts.
- On March 13, 1985, the state legislature established a new deposit insurance fund for ODGF institutions other than Home State. The state provided $50 million for the fund, but continuing heavy deposit outflows caused the Governor of Ohio to declare a bank holiday two days later, closing all ODGF insured thrifts.
- On March 20, 1985, legislation was enacted by the state to require the closed thrifts to obtain federal deposit insurance; only those institutions deemed likely to get insurance from the FDIC or the Federal Savings and Loan Insurance Corporation (FSLIC) were allowed to reopen. Other ODGF institutions were allowed to partially reopen, permitting limited withdrawals of only $750 per month.
- On May 21, 1985, the Ohio state legislature passed a bill providing $135 million to cover ODGF losses.
Ultimately, all ODGF insured depositors did get back their deposits. The 70 ODGF institutions were resolved as follows:
- Thirty-five obtained FSLIC insurance
- Ten obtained FDIC insurance,
- Thirteen (including Home State) were acquired by healthy banks with federal insurance,
- Eight were merged into other savings and loan institutions with federal insurance,
- Three were merged into banks with FDIC insurance, and
- One was liquidated.8-10
According to officials of the Maryland Deposit Insurance Fund Corporation, successor to the Maryland Savings Share Insurance Corporation (MSSIC), the March 1985 events in Ohio, coupled with the telecast of a story on “60 Minutes” concerning the failure of an uninsured private bank in Nebraska, caused a “silent run” on deposits at thrifts insured by MSSIC.8-11 In April, federal officials warned the Governor of Maryland that MSSIC institutions had lost $375 million in deposits over the previous two months. In May 1985, the public announcement of a criminal investigation at Merritt Commercial Savings and Loan (Merritt), Baltimore, Maryland, and newspaper publicity generated by problems at Old Court Savings and Loan (Old Court), Baltimore, Maryland, caused depositor runs. Merritt lost $3 million in deposits on a Saturday morning, and four days later a conservator was appointed for Old Court.
On May 14, a withdrawal limit of $1,000 per month for all MSSIC insured institutions was imposed by the Governor of Maryland, although exemptions were later allowed for hardship cases, such as mortgage payments and payroll payments. The state ultimately assumed responsibility for all MSSIC insured deposits, and all insured depositors were paid. The final payment was made to insured depositors in November 1989.8-12 The Maryland state legislature authorized the issuance of $100 million in state bonds by the Maryland Deposit Insurance Fund Corporation to pay for the state’s backing.
Both the Ohio Deposit Guarantee Fund and the Maryland Savings Share Insurance Fund were declared insolvent in 1985. Both states' governments passed regulations providing that no member institution could reopen (or remain open as the case may be) without obtaining federal insurance. Several depositors were harmed by the limitations on withdrawals of depositor funds. That practice was in sharp contrast to the way the FDIC handled depositor funds. The FDIC had more resources to pay all depositors up to the insured limits and then recoup the funds through asset liquidation afterwards. The state funds proved to lack the liquidity to withstand a large concentration of failures.
Thrifts
The FSLIC generally tried to dispose of an entire thrift through a sale or merger, without retaining any assets to manage. As resolutions became more difficult due to deteriorating asset quality, FSLIC became the owner of a huge volume of complex problem assets that acquirers did not want. Unable to increase the size of its staff or to hire personnel with the desired expertise, FSLIC began contracting with private sector firms in 1984 and 1985 to provide the needed expertise and services to manage and dispose of those assets. Also, FSLIC established its own “thrift” to manage and liquidate assets of failed institutions; the thrift was named the Federal Asset Disposition Association (FADA).
The Federal Asset Disposition Association (FADA) was created by the Federal Home Loan Bank Board on November 1, 1985. FADA operated as a special purpose, privately held stock corporation, with FSLIC as its only client. FADA's private status enabled it to compete with the private sector in hiring highly skilled professionals. FADA's quasi-government status also exempted it from the disclosure rules of the Freedom of Information Act and other regulatory provisions that would have made FADA more accountable to Congress and the public
The FSLIC's Management Consignment Program was initiated in April 1985 as an interim resolution method to gain control of insolvent thrifts with questionable managements. The assets and liabilities of insolvent thrifts were transferred to institutions with de novo mutual charters using a “pass-through receivership.” The insolvent thrift's board of directors and senior management were removed. FSLIC appointed a new board of directors and hired a new management team, usually by contracting with a healthy institution to provide management services. The new management team was paid based on a flat fee or fixed salary plus expenses with no equity incentives. The program functioned much like a regulatory conservatorship, except that FSLIC contracted management from private industry.
By the end of 1985, 8 liquidations and 23 Assisted Mergers had occurred, which cost FSLIC a total of slightly more than $1 billion. There were also 10 Supervisory Mergers. The FSLIC fund balance had decreased from $5.6 billion to $4.6 billion. The Federal Home Loan Bank Board estimated $1.6 billion as a contingent liability for problem thrifts that would likely require financial assistance in the near term. That estimate did not project the cost of resolving all future problem thrifts.
8-1 Bureau of Economic Analysis, Department of Commerce. Back to text
8-2 CB Commercial Torto/Wheaton Research. Back to text
8-3 Bureau of Labor Statistics, Department of Labor. Back to text
8-4 Housing Market Statistics, National Association of Home Builders (June 1996), and Federal Home Loan Mortgage Corporation. Back to text
8-5 Housing Market Statistics, National Association of Home Builders (June
1996), and CB Commercial Torto/Wheaton Research. Back to text
8-6 “As Oil Prices Continue to Slide, Texas Banks Confront a Grim ’86: Further Deterioration Expected in Energy and Real Estate Lending,” American Banker, February 11, 1986, 2. Back to text
8-7 CB Commercial Torto/Wheaton Research. Back to text
8-8 National Association of Realtors. Back to text
8-9 This figure does not include five open bank assistance transactions from 1934-1980. The FDIC did not begin including assistance agreements with the failures for reporting purposes until 1981. Five assistance agreements, with total deposits of $6.8 billion, should be included in the overall totals. Back to text
8-10 William B. English, “The decline of private deposit insurance in the United States,” (Carnegie-Rochester Conference Series on Public Policy, 1993), 68-69, 115-116. Back to text
8-11 Private interview held August 2, 1995, with representatives of the Maryland Deposit Insurance Fund Corporation, successor to the Maryland Savings Share Insurance Corporation conducted by FDIC personnel. Back to text
8-12 English, “The decline of private deposit insurance in the United States,” 70, 116-119. Back to text
Table of Contents