
Managing the Crisis: The FDIC and RTC Experience — Chronological Overview
Chapter Twenty-Three: 2000
The year 2000 may well be remembered as a watershed in the history of the FDIC. The Corporation undertook a comprehensive review of the deposit insurance system with an eye toward addressing its weaknesses.
Table 23-1
| 1999 - 2000: FDIC at a Glance ($ in Millions) | |||
|---|---|---|---|
| 12/31/99 | 12/31/2000 | Percent Change | |
| Number of Bank Failures |
8 | 7 | -12.50% |
| Total Assets of Failed and Assisted Banks | $1,592.2 | $414.5 | -73.97% |
| Estimated Losses on Failed and Assisted Banks |
$831.5 | $37.3 | -95.51% |
| Estimated Losses as a Percent of Total Assets | 52.22% | 9.00% | -82.77% |
| Assets in Liquidation | $1,981.5 | $535.5 | -72.98% |
| FDIC Staffing | 7,266 | 6,452 | -11.20% |
| Number of Problem Financial Institutions | 79 | 94 | 18.99% |
| Bank Insurance Fund Balance | $29,414.2 | $30,975.2 | 5.31% |
| Bank Insurance Fund Balance as a Percent of Insured Deposits | 1.36% | 1.35% | -0.74% |
| Savings Insurance Fund Balance | $10,280.7 | $10,758.6 | 4.65% |
| Savings Insurance Fund Balance as a Percent of Insured Deposits | 1.45% | 1.43% | -1.38% |
Source: FDIC, 2000 Annual Report and Reports from FDIC Division of Finance and Division of Research and Statistics.
Notable Events
- The FDIC began a major study of its deposit insurance system in order to offer a constructive framework for change to better promote macroeconomic stability, fairness, and appropriate economic incentives for the banking and thrift industries. The FDIC believes the recommendations for deposit insurance reform developed during the year will provide a sound basis for helping the agency achieve it mission, more effectively and more fairly, for years to come.
- One core recommendation from the FDIC to Congress was to resume operating one insurance fund by merging the Bank Insurance Fund (BIF) and the Savings Association Insurance Fund (SAIF).
- Other FDIC recommendations were:
- Sharp premium swings triggered by deviations from the Designated Reserve Ratio should be eliminated. If the fund falls below a target level, premiums should gradually increase. If it grows above the target level, funds should gradually be rebated.
- The current statutory restrictions on the FDIC's ability to charge risk-based premiums to all institutions should be eliminated; the FDIC should charge regular premiums for risk regardless of the level of the fund.
- Rebates should be based on past contributions to the fund, not the current assessment base.
- The deposit insurance coverage limit should be indexed to keep pace with inflation.
- In May, the Corporation and the Financial Stability Institute co-hosted a seminar on the above issues and drew approximately 150 people from more than 60 countries as part of the FDIC-sponsored global efforts to establish or improve deposit insurance systems.
- In 2000, the Corporation undertook several safety and soundness initiatives to address emerging risks. It also developed contingency plans for the failure of a very large institution, and the failure of an Internet institution.
- By year-end 2000, the FDIC had established the Electronic Banking Branch in its Division of Supervision and trained bank examiners and similar specialists nationwide in electronic banking.
Economic/Banking Conditions
The U.S. economy continued to set new records for the longevity of this peace-time expansion and the economy showed remarkable strength, as GDP grew by 6.5 percent. Unemployment reflected this hearty pace of economic activity, declining 10 basis points to a phenomenal 4 percent. Office vacancies fell by 100 basis points to 8.3 percent. Rounding out the year's positive economic news was a 48 basis-point decline in interest on 30-year mortgages, to 7.58 percent.
Fueled primarily by a sharp spike in both oil and natural gas prices, inflation rose to 3.5 percent, the highest level in several years—but nonetheless quite modest by historic standards. This inflation scare helped to prompt an increase of 100 basis points in the discount rate—from 5 percent to 6 percent. This shift toward tightening the discount rate may have contributed to the 4.4 percent decline in housing starts experienced during 2000. New home sales remained virtually consistent with the 1999 level, declining by an imperceptible 30 basis points.23-1
For most financial institutions, the returns on assets and equity fell during the year. Even though, the asset growth rate for commercial banks went from 5.4 percent to 8.8 percent. Commercial banks' total net income decreased 2 percent to $69.8 billion. The decline in profitability was due mainly to the continued narrowing of net interest margins, an increase in loan-loss provisions, and the slowed growth of non-interest income. Banks had a strong first quarter, but some institutions experienced large restructuring charges in the second quarter. A total of 605 banks reported negative income. However, this was down from 1999, which had 658 banks experiencing negative income. Holdings of securities expanded 6.4 percent; largely attributed to the increase in trading accounts. Growth of securities in investment accounts did not rise (due to the fact that holdings in U.S. Treasury securities had a record drop). Equity capital rose 10.5 percent.
Overall, loans expanded in 2000. Commercial and Industrial loans grew 12.9 percent during the first half of the year; but slowed to 2.9 percent during second half because of variety of reasons. On the demand side, there was a reduced need for credit. On the supply side, commercial banks tightened lending standards. The growth rate for commercial real estate loans slowed to 12.1 percent. Consumer loans rose by 8.7 percent and home equity loans increased by 24.6 percent.
Core deposits increased by 7.5 percent. This can partly be explained by the falling equity prices and economic uncertainty which increases the incentive to hold liquid bank assets. Managed liabilities expanded at a slower rate than the previous year (at 8.8 percent down from 15.5 percent pace in 1999). Over 70 percent of the industry assets were held by the top 100 largest banks. Fleet Bank and BankBoston combined to create the nation’s fourth largest bank (resulting in the 10 largest banks controlling 38 percent of assets).23-2
For the fifth year in a row, the number of financial institutions dropped. Overall, 9,923 financial institutions were in operation at the end of 2000. The number of banks on the problem bank list increased from 79 banks to 94.23-3
Table 23-2 shows the number and total assets of FDIC insured institutions, as well as their profitability as of the end of 1999.
Table 23-2
Open Financial Institutions Insured by FDIC ($ in Billions)
| BIF Members | |||
|---|---|---|---|
| 1999 | 2000 | Percent Change | |
| Number | 8,835 | 8,572 | -2.98% |
| Total Assets | $5,980.1 | $6,510.7 | 8.87% |
| Return on Assets | 1.29% | 1.18% | -8.53% |
| Return on Equity | 15.11% | 13.86% | -8.27% |
| SAIF Members | |||
|---|---|---|---|
| Item | 1999 | 2000 | Percent Change |
| Number | 1,387 | 1,332 | -3.97% |
| Total Assets | $903.5 | $952.2 | 5.39% |
| Return on Assets | 0.99% | 0.89% | -10.10% |
| Return on Equity | 11.97% | 11.12% | -7.10% |
| US Branches of Foreign Banks | 20 | 19 | -5.00% |
Source: FDIC Quarterly Banking Profile, Fourth Quarter 2003.
Bank Failures
During 2000, seven FDIC-insured institutions failed. Six of those institutions were insured by the BIF and one was insured by the SAIF. The failed institutions had combined assets of approximately $414.5 million. Losses for the seven failures are estimated at $37.3 million. All resolutions involved purchase and assumption agreements.
In 2000, the FDIC conducted its first teleconference with prospective acquirers for a failed bank at five locations across the country. With the failure of Bank of Honolulu, Honolulu, Hawaii, it was not economically feasible to conduct an information meeting in Hawaii. Marketing specialists set up video teleconferences in San Francisco, Chicago, Dallas, New York and Washington, D. C., with the main presentation held in Dallas. The result was several competitive bids received and a successful resolution consummated.
A more recent estimate of losses per transaction type is shown in Table 23-3.
Table 23-3
| 2000 Estimated Losses by FDIC Transaction Type ($ in Millions*) | ||||
|---|---|---|---|---|
| Transaction Type | Number of Transactions | Total Assets | Estimated Loss* as of 12/31/03 | Estimated Losses as a Percent of Assets |
| P&As | 7 | $414.5 | $37.3 | 9.00% |
Source: Reports from FDIC Website ? Historical Statistics on Banking.
Payments to Depositors and Other Creditors
In the seven financial institutions that failed in 2000, deposits totaled $343.9 million in 39,250 deposit accounts. Dividends paid on all active receiverships totaled almost $1.7 billion in 2000.
There have been a total of 2,211 insured financial institution resolutions since the FDIC began operations in 1934. Of this total, 1,467 were PA transactions, 141 were open bank assistance transactions, and 603 were deposit payoff transactions.
Total disbursements by the FDIC since January 1, 1934, have amounted to $108.4 billion. Of that amount, actual and projected recoveries are anticipated to be approximately $70.3 billion, which equates to a projected loss of $38.1 billion to the BIF/SAIF funds.
Asset Disposition
At the beginning of 2000, the FDIC held $2 billion in assets from failed institutions. That included $1.5 billion in BIF assets, $10 million in SAIF assets, $42 million in FSLIC Resolution Fund (FRF) assets, and $467 million in Resolution Trust Corporation (RTC) assets. During the year, the FDIC acquired an additional $407.6 million in assets from six bank failures and one thrift failure. The FDIC collected $604 million during the year,23-4 and the ending balance for assets in liquidation was $535.5 million, a reduction of $1.4 billion. Of the $535 million, $226.2 million was assets in liquidation for BIF, $8.1 million for SAIF, $28.3 million for FRF, and $272.9 million for RTC.
During 2000, the FDIC sold real estate properties for a total of $15 million, yielding a recovery of 79 percent of average appraised value. More than 11,584 loans and other assets totaling $337 million in book value were sold through asset marketing efforts, with net sales proceeds during 2000 representing 132 percent of appraised value.
Asset Marketing conducted its first sale of financial assets over the Internet, with approximately $12.3 million of loans at a recovery that was 16 percent higher than expected.
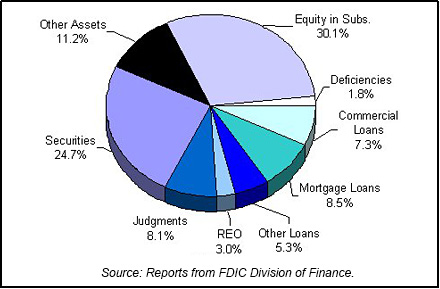
Table 23-4 shows the FDIC's assets in liquidation and Chart 23-1 shows the asset mix.
Table 23-4
| 2000 FDIC End of the Year Assets in Liquidation ($ in Billions*) | |||||||
|---|---|---|---|---|---|---|---|
| Asset Type | 12/31/99 Book Value | 2000 Assets Acquired | 2000 Asset Adj. | 2000 Coll. & Write Downs | 12/31/00 Book Value | 12/31/00 Est. Rec. Value | |
| Commercial Loans | $87.2 | $90 | -$14.7 | $123.5 | $39.1 | $68.0 | |
| Mortgage Loans | 152.3 | 161.7 | 440.0 | 312.4 | 45.6 | 211.0 | |
| Other Loans | 27.6 | 32.5 | -6.0 | 25.7 | 28.4 | 20.0 | |
| Real Estate Owned | 42.1 | 6.4 | -0.4 | 31.7 | 16.3 | 15.0 | |
| Judgments | 59.1 | 0.0 | 14.9 | 30.4 | 43.6 | 98.0 | |
| Securities | 166.2 | 72.8 | -56.5 | 50.4 | 132.1 | 3.0 | |
| Other Assets | 653.7 | 44.2 | -432.4 | 205.7 | 59.8 | 6.0 | |
| Equity in Subs. | 751.8 | 0.0 | -46.4 | 544.4 | 161.1 | 0.0 | |
| Deficiencies | 41.5 | 0.0 | 8.5 | 40.5 | 9.5 | 23.0 | |
| Totals | $1,981.5 | $407.6 | ($489.0) | $1,364.7 | $535.5 | $444.0 | |
Source: Reports from FDIC Division of Finance.
Insurance Fund and Staffing
In 2000, the Corporation undertook a comprehensive review of the deposit insurance system. As part of that effort, the Corporation commissioned a national household survey, conducted by the Gallup Organization, to measure public understanding of?and support for?the deposit insurance program. Also, the FDIC sponsored global efforts to establish or improve deposit insurance systems.
The BIF balance was $31 billion at year-end 2000, or 1.35 percent of estimated insured deposits. This was down from the year-end 1999 reserve ratio of 1.36 percent as the $1.6 billion growth of the fund's balance during 2000 was more than offset by the growth of insured deposits. The balance of the SAIF was $10.8 billion on December 31, 2000. SAIF-insured deposits were $753 billion at year-end 2000, having grown 5.8 percent for the year. The annual growth rate was the highest since the inception of the SAIF in 1989.
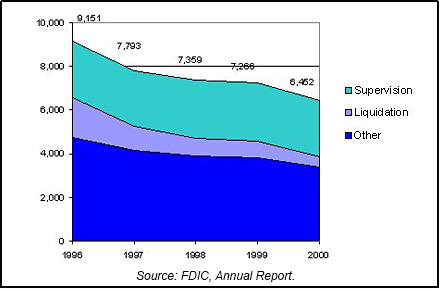
In an effort to keep pace with its declining workload, the Corporation reduced its staff by 814 (11.2 percent) during the year, down to 6,452. The reductions were accomplished largely through the Corporation's continuing practice of allowing temporary and term appointments to expire, which accounted for 63 percent of the decline. Most of the remaining decline was attributable to the closing of the DRR field site in Hartford, Connecticut during the year, leaving Dallas as the sole field site for the division. The Hartford office was originally scheduled to close prior to 2000, however the FDIC Board of Directors delayed the closing date until June 30, 2000, so that the Corporation would have an experienced staff available to respond to an unexpected increase in bank failures in early 2000, in the event of any Y2K technical issues. Chart 23-2 shows the staffing levels for the past five years.
23-1
Bureau of Labor and Statistics, Department of Labor; Bureau of Economic Analysis, Department of Commerce; Housing Market Statistics, National Association of Home Builders; and Federal Home Loan Mortgage Corporation. Back to Text
23-2
Federal Reserve Bulletin Volume 87, Number 6, June 2001. Back to Text
23-3
FDIC Quarterly Banking Profile, Fourth Quarter 2000. Back to Text
23-4
Collections include prior year activity. This activity has the net result of reducing Collections by $50 million. Back to Text
Table of Contents