
Managing the Crisis: The FDIC and RTC Experience — Chronological Overview
Chapter Sixteen: 1993
Acting FDIC Chairman Andrew C. Hove, Jr. remarked in the FDIC's 1993 annual report, “The reductions in both actual bank failures and in our forecasts for future closings enabled the BIF [Bank Insurance Fund] to end 1993 with a balance of $13.1 billion. That is a significant improvement over the negative balance of $101 million at the close of 1992 and the $7 billion deficit at year–end 1991—the only years since the FDIC began operations in 1934 that the insurance fund had a negative balance.”
Table 16-1
| 1992 - 1993: FDIC at a Glance ($ in Millions) | |||
|---|---|---|---|
| 12/31/92 | 12/31/93 | Percent Change | |
| Number of Bank Failures | 120 | 41 | -65.83% |
| Assistance to Open Banks | 2 | 0 | -100.00% |
| Total Failed and Assisted Banks | 122 | 41 | -66.39% |
| Total Assets of Failed and Assisted Banks | $45,391.1 | $3,828.9 | -91.56% |
| Estimated Losses on Failed and Assisted Banks |
$3,675.2 | $646.1 | -82.42% |
| Estimated Losses as a Percent of Total Assets | 8.10% | 16.87% | 108.27% |
| Assets in Liquidation | $43,273.4 | $28,015.1 | -35.26% |
| FDIC Staffing | 15,044 | 14,220 | -5.48% |
| Number of Problem Banks | 863 | 472 | -45.31% |
| Bank Insurance Fund Balance | $-100.6 | $13,121.6 | -- |
| Bank Insurance Fund Balance as a Percent of Insured Deposits | -0.01% | 0.69% | -- |
| Savings Insurance Fund Balance | $279.0 | $1,155.7 | 314.23% |
| Savings Insurance Fund Balance as a Percent of Insured Deposits | 0.04% | 0.17% | 325.00% |
Percent change is not provided if either the latest period or the year–ago period contains a negative number. Back to table
Source: FDIC, 1993 Annual Report and Reports from FDIC Division of Finance and Division of Research and Statistics.
Notable Events
Certain events important to the FDIC occurred in 1993, as follows:
- On January 1, FDIC insured institutions began paying risk-based premiums for deposit insurance;
- On September 29, $391 million in additional funds were distributed to the FDIC and the RTC in the Drexel Burnham Lambert case;
- On November 17, President William J. Clinton announced his intention to nominate Ricki Tigert as chairman of the FDIC; and
- On December 14, the FDIC held a two-day nationwide real estate auction in which 165 properties were sold for a total of $312.2 million.
Economic/Banking Conditions
The economy continued its recovery with Gross Domestic Product growing at the modest pace of 2.3 percent and the unemployment rate declining from 7.5 percent to 6.9 percent.16-1 The discount rate fell to 3 percent, and the 30-year mortgage rate also reached a low of 7.3 percent.16-2 The inflation rate fell slightly from 2.8 percent to 2.6 percent.16-3 The low interest rates and inflation rate spurred the housing sector with home sales and housing starts at 8.2 percent and 7.3 percent, respectively. The office vacancy rate also declined from 18.5 percent to 17.1 percent.16-4
The Southwest was in the midst of a full recovery, as the number of failures declined from 36 in 1992 to only 10 failures in 1993. The recovery was fueled in part by the fact that Southwest banks held smaller fractions of their portfolios in the form of commercial real estate and Commercial and Industrial (C&I) loans than they had held in the mid-1980s. Commercial real estate loans made up close to 9 percent of Southwest banks’ assets in 1986, but only 6.8 percent of the assets in 1993. Similarly, the percentage of C&I loans was about 16 percent in the early 1980s, but plummeted to a low of 7 percent in 1993. Total loans and leases, which made up about 57 percent of the assets in the mid-1980s, fell to under 45 percent in 1993.
The Northeast had only three failures in 1993, a substantial drop from the previous years’ totals of 52 in 1991 and 43 in 1992. Further, the number of problem banks in the region also declined to 148 institutions. Asset growth rates came out of the red for the first time in four years, and return on assets increased by more than 20 basis points. Nonperforming assets relative to total assets continued to fall, as did net charge-offs on loans and leases. The decline in the number of failures was accompanied by a huge drop in the Northeast banks’ holding of C&I loans from a high of slightly above 10 percent in 1980 to an all-time low of under 4 percent in 1993. Total loans and leases also declined to 62 percent of assets from a high of 73 percent in the mid-1980s. Real estate loans also declined in 1993, but not as much as those other types of loans.
Bank failures in California peaked in 1993 at 19 institutions. Unlike the Southwest, California did not experience large numbers of failures. Of the banks that did fail in California, 77 percent were banks that had been chartered in the 1980s, and 83 percent of the failures were southern California community banks which were small, local, and not diversified. Net charge-offs on loans and leases peaked in southern California at 0.8 percent of assets, while the rest of California and the U.S. had levels of 0.2 percent and 0.1 percent, respectively. Return on assets for the California banking industry was -0.01 percent, its lowest point in ten years. Lending activity in the state remained steady with total loans and leases totaling 64 percent of assets. Total real estate loans fell slightly relative to assets, while commercial real estate loans remained around 24 percent of assets. C&I loans continued to fall from 13.5 percent of assets in 1992 to 12.5 percent.
Overall, the U.S. banking industry continued its good performance from the previous year. There were 59 new charters, down slightly from the previous year.
FDIC insured institutions in 1993 reported record earnings, due to favorable interest rates and improved interest earning asset quality. More than two-thirds of the institutions reported higher earnings, and fewer than 1 in 20 institutions was unprofitable. In addition, troubled assets declined further in 1993, and noncurrent loans and other real estate portfolios shrank to their lowest levels since 1986.
Commercial banks reported a gain in net income of $43.4 billion, exceeding the 1992 record of $32 billion. The Northeast and California banking industries were slightly less profitable than the rest of the U.S. because of the condition of some large savings banks. Equity capital grew, supported by high levels of retained earnings and favorable conditions for new capital issues. Commercial banks’ equity capital as a percent of total assets rose to an average of 8.01 percent by the end of 1993, and that was the first time in 30 years that capital rates were above 8 percent. Total loans held by commercial banks grew by 6 percent in 1993. The FDIC’s problem bank list shrank again to 472 commercial banks with assets of $269.2 billion at the end of the year. In addition, there were 100 Savings Association Insurance Fund (SAIF) insured savings banks with combined assets of $65 billion on the FDIC’s problem list by the end of 1993. That was the third consecutive decline in the SAIF member problem bank list.
By the end of the year, 2,26416-5 savings banks and savings associations insured by the FDIC held assets totaling $1 trillion and had combined earnings of $7 billion. Their net income for 1993 was up 4.2 percent, although total assets declined by 2.8 percent. Unlike commercial banks, savings institutions did not show uniform earnings strength. Institutions in the Northeast and California, including some of the largest savings institutions in the nation, were less profitable than the rest of the industry.
Table 16-2 shows the number and total assets of FDIC insured institutions, as well as their profitability as of the end of 1993.
Table 16-2
Open Financial Institutions Insured by FDIC ($ in Billions)
| Commercial Banks - FDIC Regulated | |||
|---|---|---|---|
| Item | 1992 | 1993 | Percent Change |
| Number | 11,462 | 10,958 | -4.40% |
| Total Assets | $3,505.7 | $3,706.2 | 5.72% |
| Return on Assets | 0.93% | 1.20% | 29.03% |
| Return on Equity | 7.94% | 12.98% | 63.48% |
| Savings Banks - FDIC Regulated | |||
|---|---|---|---|
| Item | 1992 | 1993 | Percent Change |
| Number | 518 | 593 | 14.48% |
| Total Assets | $218.2 | $226.1 | 3.62% |
| Return on Assets | 0.74% | 0.95% | 28.38% |
| Return on Equity | 9.35% | 11.09% | 18.61% |
| Savings Associations - OTS Regulated | |||
|---|---|---|---|
| Item | 1992 | 1993 | Percent Change |
| Number | 1,872 | 1,669 | -10.84% |
| Total Assets | $812.0 | $774.8 | -4.58% |
| Return on Assets | 0.63% | 0.63% | 0.00% |
| Return on Equity | 9.53% | 8.61% | -9.65% |
Source: Reports from FDIC Division of Research and Statistics.
Bank Failures
During 1993, bank failures decreased in both pace and volume. The FDIC handled 41 bank closings in 1993, the lowest level in 12 years. Assets in the failed institutions totaled $3.8 billion, and there was only one failed bank with total assets near $1 billion. No assistance transactions took place in 1993.
Of the 41 failures in 1993, a total of 36 were purchase and assumption (P&A) transactions, including 30 transactions in which only the insured deposits (as opposed to all deposits) passed to the assuming institution. The five remaining failures were resolved through payoffs. In most of the closings in 1993, advance dividends were paid to uninsured depositors. In 35 of the 41 failures, uninsured depositors received less than 100 cents per dollar on their uninsured deposits.
In 1993, there were three major resolutions, and each one involved failed banks from previous years:
- On February 13, the 20 bridge banks with total assets of $8.1 billion established in 1992 for First City Bancorporation of Houston, Inc., Houston, Texas, were sold in P&A transactions to various purchasers.
- On April 23, Missouri Bridge Bank, N.A., Kansas City, Missouri, established in 1992 to assume certain assets and liabilities of two banks, Metro North State Bank, Kansas City, Missouri, and The Merchants Bank, Kansas City, Missouri, was sold to Boatmen's First National Bank of Kansas City, Kansas City, Missouri; total assets were $1.9 billion (two resolutions).
- On August 12, CrossLand Federal Savings Bank, Brooklyn, New York was resolved through a public stock offering, with estimated savings to BIF of $400 million; total assets were $7.4 billion.
A recent estimate of losses per transaction type is shown in Table 16-3.
Table 16-3
| 1993 Estimated Losses by Transaction Type ($ in Millions) | ||||
|---|---|---|---|---|
| Transaction Type | Number of Transactions | Total Assets | Estimated Loss* as of 12/31/03 | Estimated Losses as a Percent of Assets |
| P&As | 36 | $3,493.3 | $544.2 | 15.58% |
| Payoffs | 5 | 335.6 | 101.9 | 30.36% |
| Totals | 41 | $3,828.9 | $646.1 | 16.87% |
Source: Reports from FDIC Division of Research and Statistics.
In 1993, the FDIC promulgated several final regulations to further implement the Federal Deposit Insurance Corporation Improvement Act (FDICIA) of 1991, including the following:
- A new prohibition against insured state chartered banks and their majority-owned subsidiaries from conducting activities “as principal” which were not permitted at national banks.
- The final risk-related insurance premium system;
- The final amendments to risk-based capital rules; and
- Regulations further implementing the prompt corrective action requirement.
During the year, two significant acts of Congress had an impact on the FDIC. In the Omnibus Budget Reconciliation Act of 1993, Congress included a “national depositor preference” amendment, which applied to all insured institutions closed on or after August 10, 1993. The second significant act was the appropriation by Congress of an additional $1.2 billion to the FSLIC Resolution Fund (FRF) to handle the assets and liabilities of the former Federal Savings and Loan Insurance Corporation.
The National Depositor Preference Amendment provided for failed bank assets to be distributed in the following order to:
- Cover the FDIC's administrative expenses;
- Pay the claims of all depositors;
- Pay general creditor claims;
- Pay subordinated creditor claims; and
- Pay claims of shareholders
Payments to Depositors and Other Creditors
In the 41 banks that failed in 1993, deposits totaled $3.5 billion in 1,712,224 deposit accounts. Payoffs accounted for five transactions with 16,774 deposit accounts and total deposits of $320.2 million. Dividends paid on all active receiverships totaled $17.9 billion in 1993.
Of the 2,108 insured bank resolutions16-6 since the FDIC began operations in 1934, 1,224 were P&A transactions and 202 were whole bank deals. Deposit payoff transactions accounted for 603 cases, of which there were 176 insured deposit transfers (IDTs). There were also 79 open bank assistance (OBA) transactions.
Total disbursements by the FDIC since January 1, 1934, amounted to $102.1 billion. Of that amount, the FDIC recovered $64.4 billion, for a net loss of $37.7 billion.
Asset Disposition
At the beginning of 1993, the FDIC held $43.3 billion in assets of failed banks. During the year, the FDIC handled 41 failed banks with total assets of $3.8 billion and acquired $1.9 billion in assets for liquidation. Also during 1993, the FDIC became responsible for certain failed institutions insured by SAIF. Assets from failed SAIF–insured institutions totaled $729 million, of which the FDIC acquired $354 million for liquidation. Principal collections amounted to $8.1 billion for BIF, $769 million for FRF, and $278 million for SAIF, for a total of about $9.2 billion. At the end of 1993, there were $25.2 billion in assets in liquidation for BIF, $2.7 billion for FRF, and $72 million for SAIF, for a total of $28 billion, a reduction of 35 percent from the total at the end of 1992.
During 1993, the FDIC disposed of a large portion of its asset inventory acquired from failed institutions. Total book value reduction was $15.3 billion, from $43.3 billion to $28 billion. Total collections were approximately $9.2 billion. Significant activities were as follows:
- During the year, the sale of 10,275 real estate properties had a total sales price of $2.2 billion. The sales resulted in recoveries of 89.8 percent of the average appraised value.
- The sale of over 136,000 loans, totaling $5.4 billion in book value, in sealed bid offerings and other asset marketing events, or $1.3 billion more than the $4.1 billion record of 1992. Net sales proceeds of $3.3 billion hit a new high and represented 99.8 percent of appraised value.
- The third annual national real estate auction held in December in Boston, Massachusetts, included 197 properties valued at approximately $400 million. The FDIC sold 165 of the properties for $312.2 million, which was an average price of more than 90 percent of the appraised value. Satellite coverage allowed bidders to participate from several other major locations.
In 1993, the FDIC acquired its first assets for liquidation from SAIF–insured institutions. The SAIF had responsibility for:
- All federally insured depository institutions that became members of SAIF after August 8, 1989, for which the RTC did not have resolution authority, and
- All deposits insured by SAIF held by BIF member banks, so called “Oakar banks,” created pursuant to the Oakar amendment provisions found in Section 5(d)(3) of the Federal Deposit Insurance Act.
The“Oakar Amendment” provisions allowed, with approval of the appropriate federal regulatory authority, any insured depository institution to merge, consolidate, or transfer the assets and liabilities of an acquired institution without changing insurance coverage for the acquired deposits. Such acquired deposits continued to be either SAIF-insured deposits or BIF insured deposits and assessed at the appropriate assessment rate. In addition, any losses from the failure of those institutions were to be allocated between BIF and SAIF based on the respective dollar amounts of the deposits.
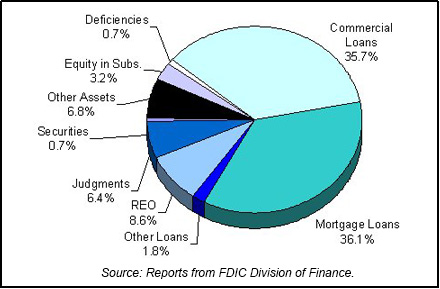
Table 16-4 shows the FDIC's assets in liquidation and Chart 16-1 shows the asset mix.
Table 16-4
| 1993 FDIC End of the Year Assets in Liquidation ($ in Billions*) | ||||||
|---|---|---|---|---|---|---|
| Asset Type | 12/31/92 Book Value | 1993 Assets Acquired | 1993 Prin. Coll. | 1993 Write Downs | 12/31/93 Book Value | 12/31/93 Est. Rec. Value |
| Commercial Loans | $14.9 | $0.7 | $2.6 | $3.0 | $10.0 | $5.0 |
| Mortgage Loans | 14.2 | 1.2 | 3.2 | 2.1 | 10.1 | 6.5 |
| Other Loans | 0.7 | 0.2 | 0.2 | 0.2 | 0.5 | 0.3 |
| Real Estate Owned | 3.8 | 1.3 | 1.4 | 1.3 | 2.4 | 1.4 |
| Judgments | 1.9 | 0.5 | 0.1 | 0.5 | 1.8 | 0.3 |
| Securities | 0.8 | 0.2 | 0.7 | 0.1 | 0.2 | 0.0 |
| Other Assets | 4.5 | -1.9 |
0.2 | 0.5 | 1.9 | 0.7 |
| Equity in Subs. | 2.5 | -0.7 |
0.8 | 0.1 | 0.9 | 0.4 |
| Deficiencies |
0.8 | 0.0 | 0.6 | 0.2 | 0.1 | |
| Totals | $43.3 | $2.3 | $9.2 | $8.4 | $28.0 | $14.7 |
Source: Reports from FDIC Division of Finance.
Insurance Fund and Staffing
At the end of 1993, BIF's balance was $13.1 billion, significantly up from 1992's negative $101 million and 1991's negative $7 billion. SAIF reserves grew to $1.2 billion from $279 million in 1992. However, SAIF's reserves were only 17 cents per $100 of insured deposits, compared with 69 cents per $100 in BIF.
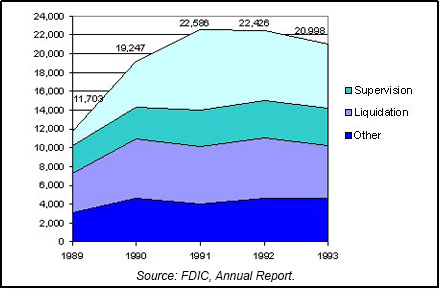
FDIC staffing stood at 14,220, including 3,971 Division of Supervision personnel and 5,665 Division of Depositor and Asset Services (formerly known as Division of Liquidation) personnel. Total staffing including 6,778 RTC employees equaled 20,998. Chart 16–2 shows the staffing levels for the past five years.
Table 16-5
Resolution Trust Corporation
| 1992 - 1993: RTC at a Glance ($ in Millions) | |||
|---|---|---|---|
| 12/31/92 | 12/31/93 | Percent Change | |
| Number of Conservatorships at the beginning of the year | 91 | 81 | -10.99% |
| Number of Conservatorships added during the year | 50 | 8 | -84.00% |
| Thrifts in the ARP Program |
9 | 1 | -88.89% |
| Total of all thrift takeovers | 59 | 9 | -84.75% |
| Total of thrift resolutions | 69 | 27 | -60.87% |
| Conservatorships resolved during the year | 60 | 26 | -56.67% |
| Conservatorships at the end of the year | 81 | 63 | -22.22% |
| Total Assets at Takeover | |||
|---|---|---|---|
| 12/31/92 | 12/31/93 | Percent Change | |
| Conservatorships | $35,448 | $6,061 | -82.90% |
| Thrifts in the ARP Program | $9,437 | $44 | -99.53% |
| Total | $44,885 | $6,105 | -86.40% |
| Estimated losses on thrift resolutions |
$4,180 | $609 | -85.43% |
| Estimated losses as a percent of total assets | 9.31% | 9.97% | 7.09% |
| Assets in Liquidation | |||
|---|---|---|---|
| 12/31/92 | 12/31/93 | Percent Change | |
| Conservatorships | $40,211 | $23,166 | -42.39% |
| Receiverships | $64,335 | $40,664 | -36.79% |
| Total | $104,546 | $63,830 | -38.95% |
| RTC Staffing | 7,382 | 6,778 | -8.18% |
Source: RTC, 1993 Annual Report and Reports from FDIC Division of Research and Statistics.
Notable Events
On March 15, 1993, Deputy Treasury Secretary Roger C. Altman became interim chief executive officer (CEO), taking over the helm from resigning President and CEO Albert V. Casey. Altman would later hold the post for approximately one year.
In the RTC's 1993 annual report issued in June 1994, RTC Acting CEO John Ryan stated that: “[RTC] has now entered the last phase of its operations…The days when RTC resolved scores of thrifts in a single month and disposed of tens of billions of dollars in assets in one quarter are thankfully behind us.” By the end of the year, the RTC had only 63 thrifts remaining to be resolved, and $63.8 billion in assets awaiting disposal.
On December 17, 1993, President Clinton signed the Resolution Trust Corporation Completion Act into law. The Act removed the prior April 1, 1992 limitation on funds previously established under the RTC Refinancing, Restructuring, and Improvement Act (RTCRRIA) of 1991, and authorized up to $18.3 billion to resolve the remaining insolvent thrifts. The Act also established a new RTC sunset date of December 31, 1995, one year earlier than previously mandated.
S&L Resolutions
At the beginning of 1993, the RTC was managing 81 conservatorships with total assets of $71.9 billion in total assets. During the year, eight more thrifts with total assets of $6.3 billion entered the conservatorship program, while 26 conservatorships with total assets of $7.5 billion were resolved. Additionally, one institution with total assets of $44 million was resolved through the Accelerated Resolution Program (ARP). In spite of the Congressional funding impasse, recoveries on asset sales and favorable economic conditions resulted in a release of unallocated reserves, which made $3 billion available for resolutions. Of the 27 resolutions in 1993, 24 were resolved using those funds, while the remaining three were completed without cost to the RTC. Estimated savings over the cost of paying off insured deposits was $300 million.
In 16 of the 26 P&A resolutions, all deposits were transferred to acquirers, while in ten resolutions, only insured deposits were transferred. One institution was resolved through a payoff. The 26 thrifts resolved in P&A transactions had total assets of $7.4 billion. The only institution whose deposits were paid off in 1993 had total assets of $93.7 million.
The largest conservatorship resolution in 1993 was HomeFed Bank, F.A., San Diego, California, (HomeFed) which had $10.2 billion in deposits, $13.9 billion in assets, and 201 offices in July 1992 at the time it was placed into conservatorship. While HomeFed was in conservatorship, the RTC aggressively marketed the institution's assets as it downsized the thrift by selling 56 branches and closing 9 branches in the process. The remaining 136 branches were sold in the resolution of HomeFed to four acquirers.
Losses per transaction type are shown in Table 16-6 and Table 16-7 shows conservatorships and receiverships at year-end 1993.
Table 16-6
| 1993 Losses by RTC Transaction Type ($ in Millions) | ||||
|---|---|---|---|---|
| Transaction Type | Number of Transactions | Total Assets | Loss* as of 12/31/95 | Estimated Losses as a Percent of Assets |
| P&As | 26 | $7,392.1 | $1,643.8 | 22.24% |
| Payoffs | 1 | 93.7 | 16.5 | 17.61% |
| Totals | 27 | $7,485.8 | $1,660.3 | 22.18% |
Source: Reports from FDIC Division of Research and Statistics.
Table 16-7
| Conservatorships | |
|---|---|
| Item | Total |
| In Conservatorship at 12/31/92 | 81 |
| Conservatorships added in 1993 | 8 |
| Subtotal | 89 |
| Conservatorships resolved in 1993 (New Receiverships) | 26 |
| Conservatorships remaining 12/31/93 | 63 |
| Receiverships | |
|---|---|
| Item | Total |
| Receiverships as of 12/31/92 | 653 |
| New Receiverships that were previously Conservatorships in 1993 | 26 |
| New Receiverships that were resolved through ARP in 1993 | 1 |
| Total Receiverships during 1993 | 27 |
| Total Receiverships as of 12/31/93 | 680 |
Source: RTC, 1994 Annual Report.
Payments to Depositors and Other Creditors
In 1993, there were 27 resolutions with total deposits of $8 billion in 1,065,319 deposit accounts. Of that total, there was one payoff transaction with $47.1 million in total deposits in 751 deposit accounts.
Of the 680 insured thrift failures since the RTC began operations in August of 1989, a total of 433 were P&A transactions, 89 were payoff transactions, and 158 were IDTs.
Asset Disposition
At the beginning of 1993, the RTC held $104.5 billion in assets of savings and loan associations in receivership and conservatorship. Assets acquired during the year through conservatorships, other resolved institutions, and putbacks or repurchases totaled $23.5 billion for the year. Losses and collections totaled $64.2 billion for the year. At the end of 1993, total assets in liquidation from receiverships and conservatorships was $63.8 billion, a reduction of 39 percent.
In December 1992, the RTC had established goals to reduce the book value of Standard Asset Management Disposition Agreement (SAMDA) assets as of September 30, 1992, by 90 percent before the end of 1993. In 1993, the RTC developed policies and procedures to ensure that all RTC contractors completed their contractual obligations. The focus of the SAMDA program was shifted back to loan workout/compromise and sale of individual assets and away from the bulk sales strategies used in 1992. At the end of the year, 91 SAMDA contractors were managing assets with a total book value of approximately $10.9 billion.
During 1993, the RTC closed approximately $1.6 billion in commercial seller financed transactions. Special teams in 23 offices restructured, sold, or worked out approximately $2 billion in problem assets, and another $2.9 billion in assets were being reviewed at the end of 1993.
In addition, the RTC conducted two national, nonperforming loan auctions in Kansas City, Missouri. In March 1993, approximately 18,000 loans with a total book value of about $503 million were sold at an auction yielding a $249 million recovery. Later, in August 1993, 11,200 loans with a total book value of $670 million were sold for a total recovery of $335 million.
Concerning the RTC's securities portfolio, the RTC sold a total of $62.5 billion of securities from March 1990 through the end of 1993. The securities sold included $9 billion of interest rate swaps and $9 billion in junk bonds for a total recovery of about 65 cents on the dollar.
In 1993, the RTC used the Multiple Investor Fund, the N Series, and the S Series transactions to dispose of nonperforming and subperforming loans. Those transactions involved the formation of partnerships with private investors who purchased, managed, and then sold portfolios of nonperforming and subperforming loan assets, and then shared in the profit with the RTC. Approximately $4.1 billion book value in nonperforming commercial and multi-family mortgage loans was sold in 1993.
The S Series securitization transactions were similar to the N Series transactions designed to dispose of nonperforming and subperforming commercial loans through leveraged trusts. The S Series transactions targeted investors with moderate capital levels by reducing the investors' equity investment to $4 million, which was down from the $9 million required in the N Series transactions.
Approximately $3.8 billion book value in performing loans was securitized in 1993. Five transactions were collateralized by $1.6 billion in performing single-family mortgages and three transactions by $2.2 billion in performing commercial and multi-family mortgages. More than $36.6 billion in assets were securitized from the inception of the program in June 1991 through 1993, including single-family, multi-family, commercial mortgages, and commercial and consumer loans.
Overall, $50 billion was recovered through collections and asset sales. This figure is net of assets sold and then put back or repurchased and net of discounted payoffs, bulk sale discounts, and write-offs. Table 16-8 shows the RTC's assets in liquidation and Chart 16-3 shows the asset mix.
Table 16-8
| 1993 RTC End of the Year Assets in Liquidation ($ in Billions*) | ||||||
|---|---|---|---|---|---|---|
| Asset Type | 12/31/92 Total Book Value | Assets Acq'd During the Year | 1993 Collections | 1993 Losses | 12/31/93 Total Book Value | Memo Item |
| 1-4 Family Mtges | $16.6 | $3.4 | $10.0 | $1.0 | $9.0 | $0.9 |
| Other Mtges | 32.7 | 2.2 | 10.2 | 7.2 | 17.5 | 1.2 |
| Other Loans | 7.2 | 2.1 | 3.8 | 1.0 | 4.5 | 0.1 |
| Real Estate Owned | 12.9 | 0.6 | 3.5 | 4.0 | 6.0 | 0.5 |
| Other Assets | 16.8 | 1.0 | 2.7 | -0.2 | 15.3 | 1.3 |
| Cash/Securities | 18.3 | 14.2 | 19.7 | 1.3 | 11.5 | 3.4 |
| Totals | $104.5 | $23.5 | $49.9 | $14.3 | $63.8 | $7.4 |
Memo Item: Assets transferred from conservatorship to receivership. Does not affect total of assets in liquidation.
Source: RTC August 1989/September 1995 Statistical Abstract.

Funding and Staffing
During the year, the RTC reorganized its field operations in a downsizing effort. The RTC closed field offices in Houston, Texas; Baton Rouge, Louisiana; Somerset, New Jersey; Phoenix, Arizona; Tampa, Florida; San Antonio, Texas; and Chicago, Illinois. More than 600 permanent employees returned to the FDIC. The Financial Institutions Reform, Recovery, and Enforcement Act of 1989 guaranteed that all transferred (returned) employees were guaranteed a position with the same status, tenure, and pay as that held on the day immediately preceding the transfer. Each such employee holding a permanent position could not be involuntarily separated or reduced in grade or compensation for one year after the date of the transfer, except for cause. Total RTC staffing declined from 7,382 at the end of 1992 to 6,778 at the end of 1993.
16-1 Bureau of Economic Analysis and Bureau of Labor Statistics, Department of Labor.Back to Text
16-2 Housing Market Statistics, National Association of Home Builders (June 1996), and Federal Home Loan Mortgage Corporation.Back to Text
16-3 Bureau of Labor Statistics, Department of Labor.Back to Text
16-4 Housing Market Statistics, National Association of Home Builders (June 1996), and CB Commercial Torto/Wheaton Research.Back to Text
16-5 Figures do not include member institutions of SAIF that were in RTC conservatorship.Back to Text
16-6 In 1988 there were 21 assistance agreements that resolved 79 institutions. The FDIC annual report (source data) calculates failure data per transaction; this report calculates failures per failed institution. Actual resolutions through 1993 totaled 2,166.Back to Text
Table of Contents