
Managing the Crisis: The FDIC and RTC Experience — Chronological Overview
Chapter Twenty-One: 1998
The conditions in the industry—and the strength of the insurance funds—in 1998 gave the FDIC opportunity to focus on three corporate priorities: Year 2000 readiness; emerging risks facing insured institutions, and, therefore, the insurance funds; and diversity in the workforce. Each in its way contributed to the efforts to ensure that the FDIC remains the world's leading deposit insurance authority.
Table 21-1
| 1997 - 1998: FDIC at a Glance ($ in Millions) | |||
|---|---|---|---|
| 12/31/97 | 12/31/98 | Percent Change | |
| Number of Bank Failures | 1 | 3 | 200.00% |
| Total Assets of Failed and Assisted Banks | $27.9 | $290.2 | 940.14% |
| Estimated Losses on Failed and Assisted Banks |
$5.0 | $227.5 | 4,450.00% |
| Estimated Losses as a Percent of Total Assets | 17.92% | 78.39% | 337.44% |
| Assets in Liquidation | $4,114.6 | $2,375.5 | -42.27% |
| FDIC Staffing | 7,793 | 7,359 | -5.57% |
| Number of Problem Financial Institutions | 92 | 84 | -8.70% |
| Bank Insurance Fund Balance | $28,292.5 | $29,612.3 | 4.66% |
| Bank Insurance Fund Balance as a Percent of Insured Deposits | 1.38% | 1.38% | 0.00% |
| Savings Insurance Fund Balance | $9,368.3 | $9,839.8 | 5.03% |
| Savings Insurance Fund Balance as a Percent of Insured Deposits | 1.36% | 1.39% | 2.21% |
Source: FDIC, 1998 Annual Report and Reports from FDIC Division of Finance and Division of Research and Statistics.
Notable Events
- On April 4, FDIC Board member Eugene A. Ludwig's tenure on the Board ended with the expiration of his five-year term as Comptroller of the Currency.
- On April 29, a two-day symposium, Managing the Crisis: The FDIC and RTC Experience, was presented. Current and former FDIC and Resolution Trust Corporation executives discussed the strategies they used to resolve trouble banks and thrifts during the financial crisis of the 1980s and 1990s. Between 1980 and 1994, a total of 1,617 banks and 1,295 thrifts failed and were resolved. Books developed as part of the symposium would soon rank among the most popular publications in the FDIC history.
- On May 26, Donna Tanoue was sworn in as the 17th Chairman of the FDIC. Andrew C. Hove, Jr., who had served as Acting Chairman since June 1997, resumed his position as the agency's Vice Chairman.
- By May 31, FDIC bank examiners, with assistance from state bank regulators, completed the first round of on-site Year 2000 assessments for FDIC supervised institutions, and also all data service providers and vendors that FDIC is responsible for examining. By year-end, approximately 97 percent of FDIC supervised institutions were making satisfactory progress toward achieving Year 2000 readiness.
- On June 18, the FDIC announced its “Suspicious Internet Banking” web site designed to help detect potentially fraudulent Internet banking activity. The site provides the public and the industry with a “user friendly” vehicle for reporting entities on the Internet that may be misrepresenting themselves as legitimately chartered or federally insured depository institutions.
- On September 9, the FDIC hosted the International Deposit Insurance Conference in Washington, DC to discuss the role of deposit insurance in sustaining public confidence in the world's banking system, drawing top government officials from 62 countries, including the leaders of deposit insurance agencies in more than 20 nations.
- On September 30, Joseph H. Neely resigned as a member of the FDIC's Board of Directors. He had served since January 29, 1996.
- Also on September 30, a “user friendly” electronic deposit insurance estimator called “EDIE” became available on the FDIC's web site. The service enables consumers and financial institutions employees to quickly check whether a depositor with multiple accounts at the same institution has exceeded the $100,000 statutory limit for deposit insurance coverage.
- On December 8, John D. Hawke, Jr., was sworn in as the 28th Comptroller of the Currency, filling the FDIC Board seat vacated by Eugene A. Ludwig.
Economic/Banking Conditions
The U.S. economy continued to speed along during 1998, registering a 5.6 percent expansion in GDP growth. Unemployment declined another 30 basis points to 4.4 percent and the actual count of employed persons rose 1.4 percent to 132,581,000. Inflation remained tame, as the cost of living advanced by a modest 1.7 percent. Encouraged by the low inflation rate, the discount rate was lowered by 50 basis points to 4.5 percent. Remarkably similar was the decline in interest rates on 30-year mortgages which fell by 49 basis points to 7.02 percent. Given this rather idyllic environment, both new home sales (up 10.2 percent) and new housing starts (up 9.7 percent) rose sharply. Office vacancy rates fell another 100 basis points to 8.7 percent, as all aspects of the economy did well.21-1
The commercial banking industry faired well, but not as well as in previous years. Both returns on assets and equity were down, 5 basis points, and 75 basis points, respectively. There was a decline in rates earned on interest-bearing assets. In 1998, 5.8 percent of all commercial banks reported net losses; compared to 4.9 percent in 1997.
Commercial bank earnings totaled $61.5 billion; an increase of 3.9 percent or $2.3 billion from 1997. Bank assets grew by 8.25 percent. Security holdings rose 8.33 percent. Bank equity grew 9.5 percent. Net-interest income declined 15 basis points. The net interest margin also declined to a level not seen in seven years. There were two main reasons attributed to the decline: a shift in bank assets away from high-yielding assets, and a shift in bank sources of funding toward more expensive liabilities. Non-interest income as a percentage of assets rose 18 basis points. Non-interest expense rose due to merger and restructuring charges, increases in data processing services, and a rise in wage/occupancy costs.
Overall, loans increased 9 percent. Commercial and Industrial loans expanded by 13 percent and commercial real estate loans rose 11.3 percent, which can be attributed to continuing strong conditions in the property market (especially in the office sector). Loans to consumers expanded by 1 percent.
Bank stock prices rose during the first half of the year as fear of Asian crisis diminished. However, there was a sharp decline during the middle of the year due to the Russian debt default. By the end of the year, fears eased and bank stock prices recovered to around the price they were at the beginning of year.
Core deposits grew 7 percent and managed liabilities increased 9.5 percent. Many bank mergers occurred in 1998, resulting in the top 100 banks controlling 70 percent of industry assets.21-2
At end of 1998, there were 10,489 financial institutions in the United States and 84 institutions on the problem bank list.21-3
Table 21-2 shows the number and total assets of FDIC insured institutions, as well as their profitability as of the end of 1998.
Table 21-2
Open Financial Institutions Insured by FDIC ($ in Billions)
| BIF Members | |||
|---|---|---|---|
| 1997 | 1998 | Percent Change | |
| Number | 9,406 | 9,032 | -3.98% |
| Total Assets | $5,292.8 | $5,702.9 | 7.75% |
| Return on Assets | 0.48% | 0.53% | 10.42% |
| Return on Equity | 14.43% | 13.82% | -4.23% |
| SAIF Members | |||
|---|---|---|---|
| Item | 1997 | 1998 | Percent Change |
| Number | 1,517 | 1,432 | -5.60% |
| Total Assets | $752.0 | $828.2 | 10.13% |
| Return on Assets | 0.94% | 0.98% | 4.26% |
| Return on Equity | 11.11% | 11.29% | 1.62% |
| US Branches of Foreign Banks | 27 | 25 | -7.41% |
Source: FDIC Quarterly Banking Profile, Fourth Quarter 2003.
Bank Failures
During 1998, the FDIC resolved three BIF-insured institutions that failed. OmniBank, River Rouge, Michigan, with a total of $42 million in assets, was closed on April 9. The majority of the bank's assets and all of the deposits were acquired under a “loss-share agreement.” Q Bank, Fort Benton, Montana, with total assets of $15 million, was closed on August 7. The failed bank's insured deposits and some assets were acquired by an assuming bank.
The most notable failure in 1998 was the BestBank, Boulder, Colorado. BestBank with total assets of $233.2 million and total liabilities of $206.3 million, was closed July 23, 1998, by the Colorado State Bank Commissioner. Losses associated with pursuing subprime credit card customers through an allegedly fraudulent telemarketing travel club program caused the bank's failure. The bank pursued rapid growth in subprime credit cards funded primarily by out-of-territory time deposits. In addition, there was evidence of significant alleged fraud by the credit card marketer posting internally generated credits on 40 to 50 percent of the credit card accounts. The principal of BestBank was arrested based on a 46-count Federal grand jury indictment of bank fraud, wire fraud, and money laundering from a Denver, Colorado court. The estimated total loss to the deposit insurance fund is $223 million.
A more recent estimate of losses per transaction type is shown in Table 21-3.
Table 21-3
| 1998 Estimated Losses by FDIC Transaction Type ($ in Millions) | ||||
|---|---|---|---|---|
| Transaction Type | Number of Transactions | Total Assets | Estimated Loss* as of 12/31/03 | Estimated Losses as a Percent of Assets |
| P&As | 3 | $290.2 | $227.5 | 78.39% |
Source: Reports from FDIC Website ? Historical Statistics on Banking.
Payments to Depositors and Other Creditors
In the three financial institutions that failed in 1998, deposits totaled $260.7 million in 12,700 deposit accounts. Dividends paid on all active receiverships totaled almost $4.8 billion in 1998.
There have been a total of 2,196 insured financial institution resolutions since the FDIC began operations in 1934. Of this total, 1,452 were P&A transactions, 141 were open bank assistance transactions, and 603 were deposit payoff transactions.
Total disbursements by the FDIC since January 1, 1934, have amounted to $106.9 billion. Of that amount, actual and projected recoveries are anticipated to be approximately $69.8 billion, which equates to a cumulative projected loss of $37.1 billion to the BIF/SAIF funds.
Asset Disposition
At the beginning of 1998, the FDIC held $4.1 billion in assets from failed institutions. That included $1.7 billion in BIF assets, $17 million in SAIF assets, $169 million in FSLIC Resolution Fund (FRF) assets, and $2.2 billion in Resolution Trust Corporation (RTC) assets. During the year, the FDIC acquired an additional $370 million in assets from three bank failures and $17 million from the establishment of a FRF receivership related to the closeout of a previous FRF agreement. The FDIC collected $3.5 billion during the year,21-4 and the ending balance for assets in liquidation was $2.4 billion, a reduction of $1.7 billion. Of the $2.4 billion, $1.3 billion was assets in liquidation for BIF, $349 thousand for SAIF, $105 million for FRF, and $947 million for RTC.
During 1998, FDIC sold real estate properties for a total of $149 million, yielding a recovery of 89 percent of average appraised value. More than 6,545 loans and other assets totaling $335 million in book value were sold through asset marketing efforts.
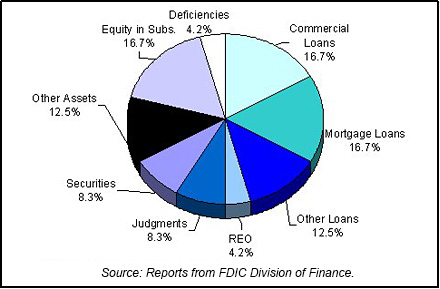
Table 21-4 shows the FDIC's assets in liquidation and Chart 21-1 shows the asset mix.
Table 21-4
| 1998 FDIC End of the Year Assets in Liquidation ($ in Billions*) | |||||||
|---|---|---|---|---|---|---|---|
| Asset Type | 12/31/97 Book Value | 1998 Assets Acquired | 1998 Asset Adj. | 1998 Coll. & Write Downs | 12/31/98 Book Value | 12/31/98 Book Val. Recovery21-5 | |
| Commercial Loans | $0.7 | $0.0 | $0.0 | $0.3 | $0.4 | $0.2 | |
| Mortgage Loans | 0.9 | 0.0 | 0.0 | 0.06 | 0.04 | 0.03 | |
| Other Loans | 0.0 | 0.0 | 0.0 | 0.0 | 0.3 | 0.0 | |
| Real Estate Owned | 0.3 | 0.0 | 0.0 | 0.2 | 0.1 | 0.1 | |
| Judgments | 0.2 | 0.0 | 0.2 | 0.2 | 0.2 | 0.8 | |
| Securities | 0.4 | 0.0 | 0.0 | 0.2 | 0.2 | 0.3 | |
| Other Assets | 0.5 | 0.1 | 0.0 | 0.2 | 0.3 | 0.0 | |
| Equity in Subs. | 1.0 | 0.0 | 0.0 | 0.6 | 0.4 | 0.0 | |
| Deficiencies | 0.1 | 0.0 | 0.0 | 0.1 | 0.1 | 0.1 | |
| Totals | $4.1 | $0.4 | $0.2 | $2.4 | $2.4 | $1.8 | |
Source: Reports from FDIC Division of Finance.
Insurance Fund and Staffing
With banks experiencing another highly profitable year and only three bank failures, 1998 was another positive year for the BIF. The BIF continued to grow steadily and stood at $29.6 billion at year-end 1998. The 1998 fund balance represents a 4.7 percent increase over the 1997 balance of $28.3 billion. BIF-insured deposits grew by 4.1 percent in 1998, yielding a reserve ratio of 1.38 percent of insured deposits at year-end 1998, unchanged from year-end 1997.
The SAIF ended 1998 with a fund balance of $9.8 billion, a 5 percent increase over the year-end 1997 balance of $9.4 billion. Estimated insured deposits increased by 2.8 percent in 1998. During the year, the reserve ratio of the SAIF grew from 1.36 percent of insured deposits to 1.39 percent. More than 95 percent of BIF members and 90 percent of SAIF members paid no deposit insurance premiums for the first half of 1998.
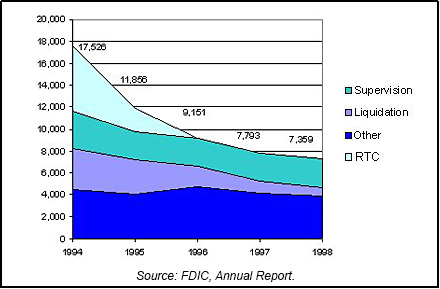
The Corporation continued to reduce the size of its workforce in 1998 to levels consistent with its declining resolutions and liquidation workload. Total FDIC staffing decreased to 7,359 at year-end 1998, down 5.6 percent from year-end 1997. Staffing reductions were primarily due to further declines in the inventory of assets in liquidation and related workload. They were accomplished largely through the expiration of non-permanent appointments and by consolidating field operations. Chart 21-2 shows the staffing levels for the past five years.
In accordance with a 1996 plan for a phased consolidation of its field operations, the Division of Resolutions and Receiverships (DRR) in 1998 closed field offices in Irvine, California; Jersey City, New Jersey; and Boston, Massachusetts; and consolidated the residual workload from those sites into the Dallas and Washington offices. Only the Hartford, Connecticut office remained to be closed under DRR's 1996 field consolidation plan. In December 1998, the FDIC Board of Directors delayed the Hartford office's projected closing date until June 30, 2000. This allowed the Corporation to retain a large number of experienced staff as part of a contingent workforce ready to respond to any unexpected increase in bank failures in early 2000 due to Y2K technical issues. The Division of Supervision also continued to streamline its field office structure in 1998 by closing small field offices in Bath, Ohio; Cincinnati, Ohio; Macon, Georgia; and Fort Wayne, Indiana.
21_1 Bureau of Labor and Statistics, Department of Labor; Bureau of Economic Analysis, Department of Commerce; Housing Market Statistics, National Association of Home Builders; and Federal Home Loan Mortgage Corporation. Back to Text
21_2 Federal Reserve Bulletin, Volume 85, Number 6, June 1999. Back to Text
21_3 FDIC Quarterly Banking Profile, Fourth Quarter 1998. Back to Text
21_4 Collections include 68 RTC Securitization deals that were either purchased by FDIC in its Corporate capacity or were called and the underlying assets (collateral) were liquidated and the bondholders were paid off ($1.9 billion in collections). Back to Text
21_5 Book Value Recovery excludes 68 RTC Securitization deals that were either purchased by FDIC in its Corporate capacity or called with the underlying assets (collateral) disposed and the bondholders paid off ($1.9 billion in recovery). Back to Text
Table of Contents