
Managing the Crisis: The FDIC and RTC Experience — Chronological Overview
Chapter Fourteen: 1991
For the first time in the history of the FDIC, the Bank Insurance Fund (BIF) dropped below zero to a negative $7 billion. On April 30, 1991, the FDIC issued a regulation raising the deposit insurance assessment rate from 19.5 cents to 23 cents per $100 in assessable deposits. That increase in assessment revenue was designed to help offset BIF losses, which had been outpacing revenue since 1984.
Table 14-1
| 1990 - 1991: FDIC at a Glance ($ in Millions) | |||
|---|---|---|---|
| 12/31/90 | 12/31/91 | Percent Change | |
| Number of Bank Failures | 168 | 124 | -26.19% |
| Assistance to Open Banks | 1 | 3 | 200.00% |
| Total Failed and Assisted Banks | 169 | 127 | -24.85% |
| Total Assets of Failed and Assisted Banks | $16,937.7 | $64,635.0 | 281.60% |
| Estimated Losses on Failed and Assisted Banks |
$2,786.3 | $6,136.1 | 120.22% |
| Estimated Losses as a Percent of Total Assets | 16.45% | 9.49% | -42.31% |
| Assets in Liquidation | $30,906.5 | $43,258.3 | 39.97% |
| FDIC Staffing | 14,348 | 13,972 | -2.62% |
| Number of Problem Banks | 1,046 | 1,090 | 4.21% |
| Bank Insurance Fund Balance | $4,044.5 | -$7,027.9 | -- |
| Bank Insurance Fund Balance as a Percent of Insured Deposits | 0.21% | -0.36% | -- |
Percent change is not provided if either the latest period or the year-ago period contains a negative number. Back to table
Source: FDIC, 1990 Annual Report and Reports from FDIC Division of Finance and Division of Research and Statistics.
Notable Events
On October 25, 1991, William Taylor became the 15th chairman of the FDIC. Chairman Taylor had spent most of his professional career with the Federal Reserve System. Prior to his appointment to the FDIC, Chairman Taylor was staff director at the Federal Reserve Board's Division of Banking Supervision and Regulation. Chairman Taylor replaced L. William Seidman, whose six-year term as chairman expired on October 16, 1991.
Economic/Banking Conditions
While the U.S. was still involved in the Persian Gulf War, the U.S. economy had negative growth in 1991 with Gross Domestic Product down 0.97 percent.14-1 Employment growth also was negative at -2.1 percent. The unemployment rate continued to rise with a substantial increase to 6.8 percent, up from 5.6 percent a year earlier.14-2 The discount rate decreased by more than one and a half points to 5.5 percent, and the 30-year mortgage rate fell to 9.3 percent.14-3 Inflation also was down slightly at 4 percent.14-4 Home sales and housing starts remained steady while the office vacancy rate continued to rise and was at 18.9 percent.14-5 Total real estate loans in the U.S. continued to increase to 26 percent of assets, as did commercial real estate loans, rising to 7.3 percent.
Bank failures in the Southwest continued to drop, with 41 for the year, approximately 32.3 percent of all resolutions. Gross State Product (GSP) in the Southwest increased despite the national recession.14-6 Lending in all areas continued to decline and stayed below the national medians.
Problems continued to mount in the Northeast. There were 52 Northeast bank failures in the year, which accounted for more than 90 percent ($5.7 billion) of total U.S. resolution costs and 40 percent of all failures. The Bank of New England, Boston, Massachusetts, and its sister banks, Connecticut Bank & Trust Company, N.A., Hartford, Connecticut, and Maine National Bank, Portland, Maine, failed in January 1991, with an aggregate $21.7 billion in assets and an estimated loss of $889 million. It was the second largest bank failure to that time 14-7 and the seventh costliest. Goldome, Buffalo, New York, also failed in 1991, with $8.7 billion in assets and an estimated loss of $848 million. It was the seventh largest and the fifth costliest failure up to that time. In the previous years, those banks, like many in the region, had grown through the use of acquisitions and aggressive real estate lending. They were now being adversely affected by the collapsing real estate market.
The Northeast banking industry continued to struggle with the depressed real estate markets. Return on assets remained steady at just under 30 basis points. Nonperforming assets also remained unchanged at 5 percent of assets, and net charge-offs on loans and leases peaked at 0.4 percent of assets. More than 23 percent (208) of the institutions were considered problem banks. Total lending continued to tighten as total loans and leases in the region were only 65.7 percent of assets. That was due to a drop in Commercial and Industrial (C&I) loans, from 6.3 percent of assets in 1990 to 4.7 percent in 1991. Total real estate loans and commercial real estate loans fell slightly relative to assets but remained well above the national medians.
California was hit hard by the national recession, as well as by reductions in defense spending. In 1991, California had negative GSP growth at -1.8 percent.14-8 Southern California was hit the worst by the defense cutbacks. The state lost 6 percent of its employment base in the recession, and 65 percent of the loss was in the Los Angeles area alone. The most substantial employment losses occurred in manufacturing, with a reduction in 290,300 jobs accounting for 14 percent of manufacturing employment. Particularly hard hit was the high-tech aerospace industry, which lost 25 percent of its jobs.14-9 Many of the defense-related manufacturers worked solely for the Department of Defense and had no fallback market.14-10 Median home prices in California peaked in 1991 at $200,660, approximately six times the nation’s average household income. Home sales were declining, since many residents could not afford to purchase median price homes. Furthermore, uncertainty of future real estate values reduced sale activity to 425,420 sales.14-11 Real estate lending was finally leveling off, but was still much higher than national levels. Total real estate loans were 41 percent of assets, almost 15 percent higher than the national median, and commercial real estate loans were at 25 percent of assets compared with 7.3 percent for the U.S. C&I loans in southern California fell from 17.2 percent of assets in 1990 to 15.7 percent in 1991.
Though the “Big Four” fared comparatively well in the recession, the Los Angeles based banks, Security Pacific and First Interstate, found the recession considerably more damaging. In 1991, Security Pacific recorded a loss of $555 million, and its weakened condition led to its purchase by Bank of America the next year. First Interstate incurred a loss on its California operations with -0.25 ROA, but was able to make a full recovery in the next few years. Wells Fargo’s income dipped to $23 million for the year, while Bank of America reported a return on assets higher than the U.S. banking industry at 0.98.
The number of newly chartered banks fell slightly to 110. Despite the enormous volume of problem bank assets removed from the system through FDIC resolutions and supervision activity in 1991, and some signs that the condition of the banking industry was improving, underlying difficulties continued to trouble the industry. At the end of 1991, about $600 billion in assets were held by problem banks, compared with about $400 billion one year earlier. Moreover, bank exposure to weakened real estate markets in several regions of the country remained substantial. The number of banks on the FDIC’s problem bank list increased slightly to 1,090 at the end of 1991 from 1,046 at the end of 1990. In addition, there were 337 Savings Association Insurance Fund insured savings banks with combined assets of $209 billion on the FDIC’s problem list by the end of 1991.
Table 14-2 shows the number and total assets of FDIC insured institutions, as well as their profitability as of the end of 1991.
Table 14-2
Open Financial Institutions Insured by FDIC ($ in Billions)
| Commercial Banks - FDIC Regulated | |||
|---|---|---|---|
| Item | 1990 | 1991 | Percent Change |
| Number | 12,343 | 11,921 | -3.42% |
| Total Assets | $3,389.5 | $3,430.7 | 1.22% |
| Return on Assets | 0.48% | 0.53% | 10.42% |
| Return on Equity | 7.45% | 7.94% | 6.58% |
| Savings Banks - FDIC Regulated | |||
|---|---|---|---|
| Item | 1990 | 1991 | Percent Change |
| Number | 456 | 449 | -1.54% |
| Total Assets | $229.3 | $217.8 | -5.02% |
| Return on Assets | -0.76% | -0.27% | 64.47% |
| Return on Equity | -10.34% | -3.57% | 65.47% |
| Savings Associations - OTS Regulated | |||
|---|---|---|---|
| Item | 1990 | 1991 | Percent Change |
| Number | 2,359 | 2,112 | -10.47% |
| Total Assets | $1,029.8 | $895.2 | -13.07% |
| Return on Assets | -0.28% | -0.16% | -- |
| Return on Equity | -5.50% | -2.73% | -- |
Percent change is not provided if either the latest period or the year-ago period contains a negative number.
Source: Reports from FDIC Division of Research and Statistics.
Bank Failures and Assistance to Open Banks
In 1991, a new Division of Resolutions (DOR) was created to coordinate the FDIC's response to failed and failing banks. The number of failed banks in 1991 was 124, a decline from 168 in 1990. Reflecting the depressed real estate market and the overall slump in the economy, assets in failed and assisted institutions grew to a record $64.6 billion in 1991, up from $16.9 billion in 1990. That dramatic increase was due to the failure of several large institutions. Estimated losses to BIF for 1991 closures reached a record high of $6.1 billion in 1991.
Of the 124 banks that failed, 103 were resolved with purchase and assumption (P&A) transactions, 24 of which were whole bank deals. Of the remaining 21 failed banks, 17 were resolved through a transfer of insured deposits to another institution, and 4 were payoffs.
In 1991, the FDIC provided open bank assistance (OBA) to three institutions.
- On September 16, First Bank and Trust, Harrisburg, Illinois, a $26.7 million institution, received OBA and was then acquired by a newly formed holding company, Shawnee Bancorp, Inc., of Harrisburg, Illinois.
- On October 2, a $20 million bank, Gunnison Bank and Trust Company, Gunnison, Colorado, was approved for an assistance plan through which Lindoe, Inc., Ordway, Colorado, acquired the bank.
- On December 4, the FDIC assisted a $31.9 million bank, Douglass Bank, Kansas City, Kansas, a minority-owned bank. Part of the assistance plan involved a $2.3 million injection of capital from the bank's parent company, and most of the funds came from nonprofit community organizations.
On May 14, the FDIC announced a public sale of its remaining 26 percent equity holding in Continental Bank Corporation of Chicago. Shortly after the stock was acquired by the FDIC as part of the government’s 1984 assistance package for Continental Illinois National Bank and Trust Company (Continental), the FDIC began to return the stock to private ownership. That sale completed the return and produced a net gain of $200 million over the $1 billion of capital originally provided to Continental. Dividend income on the stock amounted to an additional $202 million. The final net resolution cost to the FDIC was approximately $1.1 billion, or 3 percent of Continental’s assets.14-12
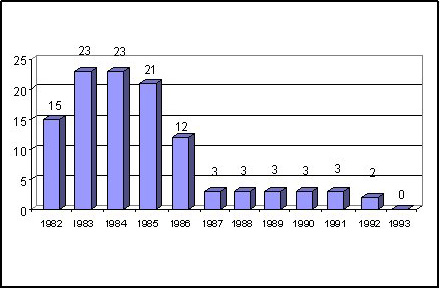
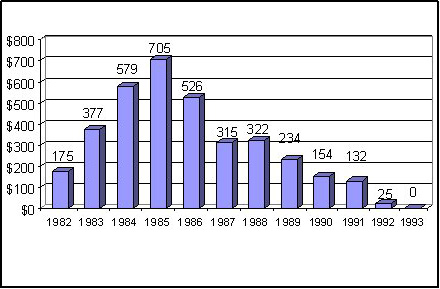
At the end of 1991, there were three institutions remaining in the Net Worth Certificate Program with outstanding certificates of $132 million. The Net Worth Certificate Program, which began in 1982, expired on October 13, 1991. During the program’s ten-year duration, 29 savings banks obtained $718.1 million in certificates.
Figures 14-1 and 14-2 show the total number of banks participating in the program and the dollar amounts per year.
Significant legislative reform that would have a direct impact on the FDIC's activities occurred in 1991. In December, Congress enacted the Federal Deposit Insurance Corporation Improvement Act (FDICIA) of 1991. The legislation had an immediate impact on the resolution process. Specifically, FDICIA established:
- The ?least cost? standard, which was effective upon enactment. Under that standard, the resolution method selected by the FDIC must be the least costly to the deposit insurance fund of all possible methods. Previously, the resolution method needed only to be less costly than a payoff, with an emphasis on selling all assets and causing the least disruption to the community;
- An increase from $5 billion to $30 billion in the FDIC's authority to borrow from the Treasury Department to cover losses in the BIF;
- Authority for the FDIC to borrow money on a short-term basis for working capital, within certain guidelines;
- A requirement that ?prompt corrective action? be taken for insured institutions with capital below prescribed levels;
- A requirement that the FDIC's Board of Directors revise deposit insurance premium rates to recapitalize both the Bank Insurance Fund and the Savings Association Insurance Fund according to statutory limits;
- An increased frequency of required on-site safety and soundness examinations and generally enhanced enforcement standards;
- A requirement that the FDIC begin assessing deposit insurance premiums based on the risks posed to the insurance fund by an institution, in 1994; and;
- Authorization for the FDIC to deny insurance to any applicant, including any national bank or state chartered bank supervised by the Federal Reserve Board.
A recent estimate of losses per transaction type is shown in Table 14-3.
Table 14-3
| 1991 Estimated Losses by Transaction Type ($ in Millions) | ||||
|---|---|---|---|---|
| Transaction Type | Number of Transactions | Total Assets | Estimated Loss* as of 12/31/03 | Estimated Losses as a Percent of Assets |
| OBA | 3 | $78.5 | $3.0 | 8.99% |
| P&As | 103 | 63,039.0 | 5,665.5 | 14.14% |
| IDTs | 17 | 1,445.7 | 447.6 | 30.96% |
| Payoffs | 4 | 71.8 | 20.0 | 27.86% |
| Totals | 127 | $64,635.0 | $6,136.1 | 9.49% |
Percent change is not provided if either the latest period or the year-ago period contains a negative number. Back to table
Source: Reports from FDIC Division of Research and Statistics.
The Office of the Comptroller of the Currency (OCC) closed the three commercial banking subsidiaries of the Bank of New England Corporation, Boston, Massachusetts, on January 6, 1991: Bank of New England, N.A., Boston, Massachusetts; Connecticut Bank & Trust Company, N.A., Hartford, Connecticut; and Maine National Bank, Portland, Maine. Total assets of the banking subsidiaries at the time of the closings were $21.7 billion. The decline of the regional economy and rapid growth in commercial real estate contributed to those failures. The FDIC established three bridge banks and transferred all deposits and most assets of the three institutions to the bridge banks. The FDIC marketed the bridge banks to potential acquirers both as a package and individually. On July 14, 1991, the FDIC Board of Directors closed a P&A transaction for the purchase of the three bridge banks with Fleet/Norstar Financial Group (Fleet), Providence, Rhode Island. The FDIC retained certain assets that were serviced by a subsidiary of Fleet named RECOLL Management Corporation under a servicing agreement with the FDIC.
On May 31, 1991, state regulators closed Goldome, Buffalo, New York, naming the FDIC as receiver. Goldome had assets totaling $9.9 billion. The FDIC arranged the assumption of the deposits by Key Bank of Western New York, National Association, a subsidiary of KeyCorp, Albany, New York. In turn, KeyCorp sold certain branches, assets, and deposits to First Empire State Corporation of Buffalo, the parent company of Manufacturers and Traders Bank, Buffalo, New York. In a situation similar to that of the Bank of New England, the FDIC retained a pool of assets serviced by a subsidiary of Key Bank named Niagara Asset Corporation under a contract that was overseen by the FDIC.
The Financial Institutions Reform, Recovery, and Enforcement Act (FIRREA) of 1989 gave the FDIC the authority to assess Cross Guarantees. The cross guarantee authority was used to recover all or part of the losses incurred by the FDIC in liquidating or aiding a troubled institution from other institutions with the same ownership as the failing institution. Institutions with that type of ownership arrangement also were called ?commonly controlled? institutions. Assessment of cross guarantees sometimes created a liquidity strain, which resulted in failure of the affiliate or, in some cases, immediate insolvency of the affiliate.
On September 19, 1991, the OCC closed Southeast Bank, N.A., Miami, Florida, with $11 billion in assets after the bank was unable to repay a loan from the Federal Reserve Bank of Atlanta. That failure was caused by a liquidity strain rather than a depletion of book capital. In addition, state regulators closed Southeast Bank of West Florida, Pensacola, Florida, which had $97.3 million in assets. Southeast Bank of West Florida was a member of the same bank holding company as Southeast Bank, N.A., and was closed because it was unable to cover its share of the FDIC's anticipated loss from the resolution of the national bank under the cross guarantee provisions.
To accomplish the Southeast resolution, the FDIC arranged two P&A transactions with First Union National Bank of Florida, Jacksonville, Florida. The FDIC used a new resolution method for the first time, a loss share arrangement designed to keep bank assets in the private sector and to maximize their value. Under the loss share arrangement, First Union purchased $10 billion of the assets, including problem loans. The FDIC agreed to reimburse First Union for 85 percent of the net charge-offs from the failed banks' portfolios over the next five years, with First Union absorbing 15 percent of the loss during that time period. First Union agreed to reimburse the FDIC for its portion of recoveries received for an additional two years. The loss sharing was slightly different for credit card debt and home equity loans. The loss share percentage declined by 5 percent per year from 85 percent in the first year to 65 percent in the fifth year.
The Loss Share Transaction was designed to address problems associated with marketing large banks that typically had sizeable commercial loan and commercial real estate portfolios. Acquiring institutions had been reluctant to acquire commercial assets in FDIC transactions for three main reasons: limited due diligence periods; questionable underwriting criteria of the failed bank; and questionable commercial real estate markets in the late 1980s and early 1990s. In a Loss Share Agreement, the FDIC agreed to absorb a significant portion, typically 80 percent, of any credit losses on certain loans.
The 1991 recession was particularly severe in New Hampshire, where 12 banks failed. Seven New Hampshire banks, with assets totaling $4.8 billion, were resolved on October 10, 1991. To accomplish the resolution, the FDIC developed the ?New Hampshire Plan,? grouping the failed banks together and marketing them to potential acquirers as two separate franchises. The seven banks were resolved as follows: the four commercial banks became branches of First NH Bank, Concord, New Hampshire, a U.S. subsidiary of The Bank of Ireland, Dublin, Ireland. Three savings banks were assumed by New Dartmouth Bank, Manchester, New Hampshire. Both of those transactions were unusual because the FDIC packaged unaffiliated banks in two franchises for sale instead of marketing the banks individually. The transactions also included loss sharing provisions applying to consumer and residential mortgage loans totaling $1.5 billion original balance, or $1.7 billion with permitted advances and additions, and a servicing contract applying to $1.6 billion in assets.
Table 14-4
New Hampshire Plan ($ in Millions)
| Shared Loss Assets - Consumer Loans and Residential Mortgages | |
|---|---|
| Acquiring Bank | Amount |
| New Dartmouth Bank | $912.3 |
| First NH Bank | $623.9 |
| Total | $1,536.2 |
| Servicing Contract | |
|---|---|
| Contract Servicer | Amount |
| BONHAM - New Hampshire I | $745.0 |
| BONHAM - New Hampshire II | $831.0 |
| Total | $1,576.0 |
Source: Reports from FDIC Division of Resolutions and Receiverships.
The resolutions of the seven New Hampshire banks involved 28 percent of the state's deposits. The cost to BIF for the resolution of the seven New Hampshire banks was close to $891 million--$319 million for the Concord Franchise and $572 million for the Manchester Franchise. The FDIC also agreed to purchase preferred stock of the acquiring institutions so the institutions could obtain the necessary capital for the transactions.
In the New Hampshire Plan, a third party, Bank One New Hampshire Asset Management (BONHAM) was appointed under a servicing contract monitored by the FDIC to be manager of the failed banks' classified assets, repossessed real estate, all subsidiaries, and unwanted bank premises.
The New Hampshire Plan was significant because it was the first time the FDIC solicited bidders for the servicing contract who were not also bidding to be an assuming bank. The FDIC presented different plans for which bidders could submit a proposal. The winning bid was the most beneficial to the FDIC from a cost standpoint. That type of bidding arrangement also was used at a subsequent resolution in Connecticut.
Payments to Depositors and Other Creditors
In the 127 banks that failed or were assisted in 1991, deposits totaled $50 billion in 6,277,960 deposit accounts. There were three assistance agreements with total deposits of $75.7 million. Payoffs accounted for four transactions with 6,050 deposit accounts with total deposits of $66.9 million. Dividends paid on all active receiverships totaled $34.6 billion in 1991.
Of the 1,940 insured bank resolutions 14-13 since the FDIC began operations in 1934, 1,098 were P&A transactions and 197 additional transactions were whole bank deals. There were 573 deposit payoff transactions, including 162 IDTs. Also, there have been 72 OBA transactions since 1981.
Disbursements by the FDIC since January 1, 1934, amounted to $86.5 billion. Of that amount, the FDIC recovered $51 billion, for a net loss of $35.5 billion.
Asset Disposition
At the beginning of 1991, the FDIC had $30.9 billion in failed bank assets for both BIF and the FSLIC Resolution Fund (FRF). During the year, the FDIC handled 124 bank closings with $64.6 billion in total assets; the FDIC acquired $28.6 billion in assets for liquidation from those failed banks. At the end of 1991, total assets in liquidation totaled $43.3 billion, which included $34.4 billion in BIF assets and $8.9 billion in FRF assets.
On December 12, 1991, the largest real estate auction in the FDIC's history to date was held in Dallas, Texas, to liquidate properties with an aggregate appraised value of $500 million. The properties sold at the auction were located in 23 states. Arrangements had been made for potential bidders to review the properties before the sale. On auction day, satellite hookups were established in five cities, attracting 1,000 bidders. The FDIC offered financing to bidders, increasing the ability of buyers to purchase property during a period in which financing real estate was becoming more difficult. The FDIC used that method in subsequent real estate auctions, but also provided a 5 percent discount from the sales price to bidders who arranged their own financing. Seller financing was targeted only for assets with appraised values exceeding $500,000.
The FDIC continued to contract with servicers to manage its portfolio of performing mortgages with a total book value of $2.7 billion. During 1991, the national sales center in Irvine, California, sold 7,600 of those loans for $401 million. The book value was $429 million and the appraised value was $404 million. The sales price equaled 93.5 percent of the book value and 99.3 percent of the appraised value.
In addition to the performing loan servicing contractors, the FDIC oversaw other third-party contractors who administered, managed, and collected pools of nonperforming assets totaling $13.3 billion in assets. Total assets managed by all outside servicers totaled $16 billion at the end of 1991, or about 37 percent of total assets in liquidation.
The various FDIC offices sold 143,460 loans in 1991 with a total book value of $2.1 billion for a price of $1.5 billion, or 71.4 percent of book value. In addition to the Dallas national real estate auction, the FDIC sold 6,885 owned real estate properties for $1 billion, or 98 percent of appraised value.
In 1991, the FDIC collected $300 million through professional liability claims and by pursuing criminal matters arising from the alleged actions of directors, accountants, and others responsible for losses at failed insured institutions.
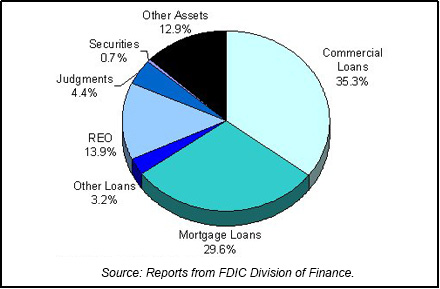
Table 14-5 shows the FDIC's assets in liquidation and Chart 14-1 shows the asset mix.
Table 14-5
| 1991 FDIC End of the Year Assets in Liquidation ($ in Billions*) | ||||||
|---|---|---|---|---|---|---|
| Asset Type | 12/31/90 Book Value | 1991 Assets Acquired | 1991 Prin. Coll. | 1991 Write Downs | 12/31/91 Book Value | 12/31/91 Est. Rec. Value |
| Commercial Loans | $7.9 | $11.4 | $1.8 | $2.2 | $15.3 | $9.4 |
| Mortgage Loans | 12.7 | 3.5 | 2.1 | 1.3 | 12.8 | 5.6 |
| Other Loans | 0.8 | 1.7 | 1.0 | 0.1 | 1.4 | |
| Real Estate Owned | 4.5 | 3.7 | 0.9 | 1.3 | 6.0 | 4.4 |
| Judgments | 1.3 | 1.2 | 0.0 | 0.6 | 1.9 | |
| Securities | 0.9 | 0.4 | 1.0 | 0.0 | 0.3 | 0.1 |
| Other Assets | 2.8 | 6.7 | 0.7 | 3.2 | 5.6 | 5.6 |
| Totals | $30.9 | $28.6 | $7.5 | $8.7 | $43.3 | $25.1 |
Source: Reports from FDIC Division of Finance.
Insurance Fund and Staffing
By the end of 1991, problem banks were holding $600 billion in assets, compared with $400 billion in 1990. Consequently, the FDIC decided to reserve for high levels of risk to BIF and began to set aside reserves not only for banks certain to fail in the near future, but also for those banks that were weak but not yet failing. As a result, BIF decreased to a negative $7 billion, the first negative balance since the FDIC's inception in 1934.
The FDIC's liquidity problem, which stemmed from a record number of bank failures from 1984 through 1990, was eased on January 8, 1991, when the FDIC entered into a Note Purchase Agreement with the Federal Financing Bank. The Note Purchase Agreement permitted the FDIC to borrow to meet its financing requirements. That provided the FDIC with the ability to fund the acquisition of assets from failed institutions and to cover the cost of carrying those assets on the records of the FDIC. That obligation was fully satisfied on August 6, 1993.
By the end of 1991, the FDIC's Division of Liquidation had four regional offices and 16 consolidated offices. During 1991, the consolidated offices in Knoxville, Tennessee, and Midland, Texas, were closed. However, consolidated office was opened in Hartford, Connecticut.
The Legal Division of the FDIC, which had been handling the legal affairs of both the FDIC and the RTC, was separated into two legal divisions, one for each entity, during 1991. A total of 1,572 positions were transferred to the new RTC Legal Division. After those shifts of personnel, there was a 19 percent net increase in Legal Division staff devoted to FDIC matters during the year. The Legal Division added 143 staff members devoted to professional liability cases. They were placed in FDIC offices around the country to improve supervision of those cases.
The Legal Division's Professional Liability Section worked to identify claims against directors and officers, appraisers, attorneys, accountants, and other professionals who may have contributed to the failure of insured financial institutions. The unit investigated the circumstances surrounding the failure of every institution and, where appropriate, sent criminal referrals to the Department of Justice. The Professional Liability Section also pursued administrative enforcement actions and professional liability proceedings.
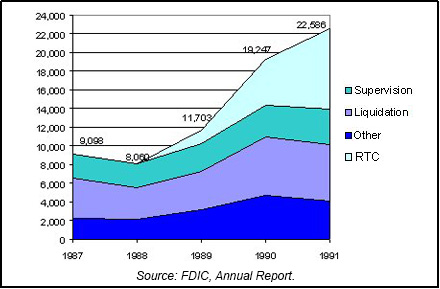
Total FDIC staffing, excluding the RTC, at the end of 1991 was 13,972, compared with 14,348 at the end of 1990. The number of Division of Supervision employees increased to 3,813 from 3,400 the previous year. The number of Division of Liquidation employees dropped to 6,097 from 6,311. Total staffing including 8,614 RTC employees equaled 22,586. Chart 14-2 shows the staffing levels for the past five years.
Table 14-6
Resolution Trust Corporation
| 1990 - 1991: RTC at a Glance ($ in Millions) | |||
|---|---|---|---|
| 12/31/90 | 12/31/91 | Percent Change | |
| Number of Conservatorships at the beginning of the year | 281 | 179 | -36.30% |
| Number of Conservatorships added during the year | 207 | 123 | -40.58% |
| Thrifts in the ARP Program |
6 |
21 | 250.00% |
| Total of all thrift takeovers | 213 | 144 | -32.39% |
| Total of thrift resolutions | 315 | 232 | -26.35% |
| Conservatorships resolved during the year | 309 | 211 | -31.72% |
| Conservatorships at the end of the year | 179 | 91 | -49.16% |
| Total Assets at Takeover | |||
|---|---|---|---|
| 12/31/90 | 12/31/91 | Percent Change | |
| Conservatorships | $126,616 | $70,929 | -43.98% |
| Thrifts in the ARP Program | $3,631 | $8,105 | 123.22% |
| Total | $130,247 | $79,034 | -39.32% |
| Estimated losses on thrift resolutions |
$20,837 | $10,773 | -48.30% |
| Estimated losses as a percent of total assets | 16.00% | 13.63% | -14.81% |
| Assets in Liquidation | |||
|---|---|---|---|
| 12/31/90 | 12/31/91 | Percent Change | |
| Conservatorships | $87,467 | $47,318 | -45.90% |
| Receiverships | $59,270 | $83,066 | 40.15% |
| Total | $146,737 | $130,384 | -11.14% |
| RTC Staffing | 4,899 | 8,614 | 75.83% |
Source: RTC, 1990 Annual Report and Reports from FDIC Division of Research and Statistics.
Notable Events
The RTC's organizational structure changed in 1991. In October, Chairman Seidman ended his term as chairman of both the FDIC and the RTC, and Albert V. Casey became the first President of the RTC. Mr. Casey subsequently became the RTC's chief executive officer on February 1, 1992, pursuant to the passage of the RTC Refinancing, Restructuring, and Improvement Act (RTCRRIA) of 1991.
Significant provisions of RTCRRIA included the following:
- Funding of $25 billion through April 1, 1992;
- Ability to accept appointment as conservator or receiver from August 9, 1992, to September 30, 1993;
- Redesignation of the RTC Oversight Board as Thrift Depositor Protection Oversight Board, and redefinition of its membership;
- Abolishment of the RTC Board of Directors and removal of the FDIC as exclusive manager of the RTC, creating more independence for the RTC; and
- Creation of the office of chief executive officer of the RTC.
S&L Resolutions
At the beginning of 1991, the RTC managed 179 thrifts in the conservatorship program and an additional 123 thrifts with total assets of $70.9 billion were placed into conservatorship during the year. Of the conservatorships, 211 were resolved by year end. In addition, 21 thrifts were resolved through the Accelerated Resolution Program (ARP) during the year without ever being in conservatorship. During 1991, the RTC resolved a total of 232 thrifts (compared to 315 in 1990) with total deposits of $71.3 billion.
The 165 P&A transactions involved thrifts with total assets of $61 billion. IDTs accounted for 34 failed thrift transactions with total assets of $14.6 billion. The 33 institutions which were paid off in 1991 had assets of $2.5 billion. The number of payoffs for 1991 had declined from 47 in 1990.
More than $700 million in premiums was collected from the acquiring institutions, representing about 1.39 percent of the assumed core deposits. Overall, the resolution transactions generated an estimated $809 million in savings in 1991 over the estimated cost of deposit payoffs for the 232 resolved thrifts.
Nearly 25 percent of the total number of assuming bank transactions (48 resolutions) were resolved on a branch breakup basis (compared to 35 branch breakups in 1990). In the most complex transaction, 22 institutions acquired the nearly $1 billion in deposits at the 32 offices of First Savings of Arkansas, Little Rock, Arkansas.
The largest resolution of 1991 was City Savings Bank, F.S.B. (formerly City Savings), Somerset, New Jersey, with $4.4 billion in deposits and 109 offices. The next largest resolution in 1991 was Columbia Savings & Loan Association, Beverly Hills, California, with $4.2 billion in deposits.
Losses per transaction type are shown in Table 14-7 and Table 14-8 shows conservatorships and receiverships at year-end 1991.
Table 14-7
| 1991 Losses by RTC Transaction Type ($ in Millions) | ||||
|---|---|---|---|---|
| Transaction Type | Number of Transactions | Total Assets | Loss* as of 12/31/95 | Estimated Losses as a Percent of Assets |
| P&As | 165 | $60,954.0 | $22,704.2 | 37.25% |
| IDTs | 34 | 14,648.6 | 6,541.1 | 44.65% |
| Payoffs | 33 | 2,507.7 | 2,283.7 | 91.11% |
| Totals | 232 | $78,110.3 | $31,529.0 | 40.36% |
Source: Reports from FDIC Division of Research and Statistics.
Table 14-8
| Conservatorships | |
|---|---|
| Item | Total |
| In Conservatorship at 12/31/90 | 179 |
| Conservatorships added in 1991 | 123 |
| Subtotal | 302 |
| Conservatorships resolved in 1991 (New Receiverships) | 211 |
| Conservatorships remaining 12/31/91 | 91 |
| Receiverships | |
|---|---|
| Item | Total |
| Receiverships as of 12/31/90 | 352 |
| New Receiverships that were previously Conservatorships in 1991 | 211 |
| New Receiverships that were resolved through ARP in 1991 | 21 |
| Total Receiverships during 1991 | 232 |
| Total Receiverships as of 12/31/91 | 584 |
Source: Reports from FDIC Division of Research and Statistics.
Payments to Depositors and Other Creditors
In 1991, there were 232 resolutions with total deposits of $17.3 billion in 7,515,869 deposit accounts. Of that total, there were 33 payoff transactions with $2.9 billion in total deposits in 280,729 deposit accounts. Of the 584 insured thrift failures since the RTC began operations in August of 1989, a total of 344 were P&A transactions, 84 were payoff transactions, and 156 were IDTs.
Asset Disposition
At the beginning of 1991, the RTC had $146.7 billion in assets in liquidation. Assets acquired during the year through conservatorships, other resolved institutions, and putbacks or repurchases totaled $105.9 billion. Losses and collections totaled $122.2 billion for the year. By the end of 1991, the RTC's total for assets in all receiverships and conservatorships was $130.4 billion.
By the end of 1991, the RTC had awarded 166 contracts under the basic Standard Asset Management Disposition Agreement (SAMDA) program, covering assets of $33.4 billion book value from receiverships and conservatorships. The estimated recovery by those contractors was $19 billion. An additional 30 contracts to manage $4.6 billion in assets were in the solicitation process at the end of the year.
In January 1991, the RTC's Board of Directors approved several revisions of the SAMDA program. In particular, the RTC changed contractor incentive compensation so that the estimated recovery value would be based on the contractor's entire asset pool instead of on individual assets. As a result of those changes, the goal of contractors changed to settling all assets instead of merely focusing their efforts on only the high value assets. The other major change was the inclusion of a holding cost that decreased the disposition fee over time.
During 1991, the RTC's seller financing program became fully operational. The RTC sold and financed 1,432 real estate assets between January 1, 1990, and December 31, 1991. Those assets generated an aggregate recovery of $617 million, of which about 20 percent, or $121 million, was down payments, and about 80 percent, or $496 million, was seller financing.
In February 1991, the RTC Oversight Board authorized the RTC to sell residential mortgage assets through private securitizations. In June, the first shelf registration statement to issue private label mortgage-backed securities was filed with the Securities and Exchange Commission, and the RTC's securitization program began.
In June 1991, the RTC initiated its residential securitization program, issuing securities backed by single-family and multi-family mortgages. On June 27, the first single-family securitization, RTC 1991-1, was originated. That mortgage-backed security was AA rated, received prices above par, and was backed by $440 million in mortgages from one RTC conservatorship, Columbia Savings & Loan Association, Beverly Hills, California. On July 30, RTC 1991-2 was originated for $580 million. Foreign investors became interested in RTC 1991-2 because for the first time all interest payments were based upon a standard index, the London Interbank Offered Rate (LIBOR). The mortgage loans collateralizing that issue were from three receiverships. On August 29, the RTC completed a multi-family mortgage loan securitization, RTC 1991-M1.
Securitization involved the pooling of similar receivership and conservatorship mortgage loans into trusts for sale. The trustee then issued securities backed by those mortgages. Usually, one-to-four family mortgages, multi-family housing, commercial properties, and consumer loans were pooled separately.
In 1991 alone, the RTC issued $7.6 billion of single-family certificates at a weighted average price of 100.4 percent of outstanding principal balances. In addition, $2.6 billion of multi-family certificates were issued at a weighted average price of 100.6 percent. By the end of the year, the RTC had sold more than $10 billion in mortgage-backed securities.
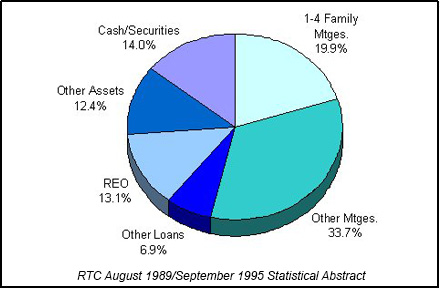
At the end of the year, the RTC had a total of $130.4 billion in receivership and conservatorship assets under its control. Table 14-9 shows the RTC's assets in liquidation and Chart 14-3 shows the asset mix.
Table 14-9
| 1991 RTC End of the Year Assets in Liquidation ($ in Billions*) | ||||||
|---|---|---|---|---|---|---|
| Asset Type | 12/31/90 Total Book Value | Assets Acq'd During the Year | 1991 Collections | 1991 Losses | 12/31/91 Total Book Value | Memo Item |
| 1-4 Family Mtges | $40.0 | $29.0 | $40.5 | $2.6 | $25.9 | $19.5 |
| Other Mtges | 36.6 | 20.4 | 11.5 | 1.6 | 43.9 | 16.4 |
| Other Loans | 11.2 | 7.2 | 7.8 | 1.6 | 9.0 | 4.8 |
| Real Estate Owned | 18.1 | 7.3 | 3.8 | 4.5 | 17.1 | 5.6 |
| Other Assets | 12.0 | 6.2 | 5.5 | -3.5 | 16.2 | 9.3 |
| Cash/Securities | 28.8 | 35.8 | 45.2 | 1.1 | 18.3 | 14.4 |
| Totals | $146.7 | $105.9 | $114.3 | $7.9 | $130.4 | $70.0 |
Memo Item: Assets transferred from conservatorship to receivership. Does not affect total of assets in liquidation.
Source: RTC August 1989/September 1995 Statistical Abstract.
Figure 14-3: 1991 RTC End of Year Asset Mixd
Funding and Staffing
As of December 31, 1991, the Treasury had contributed $48.8 billion in capital to the RTC. Of this total, $18.8 billion had been authorized by FIRREA, and another $30 billion had been authorized by the RTC Funding Act of 1991. Additionally, the RTC had $31.2 billion in capital certificates issued to the Resolution Funding Corporation, $7 billion of which were issued in 1991. By the end of 1991, staffing levels had reached about 8,600 employees, roughly doubling the 4,899 employees at the end of 1990.
14-1 Bureau of Economic Analysis, Department of Commerce. Back to Text
14-2 CB Commercial Torto/Wheaton Research and Bureau of Labor Statistics, Department of Labor. Back to Text
14-3 Housing Market Statistics, National Association of Home Builders (June 1996), and Federal Home Loan Mortgage Corporation. Back to Text
14-4 Bureau of Labor Statistics, Department of Labor. Back to Text
14-5 Housing Market Statistics, National Association of Home Builders (June 1996), and CB Commercial Torto/Wheaton Research. Back to Text
14-6 Bureau of Economic Analysis, Department of Commerce. Back to Text
14-7 Not including Continental Illinois National Bank and Trust Company, which technically did not fail. Back to Text
14-8 Bureau of Economic Analysis, Department of Commerce. Back to Text
14-9 California Employment Development Department. Back to Text
14-10 Stephen S. Cohen, et. al., From Boom to Bust in the Golden State, (1993) 3. Back to Text
14-11 California Association of Realtors, Research and Economics Department, California Existing Single-Family Housing Market Historical Data Summaries, (March 1995). Back to Text
14-12 The $1.1 billion resolution cost is from the FDIC Division of Finance “Analysis of Large Assistance Transactions” (Black Book), which is included in the Bank Insurance Fund audited financial statements for the period ended December 31, 1995. Back to Text
14-13 This figure does not include five open bank assistance transactions from 1934-1980. Also, in 1988 there were 21 assistance agreements that resolved 79 institutions. The FDIC annual report (source data) calculates failure data per transaction; this report calculates failures per failed institution. Back to Text
Table of Contents