
Managing the Crisis: The FDIC and RTC Experience — Chronological Overview
Chapter Fifteen: 1992
For the first time in the history of the FDIC, the Bank Insurance Fund (BIF) dropped below zero to a negative $7 billion. On April 30, 1991, the FDIC issued a regulation raising the deposit insurance assessment rate from 19.5 cents to 23 cents per $100 in assessable deposits. That increase in assessment revenue was designed to help offset BIF losses, which had been outpacing revenue since 1984.
Table 15-1
| 1991 - 1992: FDIC at a Glance ($ in Millions) | |||
|---|---|---|---|
| 12/31/91 | 12/31/92 | Percent Change | |
| Number of Bank Failures | 124 | 120 | -3.23% |
| Assistance to Open Banks | 3 | 2 | -33.33% |
| Total Failed and Assisted Banks | 127 | 122 | -3.94% |
| Total Assets of Failed and Assisted Banks | $64,635.0 | $45,391.1 | -29.77% |
| Estimated Losses on Failed and Assisted Banks |
$6,136.1 | $3,675.2 | -40.11% |
| Estimated Losses as a Percent of Total Assets | 9.49% | 8.10% | -14.65% |
| Assets in Liquidation | $43,258.3 | $43,273.4 | 0.03% |
| FDIC Staffing | 13,972 | 15,044 | 7.67% |
| Number of Problem Banks | 1,090 | 863 | -20.83% |
| Bank Insurance Fund Balance | -$7,027.9 | $-100.6 | 98.57% |
| Bank Insurance Fund Balance as a Percent of Insured Deposits | -0.36% | -0.01% | 97.22% |
Source: FDIC, 1992 Annual Report and Reports from FDIC Division of Finance and Division of Research and Statistics.
Notable Events
After only ten months as chairman of the FDIC, William Taylor passed away on August 20, 1992. Chairman Taylor was praised and admired as a dedicated public servant and a man of integrity. Vice Chairman Andrew C. Hove, Jr., was appointed acting chairman, a position he would hold for two years. Prior to his appointment as vice chairman, Mr. Hove had been in banking for 30 years and was chairman and chief executive officer of the Minden Exchange Bank & Trust Company, Minden, Nebraska.
Economic/Banking Conditions
The U.S. economy began to turn around in 1992 with Gross Domestic Product (GDP) growing at a modest 2.7 percent, which was a substantial improvement over the previous year’s GDP growth rate of -0.97 percent.15-1 Despite the increase in GDP growth, the unemployment rate continued to rise from 6.8 percent in 1991 to 7.5 percent in 1992.15-2 The spur to the economy can be attributed in part to a resurgence in the housing sector brought about by a decline in interest rates and the inflation rate. The discount rate fell from 5.5 percent to 3.3 percent, and the 30-year mortgage rate fell from 9.3 percent to 8.4 percent. The inflation rate also declined from 4 percent to 2.8 percent.15-3 Housing sales and housing starts showed dramatic improvements, going from no growth in 1991 to 10.8 percent and 18.3 percent in 1992, respectively. The office vacancy rate also stabilized at 18.5 percent.15-4
The Southwest banking industry continued to have problems, even though the number of failures continued to decrease and was down from 41 in 1991 to 36. Gross State Product (GSP) growth in the Southwest was consistent with GDP for the nation at 2.7 percent.15-5 Total lending, relative to assets, continued to decline while total real estate lending increased slightly to 27.7 percent of assets, though still well below the national median of 49.9 percent. Nonperforming assets relative to total assets continued to decline, as did net charge-offs on loans and leases for the region.
There were 43 failures in the Northeast in 1992, many of which were attributed to huge losses from nonperforming real estate loans. Those failures accounted for 79 percent of all U.S. resolution costs in that year. The Northeast banking industry was beginning to recover, however, with increases in return on assets and asset growth and decreases in nonperforming assets and net charge-offs on loans and leases. But none of those trends could measure up to the levels of the rest of the U.S. banking industry. Lending continued to tighten with continuing decreases in Commercial and Industrial (C&I) loans and steady levels of total real estate and commercial real estate loans. The Northeast was coming out of its recession, but the region still under-performed the U.S. in overall production growth.15-6
California experienced negative GSP growth for the second year in a row.15-7 While the U.S. was bouncing back from the recession, California was not. By September, the state’s unemployment rate reached 9.5 percent, 2 percent higher than the national level. Many of California’s banks were not healthy. Commercial banks in the state reported $22 million in losses. Recently chartered banks, especially those in the southern part of the state, were vulnerable due to their poor earnings going into the recession. In Southern California, nonperforming assets peaked at around 5.5 percent of
total assets. There were 12 bank failures in the state, including Independence Bank, Encino, California, the largest ($564 million in assets) and costliest ($140 million estimated loss) California bank failure ever. More than 26 percent of all of the banks in the state were considered problem banks.
First Interstate resumed marginally profitable operations in 1992, with a return on assets of 0.07 percent. Bank of America also reported net income on California operations of $1.3 billion, and Wells Fargo reported net income of $306 million. The diversification of those “Big Four” banks helped them to withstand the pressures of the recession while smaller regional banks could not. Lending in the state began to tighten with total real estate loans holding steady at 40.5 percent of assets and commercial real estate loans remaining unchanged at 25 percent. C&I loans continued their gradual decline from 15.7 percent in 1991 to 13.5 percent in 1992.
The number of new charters granted declined from 110 to 74. During 1992, the FDIC did not have an operating loss for the first time in five years and the profitability and solvency of commercial banks improved significantly. As a result, the FDIC viewed 1992 as a year in which the commercial banking industry began to get stronger overall.
In 1992, although a large number of banks failed, many banks benefited from favorable interest rates and improved asset quality, and they showed record profits. The number of commercial banks on the FDIC’s problem bank list declined by 227 institutions in 1992, to 863, which was the lowest number on the list since 1983. Although savings banks insured by the Bank Insurance Fund (BIF) also reported their first profit in four years, there were still some problems. Problem savings banks accounted for more than 26 percent of savings banks’ assets, and 22 BIF insured savings banks failed in 1992. In addition, there were 207 Savings Association Insurance Fund (SAIF) insured savings banks with combined assets of $128 billion on the FDIC’s problem list by the end of 1992.
The number of newly chartered banks fell slightly to 110. Despite the enormous volume of problem bank assets removed from the system through FDIC resolutions and supervision activity in 1991, and some signs that the condition of the banking industry was improving, underlying difficulties continued to trouble the industry. At the end of 1991, about $600 billion in assets were held by problem banks, compared with about $400 billion one year earlier. Moreover, bank exposure to weakened real estate markets in several regions of the country remained substantial. The number of banks on the FDIC’s problem bank list increased slightly to 1,090 at the end of 1991 from 1,046 at the end of 1990. In addition, there were 337 Savings Association Insurance Fund insured savings banks with combined assets of $209 billion on the FDIC’s problem list by the end of 1991.
Table 15-2 shows the number and total assets of FDIC insured institutions, as well as their profitability as of the end of 1991.
Pursuant to the Federal Deposit Insurance Corporation Improvement Act (FDICIA) of 1991, the FDIC Board of Directors approved the prompt corrective action rule on September 15, 1992. On December 19, 1992, the prompt corrective action rule took effect. Expectations of multiple bank failures triggered by the new rule (the so called “December Surprise”) failed to materialize. At the end of 1992, the FDIC revised downward the estimated liability to the BIF for troubled banks to $10.8 billion from the 1991 liability estimate of $16.3 billion.
Prompt Corrective Action was a requirement that an institution be closed by regulators if it was “critically undercapitalized” and was determined not to have an adequate capital restoration plan. In general, a critically undercapitalized institution was defined as having a “tangible equity” to total assets ratio of 2 percent or less.
Table 15-2 shows the number and total assets of FDIC insured institutions, as well as their profitability as of the end of 1992.
Table 15-2
Open Financial Institutions Insured by FDIC ($ in Billions)
| Commercial Banks - FDIC Regulated | |||
|---|---|---|---|
| Item | 1991 | 1992 | Percent Change |
| Number | 11,921 | 11,462 | -3.85% |
| Total Assets | $3,430.7 | $3,505.7 | 2.19% |
| Return on Assets | 0.53% | 0.93% | 75.47% |
| Return on Equity | 7.94% | 12.98% | 63.48% |
| Savings Banks - FDIC Regulated | |||
|---|---|---|---|
| Item | 1991 | 1992 | Percent Change |
| Number | 449 | 518 | 15.37% |
| Total Assets | $217.8 | $218.2 | 0.18% |
| Return on Assets | -0.27% | 0.74% | -- |
| Return on Equity | -3.57% | 9.35% | -- |
| Savings Associations - OTS Regulated | |||
|---|---|---|---|
| Item | 1991 | 1992 | Percent Change |
| Number | 2,112 | 1,872 | -11.36% |
| Total Assets | $895.2 | $812.0 | -9.29% |
| Return on Assets | 0.16% | 0.63% | 293.75% |
| Return on Equity | 2.73% | 9.53% | 249.08% |
Percent change is not provided if either the latest period or the year-ago period contains a negative number.
Source: Reports from FDIC Division of Research and Statistics.
Bank Failures and Assistance to Open Banks
During 1992, the FDIC resolved 120 failed banks and provided assistance to 2 open banks in danger of failing. Those numbers were similar to those of 1991. Although total assets of failed and assisted banks decreased in 1992 to $45.4 billion from the record levels of $64.6 billion in 1991, the 1992 number was still the second highest in the FDIC's history, primarily due to the increased number of failed savings banks.
Of the 120 failed banks, 95 were purchase and assumption (P&A) transactions, including 5 whole bank deals. The FDIC used a variation of the P&A transaction in 36 of the 95 P&A transactions. That variation was called an “insured deposit purchase and assumption” in which the assuming bank received only the insured deposits rather than all deposits. The traditional insured deposit transfer (IDT) method was used in 14 resolutions, and payoffs accounted for the remaining 11 transactions.
Only two institutions received open bank assistance (OBA) in 1992: the $20.9 million asset Freedom Bank, Ranger, Texas; and the $12.9 million asset Citizens State Bank, Princeton, Texas. Because of the cost savings inherent in a closed bank transaction, it was difficult to judge an open assistance proposal the least costly, particularly when the institution's failure was imminent (that is, the possibility of a second resolution increased the proposed cost of the initial OBA.) Therefore, for an OBA proposal to be acceptable, it generally had to be submitted well before grounds existed for the institution's closure.
A recent estimate of losses per transaction type is shown in Table 15-3.
Table 15-3
| 1992 Estimated Losses by Transaction Type ($ in Millions) | ||||
|---|---|---|---|---|
| Transaction Type | Number of Transactions | Total Assets | Estimated Loss* as of 12/31/03 | Estimated Losses as a Percent of Assets |
| OBA | 2 | $33.8 | $0.3 | 0.89% |
| P&As | 95 | 43,240.1 | 3,182.8 | 7.36% |
| IDTs | 14 | 962.8 | 223.4 | 23.20% |
| Payoffs | 11 | 1,154.4 | 268.7 | 23.28% |
| Totals | 122 | $45,391.1 | $3,675.2 | 8.10% |
Source: Reports from FDIC Division of Research and Statistics.
In out the requirements of FDICIA, FDIC encouraged all bidders to submit not only proposals to assume all deposits, but also proposals to assume only insured deposits. As a direct result of FDICIA's “least cost test,” the number of uninsured depositors experiencing a loss increased substantially in 1992. Uninsured depositors in 66 of 120 failures received less than 100 cents on each dollar above the $100,000 insurance limit. That was a significant increase from 1991, when less than 20 percent of the failures involved a loss for uninsured depositors. Because of that development, in March 1992, the FDIC resumed the practice of paying advance dividends to uninsured depositors and unsecured creditors. Advance dividends were paid at 50 percent to 80 percent of the claim amounts. The FDIC based the dividend percentage on an estimate of the value of each failed bank's assets to be liquidated.
The Least Cost Test was a FDICIA requirement that the FDIC pursue the least costly resolution of a failed institution. Prior to FDICIA, the FDIC could pursue any resolution alternative, as long as it was less costly than a payoff of insured deposits and the liquidation of the assets. Under the new law, the FDIC was required to review all proposals received and compare them to each other and to the cost of a payoff. The FDIC then chose the alternative with the least cost to the FDIC.
Among the 120 institutions resolved in 1992 were six banking organizations with total assets of more than $3 billion. Five of the six were savings banks as depicted as follows:
- On January 24, CrossLand Savings Bank, F.S.B., Brooklyn, New York, with total assets of $7.4 billion was closed. The FDIC established a full service savings bank (an FDIC conservatorship) that assumed the assets, deposits, and certain liabilities of CrossLand Savings.
- On February 21, Dollar Dry Dock Bank, White Plains, New York, a savings bank with total assets of $4 billion was closed. Emigrant Savings Bank, New York, New York, acquired certain assets and assumed deposits and certain other liabilities. Apple Savings Bank of New York, New York, also acquired one of the failed bank's twenty-one branches.
- On June 12, American Savings Bank, White Plains, New York, with total assets of $3.2 billion was closed. The FDIC sold the savings bank's insured deposits to eight different banks in New York and New Jersey.
- On October 2, The Howard Savings Bank, Newark, New Jersey, with total assets of $3.5 billion was closed. First Fidelity Bank, N.A., of Newark, New Jersey, acquired certain assets and assumed the deposits.
- On October 30, twenty bank subsidiaries of First City Bancorporation of Texas, Inc., (First City) Houston, Texas, were closed. First City, with $8.1 billion in total assets, was one of the largest failed bank transactions in the FDIC history and failed only four years after the FDIC had provided a $970 million assistance package to the affiliated banks. The FDIC established 20 new full service bridge banks, which eventually were sold to various acquirers.
- On December 11, Meritor Savings Bank, Philadelphia, Pennsylvania, with total assets of $4.1 billion was closed. Mellon Bank, N.A., of Pittsburgh, Pennsylvania, acquired certain assets and assumed the deposits.
Payments to Depositors and Other Creditors
In the 122 banks that failed or were assisted in 1992, deposits totaled $40 billion in 4,280,325 deposit accounts. There were two assistance agreements for banks with total deposits of $33.1 million in 6,571 deposit accounts. Payoffs accounted for 11 transactions with 74,790 deposit accounts with total deposits of $1.1 billion. Dividends paid on all active receiverships totaled $28.8 billion in 1992.
Of the 2,067 insured bank resolutions15-8 since the FDIC began operations in 1934, there were a total of 1,188 P&A transactions and 202 whole bank deals. Deposit payoff transactions accounted for 598 cases, of which there were 176 IDTs. There were also 79 OBA transactions.
Total disbursements by the FDIC since January 1, 1934, amounted to $100.4 billion. Of that amount, the FDIC recovered $62.8 billion, for a net loss of $37.6 billion.
Asset Disposition
As of the beginning of 1992, the FDIC held $43.3 billion in failed bank assets for both BIF and the FSLIC Resolution Fund (FRF). During 1992, the FDIC handled 120 bank failures with $45.4 billion in assets. From those institutions, the FDIC acquired $19 billion in assets for liquidation. Total principal collections were $9.4 billion for BIF and $1 billion for FRF, for a total of $10.4 billion. At the end of 1992, total assets in liquidation were $38.1 billion for BIF and $5.2 billion for FRF, or a total of $43.3 billion. In 1992, responsibility for managing and monitoring the FRF assistance agreements was transferred from the RTC to the FDIC.
In March 1992, months before receiving Congressional funding, the FDIC implemented an Affordable Housing Program to help low- and moderate-income homebuyers purchase single-family homes in FDIC's inventory. Approximately 1,500 properties acquired from failed institutions were included in the program. In September, the FDIC received $5 million in funding from Congress for costs associated with this program.
The FDIC held its second national real estate owned auction in Dallas and sold 218 properties from 31 states for a record $412 million. In addition, 146 properties were sold for $262 million before the auction. These efforts created a combined total sales figure of $674 million. Total real estate owned sales of 15,100 properties by the FDIC in 1992, including sales by asset managers under the FDIC's direction, produced $2.3 billion, representing 92 percent of aggregate appraised value. During 1992, real estate owned sales included the following significant properties:
- Occidental Tower in Dallas, Texas, sold for $37.5 million;
- Goldome Center in Buffalo, New York, sold for $14.6 million;
- Radisson Lord Baltimore Hotel in Baltimore, Maryland, sold for $8.5 million; and
- Centurion Plaza in West Palm Beach, Florida, sold for $6.6 million.
At the end of the year, FDIC's liquidation inventory, including assets serviced by asset management contractors and national servicers, consisted of $44.1 billion in assets. Total recoveries for 1992 totaled $15.1 billion, including loan collections, real estate owned sales, loan sales, the sale of securities, investment income, and professional liability settlements
The FDIC monitored the performance of ten asset pools with total assets of $12.2 billion as of the end of 1992, which were managed by private contractors. The FDIC also implemented a new type of asset servicing contract known as the Regional Asset Liquidation Agreement (RALA) to contract out the servicing of asset pools valued at less than $500 million to smaller firms.
Legal matters in 1992 were 11 percent higher than in 1991, with 90 percent relating to asset disposition.
A Regional Asset Liquidation Agreement (RALA) was an asset management and disposition contract with an independent entity (contractor) for the resolution of asset pools acquired by the FDIC. A RALA contract was awarded subsequent to and apart from the resolution process. Assets in the pool were specified by the FDIC, and the asset pool was not associated with any single institution.
There were 23,900 litigation cases; 9,202 bankruptcy claims; and 9,286 nonlitigation matters such as asset sales, foreclosures, and other collection activities. The FDIC collected $610 million from professional liability cases. Although the number of professional liability matters declined in 1992, the amount collected was almost double the 1991 figure.
The FDIC assisted the Department of Justice in obtaining the convictions of 30 people who caused losses to failed financial institutions. The FDIC also benefited from the 37 court orders issued in 1992 requiring defendants to pay a total of $106 million in criminal restitution to the FDIC.
During 1992, the FDIC also cooperated with the Department of Justice in defending a number of lawsuits challenging the capital standards mandated by the Financial Institutions Reform, Recovery, and Enforcement Act (FIRREA) of 1989. Most of those cases involved resolutions of insolvent thrifts by the Federal Home Loan Bank Board prior to the enactment of FIRREA. The transactions authorized acquiring institutions to use supervisory goodwill to meet capital requirements. FIRREA phased out the use of goodwill as capital. In 1992, the U.S. Court of Appeals for the Federal Circuit concluded that thrifts were not entitled to relief for that change in the treatment of supervisory goodwill. However, the plaintiff thrifts asked for, and received, a rehearing of the court en banc, and the court found for the thrifts.
The government appealed that decision to the Supreme Court, which ruled in July 1996 that the government had a contract with the thrifts granting the thrifts the goodwill and that the government breached that contract by phasing out the use of goodwill early. The results of the Supreme Court decision and the results of certain other trials not yet conducted in the Court of Federal Claims as of the end of 1996 had the potential to be applied in more than 120 other cases filed by thrifts in the Court of Federal Claims.
To carry out FDICIA, the FDIC issued and promulgated several regulations in 1992:
- In April, limitations on the loans that state nonmember banks could make to their executive officers;
- In May, tighter restrictions on brokered deposits;
- In September, prompt corrective action, which required regulators to take specified actions when an insured institution's capital falls below certain levels; and
- In October, (1) risk-related insurance premiums; (2) real estate lending policy amendments; (3) maximum levels of loan-to-value ratios, and (4) ownership by insured state chartered banks of corporate stock, mutual fund shares, and certain equity investments.
Congress enacted the Housing and Community Development Act of 1992, which contained provisions relating to banking and bank regulators. Among other provisions, this Act: (1) prohibited the FDIC from setting a specific range of compensation for officers, directors, and employees of insured financial institutions with some exceptions; (2) relieved lenders from a requirement in the Real Estate Settlement Procedures Act that they mail booklets on closing costs to all mortgage loan applicants; and, (3) clarified that caps on the maximum interest rate that a lender can charge on an adjustable rate mortgage apply only to consumer loans and not to business loans.
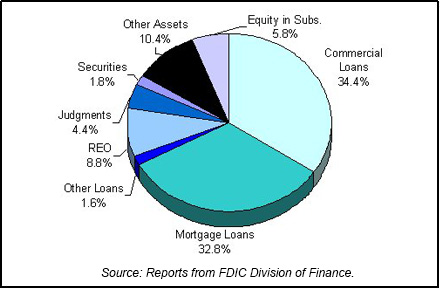
Table 15-4 shows the FDIC's assets in liquidation and Chart 15-1 shows the asset mix.
Table 15-4
| 1991 FDIC End of the Year Assets in Liquidation ($ in Billions*) | ||||||
|---|---|---|---|---|---|---|
| Asset Type | 12/31/91 Book Value | 1992 Assets Acquired | 1992 Prin. Coll. | 1992 Write Downs | 12/31/92 Book Value | 12/31/92 Est. Rec. Value |
| Commercial Loans | $15.3 | $5.0 | $3.1 | $2.3 | $14.9 | $14.4 |
| Mortgage Loans | 12.8 | 6.5 | 3.6 | 1.5 | 14.2 | 7.9 |
| Other Loans | 1.4 | 0.5 | 0.3 | 0.9 | 0.7 | |
| Real Estate Owned | 6.0 | 1.5 | 1.6 | 2.1 | 3.8 | 4.0 |
| Judgments | 1.9 | 1.2 | 0.1 | 1.1 | 1.9 | |
| Securities | 0.3 | 1.6 | 1.1 | 0.0 | 0.8 | 0.7 |
| Other Assets | 5.6 | 0.1 | 0.5 | 0.7 | 4.5 | 6.1 |
| Equity in Subs. |
2.6 | 0.1 | 0.0 | 2.5 | ||
| Totals | $43.3 | $19.0 | $10.4 | $8.6 | $43.3 | $33.1 |
Source: Reports from FDIC Division of Finance.
Insurance Fund and Staffing
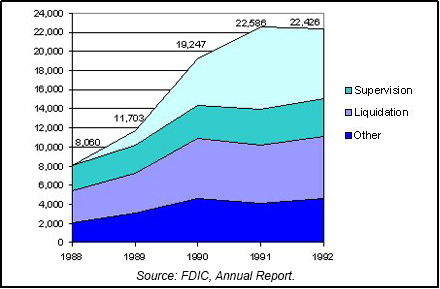
The BIF had a slight negative balance of $101 million at the end of 1992. Overall, the FDIC employed 15,044 people, which was up from 13,972 at the end of 1991. There were 3,996 Division of Supervision employees, which was up from 3,813 at the end of 1991. Division of Liquidation employees totaled 6,427, which was an increase of 330 over the previous year. The FDIC also imposed a freeze on most permanent hiring and promotions in May in anticipation of the return to the FDIC of the RTC permanent employees at the RTC's sunset. Total staffing including 7,382 RTC employees equaled 22,426. Chart 15-2 shows the staffing levels for the past five years.
Private Resolutions
In April of 1992, two private banks with aggregate deposits of $203 million insured by the Pennsylvania Deposit Insurance Corporation (PDIC) were seized by the Pennsylvania Department of Banking. PDIC insured deposits to $100,000, but its $4 million in reserves was not sufficient to pay depositors. Consequently, insured deposits were transferred to two newly chartered, federally insured banks with deposits of $66 million and $116 million, respectively. Depositors, however, lost an aggregate $21 million in the process. The new banks were capitalized by stock purchased by the Pennsylvania's State Workers' Insurance Fund.
Litigation over the appropriateness of the closure of one of the private banks was settled in 1994. The pool of settlement money was to come from a $3.2 million direct cash payment by the state and from the sale of the failed bank assets by the state banking department. That settlement made 190 uninsured depositors almost whole.15-9
The federally insured banks subsequently were merged and sold in July of 1995. The total cost to the state's taxpayers, as stated by the Pennsylvania Auditor General, was expected to be more than $33 million.
Small state insurance funds were prone to be hit hard with failure of just one or two institutions. PDIC never had more than four members and ultimately did not have sufficient funds to cover the losses from the two failed institutions.
Table 15-5
Resolution Trust Corporation
| 1991 - 1992: RTC at a Glance ($ in Millions) | |||
|---|---|---|---|
| 12/31/91 | 12/31/92 | Percent Change | |
| Number of Conservatorships at the beginning of the year | 179 | 91 | -49.16% |
| Number of Conservatorships added during the year | 123 | 50 | -59.35% |
| Thrifts in the ARP Program |
21 | 9 | -57.14% |
| Total of all thrift takeovers | 144 | 59 | -59.03% |
| Total of thrift resolutions | 232 | 69 | -70.26% |
| Conservatorships resolved during the year | 211 | 60 | -71.56% |
| Conservatorships at the end of the year | 91 | 81 | -10.99% |
| Total Assets at Takeover | |||
|---|---|---|---|
| 12/31/91 | 12/31/92 | Percent Change | |
| Conservatorships | $70,929 | $35,448 | -50.02% |
| Thrifts in the ARP Program | $8,105 | $9,437 | 16.43% |
| Total | $79,034 | $44,885 | -43.21% |
| Estimated losses on thrift resolutions |
$10,773 | $4,180 | -61.20% |
| Estimated losses as a percent of total assets | 13.63% | 9.31% | -31.69% |
| Assets in Liquidation | |||
|---|---|---|---|
| 12/31/91 | 12/31/92 | Percent Change | |
| Conservatorships | $47,318 | $40,211 | -15.02% |
| Receiverships | $83,066 | $64,335 | -22.55% |
| Total | $130,384 | $104,546 | -19.82% |
| RTC Staffing | 8,614 | 7,382 | -14.30% |
Source: RTC, 1992 Annual Report and Reports from FDIC Division of Research and Statistics.
Notable Events
Various changes mandated by the enactment of the RTC Refinancing, Restructuring, and Improvement Act (RTCRRIA) of 1991 on November 27, 1991, were implemented in 1992. The changes included funding through April 1, 1992; extension of the time frame to accept appointment as conservator or receiver; establishment of the Thrift Depositor Protection Oversight Board; removal of the FDIC as exclusive manager of the RTC; and creation of the office of chief executive officer of the RTC. Pursuant to RTCRRIA, Albert V. Casey was named chief executive officer.
S&L Resolutions
At the beginning of 1992, the RTC was managing 91 conservatorships with total assets of $47.3 billion. During the year, another 50 thrifts with assets of about $35.5 billion were placed into conservatorship. By the end of the year, the RTC had resolved 69 failed thrifts with total assets of $35.5 billion. Of the 69 resolutions in 1992, 60 were conservatorships, and the remaining 9 thrifts were resolved through the Accelerated Resolution Program (ARP). The nine thrifts that were resolved under ARP had total deposits of $8.5 billion, and the deposit premiums paid by acquirers totaled $131 million, or about 1.8 percent of the transferred core deposits. The largest conservatorship resolution in 1992 was Sunbelt Federal Savings, F.S.B., Irving, Texas, with $3.4 billion in deposits and 112 offices.
Gross conservatorship assets, which totaled $47.3 billion in January 1992, were reduced by sales, collections, and resolutions to about $40.2 billion by the end of the year. The gross RTC funding for the 69 resolutions was $24.4 billion, including conservatorship advances of $2.5 billion, for a net RTC funding cost of $21.9 billion.
In 1992, 63 thrifts with total assets of $35.2 billion were resolved in P&A transactions. Two thrifts with total assets of $103.4 million were resolved through IDTs. Buyers could not be found for four thrifts with total assets of $170.3 million, and therefore, the thrift depositors were paid off.
Losses per transaction type are shown in Table 15-6 and Table 15-7 shows conservatorships and receiverships at year-end 1992.
Table 15-6
| 1992 Losses by RTC Transaction Type ($ in Millions) | ||||
|---|---|---|---|---|
| Transaction Type | Number of Transactions | Total Assets | Loss* as of 12/31/95 | Estimated Losses as a Percent of Assets |
| P&As | 63 | $35,211.1 | $6,574.1 | 18.67% |
| IDTs | 2 | 103.4 | 18.2 | 17.60% |
| Payoffs | 4 | 170.3 | 46.9 | 27.54% |
| Totals | 69 | $35,484.8 | $6,639.2 | 18.71% |
Source: Reports from FDIC Division of Research and Statistics.
Table 15-7
| Conservatorships | |
|---|---|
| Item | Total |
| In Conservatorship at 12/31/91 | 91 |
| Conservatorships added in 1992 | 50 |
| Subtotal | 141 |
| Conservatorships resolved in 1992 (New Receiverships) | 60 |
| Conservatorships remaining 12/31/92 | 81 |
| Receiverships | |
|---|---|
| Item | Total |
| Receiverships as of 12/31/91 | 584 |
| New Receiverships that were previously Conservatorships in 1992 | 60 |
| New Receiverships that were resolved through ARP in 1992 | 9 |
| Total Receiverships during 1992 | 69 |
| Total Receiverships as of 12/31/92 | 653 |
Source: Reports from FDIC Division of Research and Statistics.
Payments to Depositors and Other Creditors
In 1992, there were 69 resolutions with total deposits of $27.6 billion in 3,080,701 deposit accounts. Of that total, there were four payoff transactions with $116.6 million in total deposits in 10,477 deposit accounts.
Of the 653 insured thrift failures since the RTC began operations in August of 1989, a total of 407 were P&A transactions, 88 were payoff transactions, and 158 were IDTs.
Asset Disposition
At the beginning of 1992, the RTC held $130.4 billion in assets of savings and loan associations in receivership and in conservatorship. Assets acquired during the year through conservatorships, other resolved institutions, and putbacks or repurchases totaled $60.2 billion for the year. Losses and collections totaled $86.1 billion for the year. At the end of 1992, total assets in liquidation from both receiverships and conservatorships were $104.5 billion.
During 1992, the RTC asset sales and collections totaled $79.4 billion. That figure is net of assets sold and then put back or repurchased, as well as net of discounted payoffs, bulk sale discounts, and write-offs. Book value reductions for the end of the fiscal year September 30, 1992, totaled $101 billion, an 87 percent return of the book value of disposed assets.
In 1992, the RTC National Sales Center was involved in a number of large sales transactions of commercial real estate and nonperforming mortgages. Two of those transactions are worthy of mention.
- The RTC executed its first large structured sale netting $130.5 million. The portfolio, with a total book value of $237 million, consisted of hotel properties, and performing and nonperforming loans collateralized by hotel assets.
- In September 1992, the RTC conducted its largest auction since inception, selling almost $500 million in book value of nonperforming loans. The auction was held in Los Angeles and generated a total of $247.9 million.
By the end of the year, a total of 92 Standard Asset Management Disposition Agreement (SAMDA) program contractors were managing assets with a total book value of approximately $23 billion. In 1992, the RTC established special teams in each field office to evaluate problem assets and execute necessary workout negotiations or collection strategies with defaulted borrowers. By the end of the year, the teams, with contractor assistance, had restructured, sold, or worked out $2.7 billion in assets and had another $4.7 billion in assets under review.
During the first two months of 1992, the RTC consummated its first manufactured housing and commercial mortgage securitizations, RTC 1992-MH1 and RTC 1992-C1, respectively. The RTC issued an internal circular requiring securitization to be the primary and priority method for selling all performing loans secured by one-to-four family homes, multi-family properties, commercial real estate, and manufactured housing contracts. On June 29, 1992, the RTC's only home equity loan securitization, RTC 1992-HEL1, was originated. During 1992, the RTC registered a total of $15 billion in mortgage pass-through securities with the Securities and Exchange Commission.
From the inception of the securities sales program in 1990, more than $61 billion in securities were sold, along with $9 billion in interest rate swaps and more than $8 billion in junk bonds. At the end of the year only $211 million in junk bonds remained in the RTC's inventory. The RTC used several programs to sell highly nonliquid securities, including limited partnership interests, highly leveraged transactions, and commercial loan participations.
In 1992, the RTC used Multiple Investor Funds and N Series securitization transactions to dispose of nonperforming and subperforming loans, as well as real estate owned to a lesser extent. The benefits of those programs were access to a broader investment base than was available through other disposition strategies, a potential upside economic interest for the RTC, and a structure to ensure that asset managers' interests were parallel to those of the RTC. The RTC also developed a securitization program for nonconforming single-family mortgages, multi-family loans, and commercial real estate loans. Table 15-8 shows the RTC's assets in liquidation and Chart 15-3 shows the asset mix.
The RTC used the Multiple Investor Fund (MIF) and N Series securitization transactions to dispose of nonperforming and subperforming loans. Those transactions involved establishing partnerships between the RTC and private investors who purchased, managed, and then sold portfolios of nonperforming and subperforming loan assets, and then shared in the profits with the RTC. The structure provided incentives for equity partners to work out portfolios with the highest returns to the partners and the RTC.
Table 15-8
| 1992 RTC End of the Year Assets in Liquidation ($ in Billions*) | ||||||
|---|---|---|---|---|---|---|
| Asset Type | 12/31/91 Total Book Value | Assets Acq'd During the Year | 1992 Collections | 1992 Losses | 12/31/92 Total Book Value | Memo Item |
| 1-4 Family Mtges | $25.9 | $18.3 | $24.4 | $3.2 | $16.6 | $4.3 |
| Other Mtges | 43.9 | 10.6 | 15.8 | 6.0 | 32.7 | 6.8 |
| Other Loans | 9.0 | 3.3 | 5.1 | 0.0 | 7.2 | 1.2 |
| Real Estate Owned | 17.1 | 3.3 | 3.7 | 3.8 | 12.9 | 2.8 |
| Other Assets | 16.2 | 3.9 | 7.5 | -4.2 | 16.8 | 7.0 |
| Cash/Securities | 18.3 | 20.8 | 22.9 | -2.1 | 18.3 | 3.8 |
| Totals | $130.4 | $60.2 | $79.4 | $6.7 | $104.5 | $25.9 |
Memo Item: Assets transferred from conservatorship to receivership. Does not affect total of assets in liquidation.
Source: RTC August 1989/September 1995 Statistical Abstract.

Funding and Staffing
During 1992, the RTC was not given additional funding by Congress after April 1 to resolve failed thrifts. When the RTC was without funding, resolution activity was severely reduced. The pace of resolutions, followed the availability of funding and resolution delays, kept thrifts in conservatorship longer, which increased conservatorship operating losses. Those losses were $5.4 billion in 1989 and decreased steadily each year. In 1992, they were $669 million, but because of the reduced resolution activity from the lack of funding, in 1993, conservatorship operating losses increased to $1.3 billion. Resolution delays and conservatorship operating losses led to increased resolution costs because of the relatively high carrying cost of maintaining assets in failed thrifts.15-10 Nonetheless, the RTC assumed control of 50 thrifts closed by the Office of Thrift Supervision during 1992, and the total number of employees declined from 8,614 to 7,382 by the end of the year.
15-1 Bureau of Economic Analysis. Back to Text
15-2 CB Commercial Torto/Wheaton Research and Bureau of Labor Statistics, Department of Labor. Back to Text
15-3 Housing Market Statistics, National Association of Home Builders (June 1996), Federal Home Loan Mortgage Corporation and Bureau of Labor Statistics, Department of Labor. Back to Text
15-4 Housing Market Statistics, National Association of Home Builders (June 1996), and CB Commercial Torto/Wheaton Research. Back to Text
15-5 Bureau of Economic Analysis, Department of Commerce. Back to Text
15-6 Bureau of Economic Analysis, Department of Commerce. Back to Text
15-7 Bureau of Economic Analysis, Department of Commerce. Back to Text
15-8 This figure now includes five open bank assistance transactions from 1934-1980. In 1988 there were 21 assistance agreements that resolved 79 institutions. The FDIC annual report (source data) calculates failure data per transaction; this report calculates failures per failed institution. Actual resolutions through 1992 totaled 2,125. Back to Text
15-9 The Philadelphia Business Journal, Inc., August 26, 1994. Back to Text
15-10 Resolution Trust Corporation, Office of Research and Statistics, “The History of RTC Funding.” Unpublished document. Back to Text
Table of Contents