
Managing the Crisis: The FDIC and RTC Experience — Chronological Overview
Chapter Seven: 1984
Bank failures in 1984 climbed to a new post-Depression record of 78. For the first time in the history of deposit insurance, provisions for insurance losses exceeded annual deposit insurance assessments.
Table 7-1
| 1983 - 1984: FDIC at a Glance ($ in Millions) | |||
|---|---|---|---|
| 12/31/83 | 12/31/84 | Percent Change | |
| Number of Bank Failures | 45 | 78 | 73.33% |
| Assistance to Open Banks | 3 | 2 | -33.33% |
| Total Failed and Assisted Banks | 48 | 80 | 66.67% |
| Total Assets of Failed and Assisted Banks | $7,191.7 | $43,432.5 |
503.93% |
| Losses on Failed and Assisted Banks | $1,407.4 | $1,640.2 | 16.54% |
| Losses as a Percent of Total Assets | 19.57% | 3.78% | -80.68% |
| Assets in Liquidation | $4,259.6 | $10,299.8 | 141.80% |
| FDIC Staffing | 3,846 | 5,076 | 31.98% |
| Number of Problem Banks | 642 | 848 | 32.09% |
| Deposit Insurance Fund Balance | $15,429.1 | $16,529.4 | 7.13% |
| Deposit Insurance Fund Balance as a Percent of Insured Deposits | 1.22% | 1.19% | -2.46% |
Source: FDIC, 1984 Annual Report and Reports from FDIC Division of Finance and Division of Research and Statistics.
Notable Events
The single biggest event of the year was the rescue of Continental Illinois National Bank and Trust Company (Continental), Chicago, Illinois. Having suffered large losses resulting from loans purchased from the failed Penn Square Bank, N.A., Oklahoma City, Oklahoma, Continental experienced severe financial difficulties throughout 1983. A permanent assistance plan put together by the FDIC required certain top management changes with multi-tier corporate restructuring, included the sale to the FDIC of problem loans with a face value of $5.1 billion for a price of $4.5 billion and a capital infusion from the FDIC of $1 billion in return for two permanent, nonvoting preferred stock issues.
Economic/Banking Conditions
In 1984, Gross Domestic Product (GDP) growth continued to increase as did employment growth. GDP was up 6.8 percent over the year, and employment increased by 5 percent.7-1 The unemployment rate dropped to 7.5 percent.7-2 Inflation also was down,7-3 but interest rates increased slightly. The discount rate was 8.8 percent, and the 30-year mortgage rate was 13.9 percent.7-4 Over the year, home sales and housing starts increased, but not as rapidly as in 1983. Sales were up 4.5 percent, and housing starts increased 2.7 percent. Continued commercial lending was pushing up the office vacancy rate to 14.6 percent for the year.7-5
Nationally, farm debt (total liabilities for agricultural businesses) peaked at $207 billion in 1983,7-6 and agricultural economic and financial problems led to an increase in agricultural bank failures in 1984. Twenty-five agricultural banks failed in the year, 31 percent of the country’s total number of failed banks. Bank failures in the midwest also increased due to the downturn of the agricultural industry. Eleven banks failed in the midwest in 1983 compared with 31 in 1984; the majority of which were designated agricultural banks.
The number of newly chartered banks reached a peak, with 402 institutions chartered in 1984. Despite the problems with the agricultural banks, 180 new banks were chartered in the Southwest alone in 1984. Many of those charters had a high concentration of Commercial and Industrial loans. The Southwest continued to experience problems in the agricultural and oil sectors, and regional banks were beginning to experience problems stemming from those faltering industries. The real estate market in the Southwest, however, was still healthy, and the value of commercial real estate permits rose 8 percent over the year.7-7 Much of the money from the profitable oil industry of the late 1970s and early 1980s was being invested in real estate development by those who believed that oil prices would rise again in the near future. Across the region there was a large increase in commercial real estate loans, totaling almost 8 percent of total assets, well above the national median of just under 5 percent.
The Northeast was still seeing high employment and high Gross State Product growth rates.7-8 A regional four-year boom in housing prices began with Boston residential real estate prices up 21 percent over the year.7-9 The housing price boom was coupled with a substantial increase in personal income during the same period.7-10 The conversion rate of mutual savings banks to the stock form of ownership started increasing dramatically. Those banks had strong incentives to expand loan portfolios rapidly in order to leverage high initial capital positions, increase earnings per share, and meet stockholders’ expectations.
In the banking industry as a whole, bank failures and the number of problem banks were up. During the last quarter of 1984, defaulted agricultural loans became a significant factor in the number of failures. Agricultural banks (commercial banks in which agricultural loans comprise 25 percent or more of total loans) had been experiencing escalating difficulties. By the end of the year, 37 percent or 314 of the FDIC’s list of 848 problem banks were agricultural banks. In fact, during the last four months of 1984, agricultural banks accounted for 71 percent of the banks that failed in that period. The 848 banks on the FDIC’s problem bank list represented an increase of 206 over 1983’s end of the year total of 642.
Table 7-2 shows the number and total assets of FDIC insured institutions, as well as their profitability as of the end of 1984.
Table 7-2
Open Financial Institutions Insured by FDIC ($ in Billions)
| Commercial Banks - FDIC Regulated | |||
|---|---|---|---|
| Item | 1983 | 1984 | Percent Change |
| Number | 14,469 | 14,483 | 0.10% |
| Total Assets | $2,342.1 | $2,508.9 | 7.12% |
| Return on Assets | 0.66% | 0.64% | -3.03% |
| Return on Equity | 11.90% | 10.40% | -12.61% |
| Savings Banks – FDIC Regulated | |||
|---|---|---|---|
| Item | 1983 | 1984 | Percent Change |
| Number | 294 | 268 | -8.84% |
| Total Assets | $170.7 | $136.5 | -20.04% |
| Return on Assets | -0.10% | -0.07% | -- |
| Return on Equity | -2.18% | -1.37% | -- |
| Savings Associations – FHLBB Regulated | |||
|---|---|---|---|
| Item | 1983 | 1984 | Percent Change |
| Number | 3,183 | 3,150 | -1.04% |
| Total Assets | $819.1 | $1,008.7 | 23.15% |
| Return on Assets | -0.26% | -0.11% | -57.69% |
| Return on Equity | 8.51% | 3.81% | -55.23% |
Percent change is not provided if either the latest period or the year-ago period contains a negative number.
Source: Reports from FDIC Division of Research and Statistics.
Bank Failures and Assistance to Open Banks
There were 78 commercial bank failures in 1984 ? the largest number of insured bank failures in any year since the FDIC was founded. There also was one assisted merger of a mutual savings bank and one assisted merger of a commercial bank. Tennessee alone experienced 11 bank failures. Three of those banks were part of the chain controlled by Jake and C.H. Butcher, Jr. A total of eleven banks controlled by the Butchers failed during 1983 and 1984.
The FDIC resolved 62 failed banks in 1984 through purchase and assumption (P&A) transactions. Twelve failed banks during 1984 were handled through insured deposit transfers (IDT). In eight of those, the FDIC paid advance dividends to uninsured depositors and other claimants amounts ranging from 40 percent to 75 percent of uninsured claims. The FDIC used the deposit payoff method in four bank failures in 1984, because neither P&A nor IDT transactions with assuming banks were possible. In three of the four payoffs, the FDIC paid advance dividends to uninsured depositors and other creditors of the failed banks.
In addition to the assistance provided to Continental in 1984, the FDIC assisted the merger of Orange Savings Bank, Livingston, New Jersey, into Hudson City Savings Bank, Paramus, New Jersey. Pursuant to its Voluntary Merger Plan, the FDIC advanced $26 million to Hudson City Savings, and under the assistance agreement, repayment of $16 million of the assistance was contingent upon the resulting bank?s future income.
At the end of 1984, 23 depository institutions had net worth certificates outstanding totaling $578.8 million. At the end of 1983, the depository institutions with such certificates held $376.8 million in certificates.
A recent estimate of losses per transaction type is shown in Table 7-3.
Table 7-3
| 1983 Losses by Transaction Type ($ in Millions) | ||||
|---|---|---|---|---|
| Transaction Type | Number of Transactions | Total Assets | Losses | Losses as a Percent of Assets |
| OBA | 2 | $40,470.3 | $1,116.3 | 2.76% |
| P&As | 62 | 2,037.6 | 431.5 | 21.18% |
| IDTs | 12 | 531.3 | 72.7 | 13.68% |
| Payoffs | 4 | 393.3 | 19.7 | 5.01% |
| Totals | 80 | $43,432.5 | $1,640.2 | 3.78% |
Source: Reports from FDIC Division of Research and Statistics.
Payments to Depositors and Other Creditors
Exclusive of Continental, 79 banks that failed or were assisted had total deposits of $2.7 billion in 532,448 accounts. Insured accounts at Continental totaled slightly more than $3 billion; uninsured depositors and other private creditors held over $30 billion in claims. All deposits at Continental, however, were protected as it was assisted and did not fail. In the four payoffs, there were 25,196 deposit accounts with $378.7 million in total deposits.
Of the 748 banks7-11 that failed since the FDIC’s inception in 1934, P&A transactions and assistance agreements were used for 404 failures, and deposit payoffs were used to resolve another 344 banks, including 14 IDTs. Since January 1, 1934, 800,000 depositors with total deposits of $2 billion were involved in payoff cases.
Total disbursements by the FDIC through 1984 amounted to $13.3 billion. Of that amount, the FDIC recovered $9.8 billion, for a net loss of $3.5 billion.
Asset Disposition
At the beginning of 1984, the FDIC held $4.3 billion in assets from failed banks. There were 78 bank failures in 1984, with total assets of $2.9 billion. The FDIC?s inventory of assets in liquidation in 1984, exclusive of assets of Continental, climbed to 121,000 assets with a book value of $5.2 billion. The FDIC acquired approximately 800 assets from Continental with a book value of $5.1 billion. Combined total assets for liquidation at the end of 1984 were $10.3 billion, which represented an increase of more than double the amount of assets held at the beginning of the year.
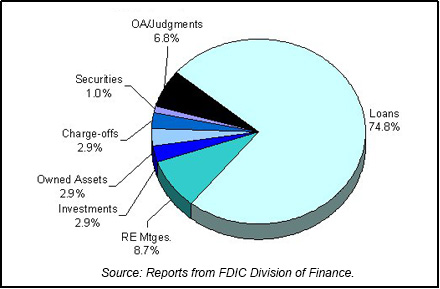
During the mid-1980s, the FDIC?s asset marketing efforts were focused on performing loans of all types and sizes; particularly those collateralized by real estate. As the workload increased, the FDIC?s efforts began to focus on the sale of nonperforming loans, particularly those with small balances. That occurred for several reasons. In many cases, smaller loans were as time-consuming to work as loans with much higher book values and greater sources of recovery to the FDIC. Although small loans made up the vast majority of the loans held by the FDIC, their total value represented a small fraction of the value of receivership portfolios. By accelerating the disposition of those small loans, FDIC account officers were able to focus on larger credits that offered higher recovery levels. Table 7-4 shows the FDIC?s assets in liquidation and Chart 7-1 shows the asset mix.
Table 7-4
| 1984 FDIC End of the Year Assets in Liquidation ($ in Billions) | |||
|---|---|---|---|
| Asset Type | 12/31/83 Book Value | 12/31/84 Book Value | 12/31/82 Estimated Recovery Value |
| Loans | $2.5 | $7.7 | $6.1 |
| Real Estate Mortgages | 0.4 | 0.9 | 0.8 |
| Investments | 0.3 | 0.3 | 0.3 |
| Owned Assets | 0.2 | 0.3 | 0.2 |
| Charge-Offs | 0.3 | 0.3 | 0.2 |
| Securities | 0.1 | 0.1 | 0.1 |
| Other Assets/Judgments | 0.5 | 0.7 | 0.2 |
| Total | $4.3 | $10.3 | $7.9 |
Source: Reports from FDIC Division of Finance.
Insurance Fund and Staffing
Revenues and the insurance fund increased during 1984 despite a record number of bank failures. Revenues included $1.5 billion on investments and U.S. Treasury obligations and $1.3 billion in assessments from insured banks. The fund reached a new high of $16.5 billion, an increase of $1.1 billion over 1983. That was an increase of 7.1 percent. Total gross expenses and losses for 1984 were $1.3 billion.
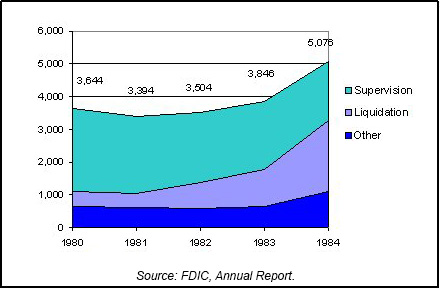
Total FDIC staffing was 5,076 by the end of the year, an increase of 1,230 or 31.98 percent over 1983. Of the 5,076 total, 2,158 were in the Division of Liquidation and 1,800 were in the Division of Bank Supervision (DBS). That was the fourth straight year that DBS staffing decreased. Chart 7-2 shows the staffing levels for the past five years.
Thrifts
In 1984, thrift industry growth reached a peak as the number of insured thrifts grew 20 percent, compared with 4 percent growth for commercial banks. Arizona, Texas, and California led the industry with growth rates of 47 percent, 38 percent, and 30 percent, respectively. Generally, individual thrifts that experienced rapid growth were expanding with greater risk assets (commercial real estate loans, land loans, and direct equity investments), while simultaneously relying on more costly and volatile funding sources (large time deposits, repurchase agreements, and other liabilities). The peak number of thrifts converting from mutual to stock ownership also occurred in 1984. Overall, the Federal Home Loan Bank Board encouraged such conversions, which were considered one way of bringing in new capital to the industry.
The Federal Savings and Loan Insurance Corporation (FSLIC) also was busy in 1984 handling troubled thrift institutions. Two methods of resolution used were the Assisted Merger and the Supervisory Merger. By the end of 1984, 9 liquidations and 13 Assisted Mergers had occurred, costing FSLIC a total of $743 million. There were also 14 Supervisory Mergers, and the FSLIC fund balance stood at $5.6 billion.
The Assisted Merger was the most popular form of FSLIC resolution, since it deferred FSLIC cash payments. An acquirer would assume all (or nearly all) the assets and liabilities of a failed thrift and would receive assistance from FSLIC. Major components of assistance included capital loss coverage and yield maintenance on troubled assets. In a Supervisory Merger, supervisory authorities would encourage a weak thrift to merge with a healthier thrift, with no direct financial assistance from FSLIC.
7-1 Bureau of Economic Analysis, Department of Commerce and CB Commercial Torto/Wheaton Research. Back to text
7-2 Bureau of Labor Statistics, Department of Labor. Back to text
7-3 Bureau of Labor Statistics, Department of Labor. Back to text
7-4 Housing Market Statistics, National Association of Home Builders (June 1996), and Federal Home Loan Mortgage Corporation. Back to text
7-5 Housing Market Statistics, National Association of Home Builders (June 1996), and CB Commercial Torto/Wheaton Research. Back to text
7-6 Economic Report of the President, 1986. Back to text
7-7 Bureau of the Census, Building Permits Section, Manpower and Construction Statistics Branch. Back to text
7-8 Bureau of Labor Statistics, Department of Labor and Bureau of Economic Analysis, Department of Commerce. Back to text
7-9 National Association of Realtors. Back to text
7-10 Karl E. Case, “The Real Estate Cycle and the Economy: Consequences of the Massachusetts Boom of 1984-87,” New England Economic Review
(September/October 1991), 37-39. Back to text
7-11 This figure does not include five open bank assistance transactions from 1934-1980. The FDIC did not begin including assistance agreements with the failures for reporting purposes until 1981. Five assistance agreements, with total deposits of $6.8 billion, should be included in the overall
totals. Back to text
Table of Contents