
Managing the Crisis: The FDIC and RTC Experience — Chronological Overview
Chapter Five: 1982
Not since the Great Depression had the FDIC played such a discernible role in the business life of the nation as it did in 1982. In general, most Americans did not know or understand very much about the FDIC and its operations. However, after 34 insured bank failures and 8 assisted merger transactions of mutual savings banks during the year, the FDIC’s involvement in major banking industry issues began to make the FDIC’s influence on the nation’s economic health more evident.
Table 5-1
| 1981 - 1982: FDIC at a Glance ($ in Millions) | |||
|---|---|---|---|
| 12/31/81 | 12/31/82 | Percent Change | |
| Number of Bank Failures | 7 | 34 | 385.71% |
| Assistance to Open Banks | 3 | 8 | 166.67% |
| Total Failed and Assisted Banks | 10 | 42 | 320.00% |
| Total Assets of Failed and Assisted Banks | $4,947.4 | $11,722.6 | 136.94% |
| Losses on Failed and Assisted Banks | $781.8 | $1,168.6 | 49.48% |
| Losses as a Percent of Total Assets | 15.80% | 9.97% | -36.90% |
| Assets in Liquidation | $1,840.6 | $2,155.1 |
17.09% |
| FDIC Staffing | 3,394 | 3,504 | 3.24% |
| Number of Problem Banks | 223 | 369 | 65.47% |
| Deposit Insurance Fund Balance | $12,246.1 | $13,770.9 | 12.45% |
| Deposit Insurance Fund Balance as a Percent of Insured Deposits | 1.24% | 1.21% | -2.42% |
Source: FDIC, 1982 Annual Report and Reports from FDIC Division of Finance and FDIC Division of Research and Statistics.
Notable Events
Two years after the passage of the Depository Institutions Deregulation and Monetary Control Act of 1980, Congress passed the Garn-St Germain Depository Institutions Act (Garn-St Germain) of 1982. Garn-St Germain took deregulation even further and gave the regulators more flexibility in dealing with failing or failed institutions, including the authority to seek out-of-state bidders for emergency acquisitions.
Economic/Banking Conditions
The nation was still in a recession throughout 1982. Gross Domestic Product declined by 2.1 percent, and employment was down 1.2 percent.5-1 The unemployment rate rose to 9.7 percent, up from 7.6 percent a year ago, a 28 percent increase.5-2 Interest rates remained high. Although there was a slight decline, the discount rate was at 11 percent, and the 30-year mortgage rate was at 16.1 percent.5-3 Inflation also was down from 9.4 percent in 1981, to 6.2 percent in 1982.5-4 The real estate market was affected by the recession. Home sales and housing starts both were down for the third straight year, declining 15.8 percent and 2 percent, respectively. The office vacancy rate was beginning to increase, up to 9.3 percent, signaling overbuilding in the markets.5-5
California was not as badly affected by the recession as was most of the country. For the second year in a row, prices stalled in the state, but there was no deterioration in the state’s economy. California’s Gross State Product, however, was at a standstill during the year.5-6 The high level of defense spending and the booming semiconductor industry, headquartered in Silicon Valley, helped California’s economy through the recession.5-7
The story in the Southwest was different. Although farmland value for the 1980s peaked at an average of $715 per acre, the agricultural sector’s 1970s expansion continued to wind down. Agricultural prices fell 12 percent from the previous year, and cash receipts declined. Despite expectations for record-setting levels, U.S. agricultural exports fell 11 percent.5-8
The Southwest real estate markets saw the end of their rapid growth. Between 1980 and 1982, there was an 88 percent increase in residential permits and a 46 percent increase in residential housing starts in the region.5-9 Oil prices continued to decline, and profits for the oil industry in the Southwest slowed. Despite the ensuing hard times in the region and an increasing commercial vacancy rate 5-10, lending was expanding, especially with Commercial and Industrial (C&I) loans at 16.5 percent of assets, up from 15.1 percent in 1981 and commercial real estate loans at 5.1 percent of assets, up from 4.6 percent in 1981. There were 13 bank failures in the Southwest alone during the year.
The high interest rates made it a difficult environment for thrift institutions. Accordingly, Garn-St Germain increased the thrifts’ authority to invest in commercial loans to strengthen long-term thrift institution viability. The bill also lifted statutory restrictions on real estate lending for national banks and limits on concentrations of credit were relaxed. Those provisions helped set the stage for rapid expansion of lending in commercial mortgage markets, which, in turn, helped lead to overbuilding. Subsequently, commercial real estate markets collapsed in many regions. The provisions of Garn-St Germain also increased competition between banks and thrifts. There were 346 new bank charters, a 59.5 percent increase from the previous year. Recession-related factors, in combination with high and volatile interest rates and deregulation, increased loan charge-offs by more than 50 percent in 1982. For the U.S., total loans and leases remained virtually unchanged at 51.3 percent of assets, while total real estate loans declined slightly and commercial real estate loans and C&I loans remained steady.
An enormous problem facing the banking industry was the accumulation by money center banks of large concentrations of loans to lesser developed countries (LDCs). Total LDC debt held by the eight largest money center banks had expanded rapidly from $36 billion at the end of 1978 to $55 billion at the end of 1981, which was more than double the aggregate capital and reserve amounts of those banks.5-11 In August 1982, the Mexican government announced it could no longer meet interest payments on its loans, and by the end of the year, 39 other nations were also in arrears. 5-12 Bank regulators feared that some large banks might be deemed insolvent and precipitate an economic and political crisis, thus they did not require that large reserves be set aside immediately for the LDC loans restructured following the Mexican default.5-13
Insured banks and other financial institutions operated in a very unpredictable economy during 1982. Because of excessive growth in the money supply, the Federal Reserve Board maintained tight monetary policies, and interest rates remained high until late summer when it began to relax its grip. Over the course of the year, the prime interest rate dropped from 15.75 percent to 11 percent.
At the end of 1982, there were 369 banks on the problem bank list, compared with 223 at the end of 1981. That was an increase of 146 banks, approximately 65.5 percent in only one year.
Table 5-2 shows the number and total assets of FDIC insured institutions, as well as their profitability as of the end of 1982.
Table 5-2
Open Financial Institutions Insured by FDIC ($ in Billions)
| Commercial Banks - FDIC Regulated | |||
|---|---|---|---|
| Item | 1981 | 1982 | Percent Change |
| Number | 14,414 | 14,451 | 0.26% |
| Total Assets | $2,029.0 | $2,193.3 | 8.10% |
| Return on Assets | 0.76% | 0.70% | -7.89% |
| Return on Equity | 13.04% | 12.02% | -7.82% |
| Savings Banks – FDIC Regulated | |||
|---|---|---|---|
| Item | 1981 | 1982 | Percent Change |
| Number | 331 | 315 | -4.83% |
| Total Assets | $155.9 | $155.0 | -0.58% |
| Return on Assets | -0.94% | -0.79% | 15.96% |
| Return on Equity | -16.19% | -15.62% | 3.52% |
| Savings Associations – FHLBB Regulated | |||
|---|---|---|---|
| Item | 1981 | 1982 | Percent Change |
| Number | 3,785 | 3,349 | -11.52% |
| Total Assets | $658.5 | $699.5 | 6.23% |
| Return on Assets | -0.72% | -0.63% | 12.50% |
| Return on Equity | -15.59% | -17.52% | -12.38% |
Percent change is not provided if either the latest period or the year-ago period contains a negative number.
Source: Reports from FDIC Division of Research and Statistics.
Bank Failures and Assistance to Open Banks. In the midst of the economic volatility, 34 FDIC insured banks failed and there were 8 assisted mergers of mutual savings banks, topping all previous years since 1940 when 43 failures occurred. Of the 34 failures, 27 were resolved with purchase and assumption (P&A) transactions, and 7 were resolved with deposit payoffs. To place 1982’s failure rate in perspective, the largest number of insured bank failures in any recent year was 16 in 1976, and the number of failed banks was 10 or fewer annually from 1977 through 1981.
The mutual savings banks and thrifts were severely affected by the deregulation of interest rates. Insolvent thrifts were allowed to use brokered deposits to stay in operation and to grow their assets or engage in new activities that could not have been funded through traditional sources. At the same time, regulatory accounting standards for thrifts were adopted allowing many to exist with little or no capital. Those institutions, with little or no capital on the line and access to fully-insured brokered deposits, in many cases took extraordinary risks that resulted in large losses.
Net Worth Certificates (NWCs) were intended for depository institutions that had suffered earnings and capital losses primarily because of an interest rate spread problem. A NWC was purchased by the FDIC from a qualified institution in exchange for an FDIC issued promissory note. The note was an asset on the bank’s books, with the offsetting liability of the NWC counted toward regulatory capital. The FDIC paid interest to the bank as cash, while the bank, if it had earnings and achieved a certain level of net worth, paid part of its net income to the FDIC.
Farmers and Mechanics Savings Bank, Minneapolis, Minnesota, was merged into Marquette National Bank, Minneapolis, Minnesota. As a result of the merger, Marquette National Bank became the fourth largest commercial bank in Minnesota.
Fidelity Mutual Savings Bank, Spokane, Washington, was merged into First Interstate Bank of Washington, N.A., Seattle, Washington. That merger involved both in-state and out-of-state bidders. That transaction resulted in an approximate cost of $44 million, including the $20 million savings resulting from inclusion of out-of-state bidders. The $44 million cost was $121 million less than the estimated $165 million cost of a payoff.
A recent estimate of losses per transaction type is shown in Table 5-3.
Table 5-3
| 1982 Losses by Transaction Type ($ in Millions) | ||||
|---|---|---|---|---|
| Transaction Type | Number of Transactions | Total Assets | Losses | Losses as a Percent of Assets |
| OBA | 8 | $9,940.4 | $1,018.2 | 10.24% |
| P&As | 27 | 1,279.1 | 79.4 | 6.21% |
| Payoffs | 7 | 503.1 | 71.0 | 14.11% |
| Totals | 42 | $11,722.6 | $1,168.6 | 9.97% |
Source: Reports from FDIC Division of Research and Statistics.
Prior to 1982, common thinking among large depositors was that no big bank would ever fail, and no bank over $100 million would be paid off. Large troubled institutions were merged, were provided open bank assistance, or were resolved through a P&A transaction. All of those methods of resolution provided depositors with full protection even if a portion of their funds was uninsured. Large depositors placed money in the institutions that paid the highest interest, without regard to the institutions’ stability or the insurance level, confident that they would receive their funds. On July 5, 1982, that thinking changed with the failure of Penn Square Bank, N. A., (Penn Square) Oklahoma City, Oklahoma.
Penn Square had been paying high interest rates in order to attract cash, which it invested in high-risk oil and gas exploration loans. The bank then sold portions of the loans to other financial institutions for cash, a process known as selling “participations.” With the money it received from selling the participations, Penn Square made even more high-risk loans. By the time it failed, Penn Square, which had only $436.5 million in assets of its own, sold loan participations totaling more than four times that amount to other banks. More than $2 billion in oil and gas participations were held by five major U.S. banks: Continental Illinois National Bank and Trust Company, Chicago, Illinois held $1 billion in those participations. Most of the remaining participations were held by Chase Manhattan Bank, New York, New York; Michigan National Bank, Lansing, Michigan; Seattle First National Bank, Seattle, Washington; and Northern Trust Company, Chicago, Illinois.
Due to the heavy volume of participations and questions about the accuracy of information furnished to loan purchasers, a substantial volume of lawsuits was anticipated from the failure of Penn Square. If the suits were successful, the cost to the FDIC of a P&A transaction ultimately would have been substantial. The FDIC’s only alternative was a payoff of insured deposits. The FDIC used the unusual approach of establishing a Deposit Insurance National Bank (DINB). Insured deposits totaling approximately $207.5 million were transferred to that newly established bank ran by the FDIC. All other claimants would share in the proceeds from the liquidation of the assets of the failed bank. To allow the insured depositors immediate access to their funds, FDIC Chairman William M. Isaac was quoted as saying: “We’ll keep the bank open 24 hours a day if necessary to meet the demand. We’ll be in the bank all night long if we have to.” 5-14
The Banking Act of 1933 authorized the FDIC to establish a Deposit Insurance National Bank (DINB) to assume the insured deposits of a failed bank. A DINB had a limited life of two years; it continued to insure deposits still in the bank, but could not make loans. Depositors were given up to two years to move their deposit accounts to other institutions.
The DINB existed for slightly more than 13 months until August 18, 1983, when the FDIC signed an agreement with Charter National Bank, N.A., (Charter National) to assume the remaining $458,400 in deposits from the DINB. All depositors who had not voluntarily withdrawn their funds from the DINB were transferred to Charter National.
During the first 18 months after Penn Square’s closing, as of December 29, 1983, the FDIC had collected $500.4 million from the bank’s assets, including the amount that was collected from borrowers on the more than $2 billion in participated loans. Of the total, $235.1 million was paid to holders of loan participations sold by Penn Square, $5.7 million was paid to the Federal Reserve Bank of Dallas for accrued advances to Penn Square, $16.9 million was paid to owners of pledged deposits, and $88.2 million was paid to uninsured depositors and other creditors, including the FDIC, which held receivership certificates for claims.
In closing Penn Square, the FDIC also paid advance dividends; however, the first dividend payment was not made until March 1983. Uninsured depositors and other claimants ultimately were paid 70 percent of their claims. Claims totaled $486.5 million, the largest of which was held by the FDIC’s deposit insurance fund. The FDIC was owed $217 million for paying off the insured deposits. Among the uninsured depositors were 29 commercial banks, 44 savings and loan associations, and 221 credit unions.
Advance Dividends were paid on claims of uninsured depositors and general trade creditors based on the estimated recovery of the failed bank’s assets. Uninsured depositors and other creditors holding receivership certificates were paid a portion of their claims soon after closing. Advance dividends provided uninsured depositors with an opportunity to realize an earlier return on the uninsured portion of their deposits without eliminating the incentive for large depositors to exercise market discipline.
Payments to Depositors and Other Creditors. In the 42 banks that failed or were assisted in 1982, there were 1,964,458 deposit accounts totaling $10.2 billion. Of those totals, the seven deposit payoffs represented 39,605 deposit accounts with $451.9 million in total deposits. The eight assistance agreements represented 1,723,740 deposit accounts with deposits totaling $8.6 billion.
Since the inception of the FDIC in January 1934, until December 31, 1982, there were 620 banks5-15 that had failed or were assisted with an aggregate of 6.5 million deposit accounts and deposits totaled nearly $20 billion. In meeting its responsibilities, the FDIC as insurer disbursed $7.6 billion and as liquidator recovered $5.8 billion, for a net loss to the FDIC of $1.8 billion since it began operations.
Of the 319 payoffs since the FDIC began operations, recovery of uninsured portions of deposits varied from case-to-case; however, in the aggregate, 79.6 percent had been paid by December 31, 1982. In contrast, 97.2 percent of uninsured deposits had been paid by the end of 1981. The marked decrease in the recovery rate for uninsured deposits was due almost entirely to the failure of Penn Square. That bank had an unusually high volume of deposits exceeding the insurance limit. Because of the complexity of the receivership and the existence of numerous potential claims that needed to be analyzed, no payment from the proceeds of liquidated assets could be made to Penn Square creditors, including the uninsured depositors, in 1982.
Asset Disposition
At the beginning of 1982, the FDIC held $1.8 billion in assets for liquidation from failed institutions. There were 34 commercial bank failures with total assets of $1.8 billion. The FDIC collected a total of $118 million through the end of November. At the end of November 1982,5-16 total assets in liquidation were $2.2 billion, a 22.2 percent increase since the beginning of the year.
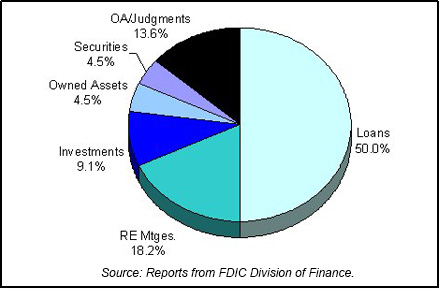
Until the mid-1980s, there were not many bank failures; therefore, Division of Liquidation operations were not extensive. As bank failure activity began to increase, the FDIC approved a reorganization of its Division of Liquidation and established area liquidation offices in five cities. The first office, located in New York City, opened in November. Other offices were scheduled to open in Atlanta, Chicago, Dallas, and San Francisco the following year. Table 5-4 shows FDIC’s assets in liquidation and Chart 5-1 shows the asset mix.
Table 5-4
| 1982 FDIC End of the Year Assets in Liquidation ($ in Billions) | |||
|---|---|---|---|
| Asset Type | 12/31/81 Book Value | 12/31/82* Book Value |
12/31/82 Estimated Recovery Value |
| Loans | $0.8 | $1.1 | $0.5 |
| Real Estate Mortgages | 0.3 | 0.4 | 0.3 |
| Investments | 0.1 | 0.2 | 0.2 |
| Owned Assets | 0.1 | 0.1 | 0.1 |
| Charge-Offs | 0.0 | 0.0 | 0.0 |
| Securities | 0.3 | 0.1 | 0.0 |
| Other Assets/Judgments | 0.2 | 0.3 | 0.1 |
| Total | $1.8 | $2.2 | $1.2 |
Source: Reports from FDIC Division of Finance.
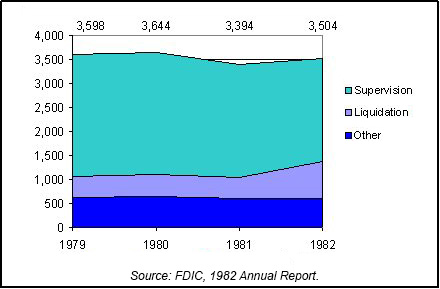
Insurance Fund and Staffing
The deposit insurance fund grew in 1982 despite the expense to the FDIC resulting from the high bank failure rate. The deposit insurance fund reached a new year-end high of $13.8 billion, an increase of $1.5 billion or 12.5 percent over 1981. Total staffing for the FDIC grew from 3,394 at the end of 1981 to 3,504 at the end of 1982. The Division of Liquidation staff almost doubled, rising from 429 at the end of 1981 to 778 at the end of 1982. The Division of Bank Supervision staff, on the other hand, fell from 2,359 at the end of 1981 to 2,129 at the end of 1982. Chart 5-2 shows the staffing levels for the past four years.
5-1 Bureau of Economic Analysis and CB Commercial Torto/Wheaton Research. Back to text
5-2 Bureau of Labor Statistics, Department of Labor. Back to text
5-3 Housing Market Statistics, National Association of Home Builders (June 1996), and Federal Home Loan Mortgage Corporation. Back to text
5-4 Bureau of Labor Statistics, Department of Labor. Back to text
5-5 Housing Market Statistics, National Association of Home Builders (June 1996), and CB Commercial Torto/Wheaton Research. Back to text
5-6 Bureau of Economic Analysis, Department of Commerce. Back to text
5-7 Economic Report of the Governor, 1983, 1. Back to text
5-8 Economic Research Service, U.S. Department of Agriculture. National Agricultural Statistics Service, U.S. Department of Agriculture. Back to text
5-9 Bureau of the Census, Building Permits Section, Manpower and Construction Statistics Branch, and FW Dodge/McGraw-Hill. Back to text
5-10 CB Commercial Torto/Wheaton Research. Back to text
5-11 Federal Financial Institutions Examination Council, Country Exposure Report, year end. Back to text
5-12 Philip A. Wellons, Passing the Buck: Banks, Government and Third World Debt (1987), 225. Back to text
5-13 Seidman, Full Faith and Credit, 127. Back to text
5-14 Phillip L. Zweig, Belly Up, (New York: Crown Publishers, Inc., 1985), 410 Back to text
5-15 This figure does not include open bank assistance transactions from 1934-1980. The FDIC did not begin including assistance agreements with the failures for reporting purposes until 1981. Five assistance agreements, with total deposits of $6.8 billion, should be included in the overall totals. Back to text
5-16 Year end data was unavailable. Back to text
Table of Contents