
Managing the Crisis: The FDIC and RTC Experience — Chronological Overview
Chapter Eighteen: 1995
Chairman Ricki Helfer stated in the 1995 Annual Report, “For three generations of Americans, federal deposit insurance ? with the full faith and credit backing of the U.S. government – has provided a reason for unconditional faith in the banking system. It is a certainty in an uncertain world. The FDIC will continue to make sure that faith in the banking system is justified.”
Table 18-1
| 1994 - 1995: FDIC at a Glance ($ in Millions) | |||
|---|---|---|---|
| 12/31/94 | 12/31/95 | Percent Change | |
| Number of Bank Failures | 13 | 6 | -53.85% |
| Total Assets of Failed and Assisted Banks | $3,828.9 | $1,463.9 | -61.77% |
| Estimated Losses on Failed and Assisted Banks |
$179.0 | $84.5 | -52.79% |
| Estimated Losses as a Percent of Total Assets | 12.23% | 10.53% | -13.90% |
| Assets in Liquidation | $16,737.9 | $10,308.2 | -38.41% |
| FDIC Staffing | 11,627 | 9,789 | -15.81% |
| Number of Problem Financial Institutions |
264 | 193 | -26.89% |
| Bank Insurance Fund Balance | $21,847.8 | $25,453.7 | 16.50% |
| Bank Insurance Fund Balance as a Percent of Insured Deposits | 1.15% | 1.30% | 13.04% |
| Savings Insurance Fund Balance | $1,936.7 | $3,357.8 | 73.38% |
| Savings Insurance Fund Balance as a Percent of Insured Deposits | 0.28% | 0.47% | 67.86% |
Source: FDIC, 1995 Annual Report and Reports from FDIC Division of Finance and Division of Research and Statistics.
Notable Events
- In February, the FDIC unveiled its World Wide Web page on the Internet, providing the public with ready access to FDIC consumer information, press releases, and statistics on banking.
- On April 1, the FDIC began a system to invoice and collect deposit insurance premiums electronically. The new arrangement will make the process of calculating and collecting insurance assessments more efficient and less burdensome. With the new method, the FDIC experienced an error rate of less than 0.1 percent, a significant improvement over the error rate of 8 to 13 percent under the previous manual, paper-based system. The new process further proved its value in September 1995, when the FDIC used it to refund $1.5 billion to BIF-insured institutions within 10 days of a recapitalization announcement.
- On Apri1 24, for the first time in the agency's 61-year history, the Board approved a corporate-wide strategic plan. Major goals centered on identifying and addressing risks to the insurance funds and improving communications with the public.
- On May 17, the FDIC announced a reorganization that included the creation of four new divisions: the Division of Insurance (DOI) to identify risks to the insurance funds; the Office of the Ombudsman (OO) to respond to questions or concerns about the FDIC; the Division of Administration (DOA) which consolidated the three separate offices of personnel management, corporate services, and staff training; and the Office of Policy Development (PD) to coordinate policy development among all FDIC Divisions and Offices, to evaluate the policy implication of regulatory and legislative proposals, and to quickly update corporate positions on emerging issues.
- On July 28, the last two FDIC-insured bank closings of 1995 occurred, bringing the total for the year to six, which was the lowest number since 1977.
- On August 8, the FDIC Board voted to reduce premiums paid by institutions insured by the Bank Insurance Fund in recognition of the health of the banking industry and the increased strength of the fund. The Board did not reduce assessment rates for the Savings Association Insurance Fund (SAIF), which remained seriously undercapitalized.
- On November 2, the FDIC, the Federal Reserve Board, and the New York State Banking Department issued joint cease-and-desist orders against The Daiwa Bank, Limited, Osaka, Japan and its insured New York subsidiary, Daiwa Bank Trust Company. In September, Daiwa disclosed approximately $1.1 billion in securities trading losses at its New York City branch after having concealed those losses from bank regulators.
- On November 9, the FDIC announced a program to reduce staffing levels by offering many career employees incentives to retire or to voluntarily seek other employment.
- On November 14, the FDIC reduced insurance premiums for a second time for BIF-insured institutions. The rates for the seriously undercapitalized SAIF fund were not reduced.
- On December 22, Mississippi Banking Commissioner Joseph H. Neely was confirmed by the U. S. Senate to be a member of the FDIC Board of Directors. He was sworn in on January 29, 1996. This marked the first time since August 1992 that all five Board positions were filled.
- December 31, the Resolution Trust Corporation (RTC), created in 1989 to manage and sell failed savings associations officially closed. All remaining assets and liabilities were transferred to the FDIC-managed FSLIC Resolution Fund (FRF). The FRF was established by law in 1989 to assume the assets and obligations of the former FSLIC thrifts that failed prior to January 1, 1989.
Economic/Banking Conditions
The U.S. economy grew by an impressive 4.9 percent during 1995, as measured by GDP. Even so, unemployment rose slightly from 5.5 percent to 5.6 percent. However, this slight rise reflects a sharp increase in the number of persons seeking employment. The number of employed persons rose by roughly 360,000, or 2.9 percent, to 125,088,000. New home sales were virtually unchanged from the 1994 level of 670,000, down to 667,000. By contrast, the number of new housing starts fell by 103,000 or 7.1 percent during the period.18-1
Inflation was meager at 2.5 percent, and the interest rate environment was mixed. The discount rate rose 50 basis points from 4.75 percent to 5.25 percent, while 30-year mortgage rates fell by 202 basis points from 9.53 percent to 7.51 percent. Because new housing starts during the previous year totaled more than twice the number of new homes sold, home builders backed off in new starts from the 1994 level. While home builders paused a briefly to allow demand to catch up to supply, office space demand actually increased, producing a 140 basis-point drop in the vacancy rate from 15 percent to 13.6 percent.
Commercial banks experienced continued increases in profitability and asset growth. Net income increased almost 10 percent to $49 billion. Loan quality was also good, and delinquency and charge-off rates remained low in all areas except consumer and credit card loans.
Commercial bank assets increased by 8 percent. Equity capital also grew $37.5 billion or 12 percent. Non-interest income increased by $6.2 billion, or 10.6 percent, reflecting strong growth in fee income. Non-interest expense increased only 4.5 percent. This can be attributed to the improvement in operating efficiency which was largely due to decreases in employee costs and occupancy costs relative to total revenue.
Commercial and Industrial loans experienced their largest increase in the last 15 years. In addition, commercial real estate loans increased by 5.75 percent. Consumer loans and consumer debt also increased. The increase in both of these areas is related to the rise in credit card use. Credit cards were becoming more accepted by consumers in ‘nontraditional’ places, such as the grocery store.
Banks depended on managed liabilities as a source to fund asset growth. Previously, banks used borrowings from abroad. However, because of the decrease in deposit insurance premiums, banks were able to use large time deposits as source of funds for the first time. Core deposits became significant source of funds, which had previously been declining last year. Savings accounts rose due to the establishment of ‘sweep accounts.’ 18-2
At end of 1995, there were 12,009 financial institutions in the United States and 193 institutions18-3 on the problem bank list.18-4
Table 18-2 shows the number and total assets of FDIC insured institutions, as well as their profitability as of the end of 1995.
Table 18-2
Open Financial Institutions Insured by FDIC ($ in Billions)
| BIF Members | |||
|---|---|---|---|
| 1994 | 1995 | Percent Change | |
| Number | 10,760 | 10,243 | -4.80% |
| Total Assets | $4,248.3 | $4,577.9 | 7.76% |
| Return on Assets | 1.14% | 1.15% | 0.88% |
| Return on Equity | 14.43% | 14.32% | -0.76% |
| SAIF Members | |||
|---|---|---|---|
| Item | 1994 | 1995 | Percent Change |
| Number | 1,843 | 1,727 | -6.29% |
| Total Assets | $770.8 | $760.5 | -1.34% |
| Return on Assets | 0.56% | 0.76% | 35.71% |
| Return on Equity | 7.16% | 9.47% | 32.26% |
| US Branches of Foreign Banks | 51 | 39 | -23.53% |
Source: FDIC Quarterly Banking Profile, Fourth Quarter 2001.
Bank Failures
During 1995, the FDIC resolved six FDIC-insured institutions, and the failed institutions had combined assets of approximately $802.1 million. The size of the bank failures in 1995 was the lowest since 1980 when failed bank assets totaled $239.3 million, and the number of failures was the lowest since 1977 when there were also only six failures.
A recent estimate of losses per transaction type is shown in Table 18-3.
Table 18-3
| 1995 Estimated Losses by Transaction Type ($ in Millions) | ||||
|---|---|---|---|---|
| Transaction Type | Number of Transactions | Total Assets | Estimated Loss* as of 12/31/03 | Estimated Losses as a Percent of Assets |
| P&As | 6 | $802.1 | $84.5 | 10.53% |
Source: Reports from FDIC Website ? Historical Statistics on Banking.
Payments to Depositors and Other Creditors
In the six financial institutions that failed in 1995, deposits totaled $776.4 million in 47,651 deposit accounts. Dividends paid on all active receiverships totaled over $3.9 billion in 1995.
There have been a total of 2,127 18-5 insured financial institution resolutions since the FDIC began operations in 1934. Of this total, 1,445 were P&A transactions, 79 were open bank assistance transactions, and 603 were deposit payoff transactions.
Total disbursements by the FDIC since January 1, 1934, have amounted to $104.3 billion. Of that amount, actual and projected recoveries are anticipated to be approximately $67.4 billion, which equates to a projected loss of $36.9 billion to the BIF fund.
Asset Disposition
At the beginning of 1995, the FDIC held $16.7 billion in assets from failed institutions, and acquired some $550 million in assets from the six financial institutions that failed during the year. The FDIC successfully collected, sold, or otherwise resolved 40 percent, or almost $7 billion, of its asset inventory during the year. This included 2,687 real estate properties which were sold for $573.3 million, representing 94.3 percent of their appraised value. Also included were over 23,750 loans and other assets totaling $2 billion that were sold in sealed-bid and other asset marketing events, resulting in sales proceeds of 97.7 percent of the appraised value of these assets. At year-end 1995, the FDIC held $10.3 billion in assets for liquidation. That included $8.8 billion in BIF assets, $6 million in SAIF assets, and $1.5 billion in FRF assets.
The congressional appropriation for affordable housing was reduced from $15 million to $3.7 million during the year. Notwithstanding this reduction, the FDIC was able to help qualified buyers purchase 412 single-family properties during the year. In addition, eight multifamily properties containing 225 units were sold to nonprofit organizations and public agencies.
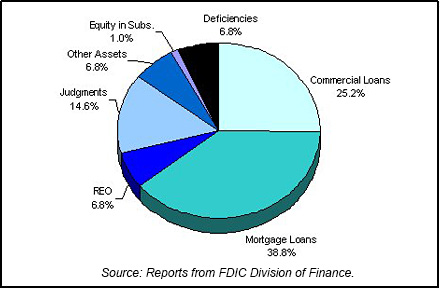
Other financial recoveries during the year included $252 million from professional liability settlements or judgments, and $7.6 million in collections from court-ordered restitution from individuals convicted of bank fraud. Table 18-4 shows the FDIC's assets in liquidation and Chart 18-1 shows the asset mix.
Table 18-4 shows the FDIC's assets in liquidation and Chart 18-1 shows the asset mix.
Table 18-4
| 1995 FDIC End of the Year Assets in Liquidation ($ in Billions*) | ||||||
|---|---|---|---|---|---|---|
| Asset Type | 12/31/94 Book Value | 1995 Assets Acquired | 1995 Prin. Coll. | 1995 Write Downs | 12/31/95 Book Value | 12/31/95 Est. Rec. Value |
| Commercial Loans | $4.5 | 0.3 | -0.2 | 2.0 | $2.6 | |
| Mortgage Loans | 6.4 | 0.2 | 0.5 | 3.2 | 4.0 | |
| Other Loans | 0.2 | 0.0 | 0.0 | 0.1 | 0.0 | |
| Real Estate Owned | 1.1 | 0.1 | 0.2 | 0.8 | 1.5 | |
| Judgments | 1.7 | 0.0 | 0.5 | 0.8 | 1.5 | |
| Securities | 0.2 | 0.0 | -0.1 | -0.1 | 0.0 | |
| Other Assets | 1.3 | 0.0 | 0.2 | 0.7 | 0.7 | |
| Equity in Subs. | 0.2 | 0.0 | 0.0 | 0.1 | 0.1 | |
| Deficiencies | 1.1 | 0.0 | 0.3 | 0.7 | 0.7 | |
| Totals | $16.7 | $0.6 | $1.4 | $8.3 | $10.3 | |
Source: Reports from FDIC Division of Finance.
Insurance Fund and Staffing
With the continuing recovery of the banking industry and institution's earnings at record levels, 1995 was another positive year for the BIF. The BIF grew to a record high of $25.5 billion at the close of 1995, which represented a 16.5 percent increase from the year-end 1994 balance of $21.8 billion. The BIF was in the strongest position it had experienced since 1971, which was the last time the bank deposit insurance fund exceeded 1.25 percent of insured deposits. The SAIF grew to a balance of $3.4 billion at year-end, which represented a 73.4 percent increase over year-end 1994.
In May, Chairman Helfer announced significant organizational changes.
Including the creation of a Division of Insurance, an Office of the Ombudsman, a Division of Administration, and an Office of Policy Development. The Division of Administration consolidated the functions of three separate offices for personnel management, corporate services, and staff training.
In November, senior management announced a two-phased buyout program for career FDIC and RTC employees with incentives either to retire or voluntarily resign. Employees in the first phase were eligible to leave by year-end, and more than 300 accepted. Employees in the second phase began leaving during the first quarter of 1996 through the third quarter of 1997. For both phases, 940 employees accepted the buyout offer.
The RTC staffing totals include employees who were organizationally transferred from the RTC to the FDIC in Spring/Summer 1995 but who continued to work exclusively on RTC functions throughout 1995. The RTC totals also include certain FDIC employees in Chicago who were dedicated to RTC functions early in 1995, and who worked exclusively on these RTC functions for the balance of 1995.
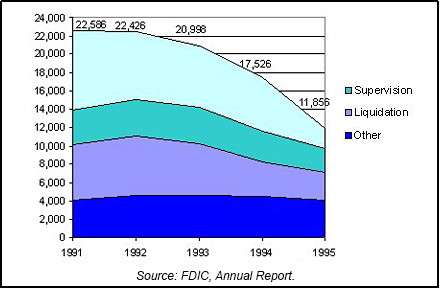
At year-end, the FDIC had 9,789 employees (RTC employees totaled 2,067), down approximately 16 percent from year-end 1994 and 37 percent below the peak level in the second quarter of 1993. These figures reflect the continuing decline in agency workload from bank failures. Total staffing including the RTC employees equaled 11,856. Chart 18-2 shows the staffing levels for the past five years.
Table 18-5
Resolution Trust Corporation
| 1994 - 1995: RTC at a Glance ($ in Millions) | |||
|---|---|---|---|
| 12/31/94 | 12/31/95 | Percent Change | |
| Number of Conservatorships at the beginning of the year | 63 | 1 | -98.41% |
| Number of Conservatorships added during the year | 0 | 0 | 0.00% |
| Thrifts in the ARP Program |
2 | 2 | 0.00% |
| Total of all thrift takeovers | 2 | 2 | 0.00% |
| Conservatorships resolved during the year | 2 | 2 | 0.00% |
| Total of thrift resolutions | 64 | 3 | -95.31% |
| Conservatorships at the end of the year | 1 | 0 | -100.00% |
| Total Assets at Takeover | |||
|---|---|---|---|
| 12/31/94 | 12/31/95 | Percent Change | |
| Conservatorships | $0 | $0 | 0.00% |
| Thrifts in the ARP Program | $129 | $426 | 230.23% |
| Total | $129 | $426 | 230.23% |
| Estimated losses on thrift resolutions |
$15 | $63 | 320.00% |
| Estimated losses as a percent of total assets | 11.93% | 14.79% | 23.97% |
| Assets in Liquidation | |||
|---|---|---|---|
| 12/31/94 | 12/31/95 | Percent Change | |
| Conservatorships | $2,067 | $0 | -100.00% |
| Receiverships | $22,900 | $7,689 | -66.42% |
| Total | $24,967 | $7,689 | -69.20% |
| RTC Staffing | 5,899 | 2,067 | -64.96% |
Source: RTC August 1989/September 1995 Statistical Abstract (Amended April 1996) and Reports from FDIC Division of Research and Statistics.
Notable Events
The RTC ceased operations on December 31, 1995, and transferred all employees, remaining assets, liabilities, and responsibilities to the FDIC. During its lifetime, the RTC resolved 747 thrift institutions, including 706 conservatorships. Since its inception through December 31, 1995, the RTC had disposed of assets with a book value of $455 billion, or nearly 98 percent of the approximately $465 billion (book value) in assets for which it had been responsible.
S&L Resolutions
In 1995, the RTC resolved three thrifts. At the start of 1995, one thrift with total assets of $2.1 billion was in the RTC's conservatorship program. No new thrifts entered the program during 1995; and the one remaining thrift was subsequently resolved, leaving no thrifts in the conservatorship program at the end of 1995.
In 1995, all three thrift resolutions were purchase and assumption (P&A) transactions, and all deposits were transferred to the acquirers. The three thrifts had total assets of $1.7 billion.
Table 18-6 shows conservatorships and receiverships at year-end 1995.
Table 18-6
| Conservatorships | |
|---|---|
| Item | Total |
| In Conservatorship at 12/31/94 | 1 |
| Conservatorships added in 1995 | 0 |
| Subtotal | 1 |
| Conservatorships resolved in 1995 (New Receiverships) | 1 |
| Conservatorships remaining 12/31/95 | 0 |
| Receiverships | |
|---|---|
| Item | Total |
| Receiverships as of 12/31/94 | 744 |
| New Receiverships that were previously Conservatorships in 1995 | 2 |
| New Receiverships that were resolved through ARP in 1995 | 1 |
| Total Receiverships during 1995 | 3 |
| Total Receiverships as of 12/31/95 | 747 |
Source: RTC August 1989/September 1995 Statistical Abstract (Amended April 1996).
Payments to Depositors and Other Creditors
In 1995, there were three resolutions with total deposits of $1.8 billion in 227,980 deposit accounts.
Of the 747 insured thrift failures since the RTC began operations in August of 1989, 497 were P&A transactions, 92 were payoff transactions, and 158 were insured deposit transfers.
Asset Disposition
At the beginning of 1995, the RTC held $25 billion in assets from savings and loan associations in receivership and conservatorship. Assets acquired during the year through conservatorships, other resolved institutions, and putbacks or repurchases totaled $1.2 billion for the year. Losses and collections totaled $18.5 billion for the year. At the end of 1995, the RTC's remaining inventory of assets in liquidation totaled $7.7 billion.
Table 18-7 shows the RTC's assets in liquidation and Chart 18-3 shows the asset mix.
Table 18-7
| 1995 RTC End of the Year Assets in Liquidation ($ in Billions*) | ||||||
|---|---|---|---|---|---|---|
| Asset Type | 12/31/94 Total Book Value | Assets Acq'd During the Year | 1995 Collections | 1995 Losses | 12/31/95 Total Book Value | Memo Item |
| 1-4 Family Mtges | $4.8 | $0.2 | $2.9 | $1.6 | $0.5 | $0.7 |
| Other Mtges | 6.5 | 0.4 | 3.5 | 2.0 | 1.4 | 0.1 |
| Other Loans | 2.2 | 0.0 | 1.1 | 0.6 | 0.5 | 0.0 |
| Real Estate Owned | 2.1 | 0.0 | 0.9 | 0.4 | 0.8 | 0.0 |
| Other Assets | 6.0 | 0.0 | 1.3 | 1.5 | 3.2 | 0.0 |
| Cash/Securities | 3.4 | 0.6 | 3.2 | -0.5 | 1.3 | 0.5 |
| Totals | $25.0 | $1.2 | $12.9 | $5.6 | $7.7 | $1.3 |
Memo Item: Assets transferred from conservatorship to receivership. Does not affect total of assets in liquidation.
Source: RTC August 1989/September 1995 Statistical Abstract.

Staffing
As previously discussed, the FDIC accepted 132 available permanent RTC employees as FDIC vacancies occurred during 1994. Total RTC staff at the end of 1994 was 5,899, which was down from 6,778 at the end of 1993.
18-1 Bureau of Labor and Statistics, Department of Labor; Bureau of Economic Analysis, Department of Commerce; Housing Market Statistics, National Association of Home Builders; and Federal Home Loan Mortgage Corporation. Back to Text
18-2 Federal Reserve Bulletin Volume 82, Number 6, June 1996. Back to Text
18-3 Starting in 1995, the figure for problem institutions includes both commercial and savings institutions. Back to Text
18-4 FDIC Quarterly Banking Profile, Fourth Quarter 1995. Back to Text
18-5 In 1988 there were 21 assistance agreements that resolved 79 institutions. The FDIC annual report (source data) calculates failure data per transaction; this report calculates failures per failed institution. Actual resolutions through 1995 totaled 2,185. Back to Text
Table of Contents