|
Home > About FDIC > Financial Reports > 1998 Annual Report |
|||
|
1998 Annual Report |
||
State of the Banking and Thrift Industries |
|
The economic environment remained largely favorable for commercial
banks and savings institutions in 1998. These favorable conditions were reflected in
record earnings for both industries. Commercial bank earnings set a new record for the
seventh consecutive year, surpassing $60 billion for the first time, while savings
institutions enjoyed their second consecutive year of record profits, passing $10 billion
for the first time. Never before had both industries registered a return on average assets
(ROA) above one percent. They overcame declining net interest margins and higher expenses
related to mergers and restructuring charges with the help of strong growth in assets and
fee income, and relatively low expenses for credit-quality problems. Only three commercial
banks failed during the year and, for the second consecutive year, no insured savings
institution failed. The following is an overview of conditions in these two industries.
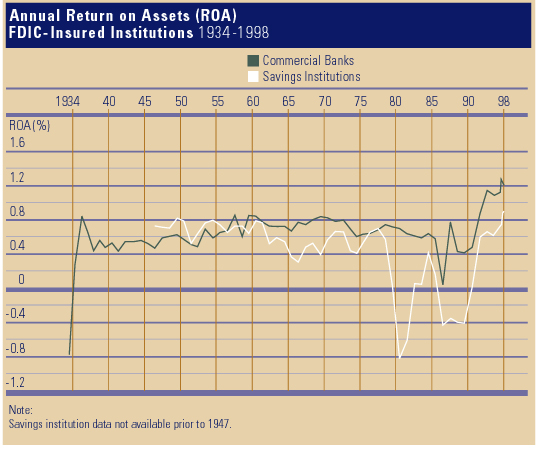
Insured commercial banks posted record earnings of $61.9 billion in 1998, an increase
of $2.8 billion The improvement in earnings was limited by a $24.1 billion increase in noninterest expense, a $2.4 billion increase in loan-loss provisioning, and a 14-basis point decline in the average net interest margin. Restructuring charges related to mergers at several large institutions accounted for much of the rise in noninterest expenses. The higher provisions for credit losses mirrored an increase in charge-offs and noncurrent loans. The decline in the industry’s net interest margin—the difference between the average yield on interest-bearing assets and the average cost of funding those assets—was caused by a combination of declining asset yields and rising funding costs. The year marked the sixth consecutive time that the industry’s margin declined, and the 14-basis point drop was the steepest year-to-year decline since 1974-75, when it fell by 30 basis points. The average ROA fell to 1.19 percent in 1998 from 1.23 percent in 1997. Despite the decline, 1998 was the sixth consecutive year that the industry’s ROA had been above one percent, a level first achieved by the industry in 1993. Almost two out of every three banks (63.2 percent) registered an ROA of one percent or better in 1998. Almost as many (61.8 percent) reported higher earnings than in 1997. Business loan growth was especially strong in 1998. Loans to commercial and industrial borrowers increased by $103 billion (12.9 percent), while real estate loans secured by commercial properties grew by $30 billion (8.9 percent) and construction and land development loans rose by $18 billion (20.9 percent). In addition to the growth in direct loans, banks’ holdings of mortgage-backed securities increased by $86 billion (22.4 percent). Banks continued to expand their credit card lending, but the amount of credit card loans on banks’ balance sheets declined by $2 billion during 1998 because of an increase in securitization activity. The amount of credit card loans securitized and sold by banks rose by $63 billion in 1998 to $254 billion at year-end. These securitized receivables now exceed the amount of credit card loans remaining on banks’ balance sheets. A fourth-quarter surge helped deposits register their largest annual percent increase since 1986. Total deposits increased by $260 billion (7.6 percent) during 1998. Nevertheless, deposit growth failed to keep pace with growth in total assets, and the share of commercial bank assets that are funded by deposits declined for the seventh consecutive year. As recently as 1991, deposits funded 78.3 percent of commercial bank assets. At the end of 1998, deposits funded slightly more than two out of every three dollars of assets (67.7 percent). The shortfall in deposit funding was covered by growth in nondeposit borrowings and equity capital. Asset quality deteriorated slightly in 1998, as both credit losses and noncurrent loans increased. Banks charged off $20.7 billion in loans in 1998, an increase of $2.4 billion (13.0 percent) over 1997. Non-current loans increased for the first year since 1990, rising by $2.7 billion. For the fourth time in as many years, credit card loans comprised more than half of all loans charged off by commercial banks. Net charge-offs of credit card loans totaled $11.5 billion in 1998, or 55.4 percent of all loan charge-offs. The increase in noncurrent loans was led by a $2.2 billion rise in noncurrent commercial and industrial loans. Despite the growth in noncurrent loans, the percentage of loans that were noncurrent at year-end (0.96 percent) was unchanged from a year earlier because of growth in banks’ loan portfolios. This noncurrent rate is only slightly above the record low level of 0.94 percent, reached at the end of the second and third quarters of 1998. The number of insured commercial banks declined for the 14th year in a row. At year-end 1998, there were 8,774 commercial banks reporting financial results, a decline of 368 banks during the year. Mergers absorbed 557 banks, and three banks failed, while there were 190 new banks chartered and two noninsured institutions became insured. At year-end 1998, there were 5,708 fewer insured commercial banks than at the end of 1984, a decline of 39.4 percent. The number of commercial banks on the FDIC’s "Problem List" declined from 71 institutions to 69 (with $5.4 billion in assets) during the year.
Insured savings institutions earned $10.2 billion in 1998, an increase of $1.4 billion (15.6 percent) from 1997. Noninterest income was $2.2 billion (30.9 percent) higher than in 1997, and gains from sales of securities and other assets were $1.2 billion (95.0 percent) higher. Earnings also received a boost from increased net interest income (up $554 million, or 1.9 percent) and lower credit-loss provisions (down $413 million, or 18.9 percent). These improvements were partially offset by a $2.5 billion (11.7 percent) rise in noninterest expenses. The industry’s ROA rose to 1.01 percent in 1998 from 0.93 percent in 1997. For the first year since 1946, federally insured thrifts posted an ROA above one percent. Unlike the commercial banking industry, high profitability was not as widespread among insured savings institutions. Fewer than one in three thrifts (30.5 percent) had an ROA of one percent or higher in 1998, but this group included many of the largest savings institutions. Smaller thrifts were generally less profitable than their larger counterparts. As with commercial banks, insured savings institutions experienced a sharp decline in net interest margins in 1998. For the year, the thrift industry’s net interest margin was 3.10 percent, down from 3.23 percent in 1997. The modest improvement in net interest income in 1998 was entirely the result of strong asset growth. Assets of savings institutions increased by over $61 billion (6.0 percent) during 1998, the largest increase in industry assets in 10 years. The increase in thrift industry assets in 1998 consisted primarily of assets other than loans. In an environment of low interest rates, most residential mortgage loan demand was for fixed-rate loans; a considerable share of mortgage lending in 1998 represented refinancing of higher-rate, fixed-rate mortgages and adjustable-rate mortgages. Lenders preferred not to retain these long-term, fixed-rate assets, opting instead to securitize and sell many new mortgage loans. While thrifts’ 1-to-4 family residential mortgage loans increased by $11 billion (2.2 percent) in 1998, their holdings of mortgage-backed securities grew by $26 billion (14.6 percent). Deposit growth at savings institutions in 1998 was negligible. Total deposits increased by only $395 million (0.1 percent). Funding for asset growth came from nondeposit borrowings, including Federal Home Loan Bank advances. Equity capital increased by over $5 billion (5.7 percent) in 1998, but the industry’s equity-to-assets ratio fell slightly, from 8.71 percent at year-end 1997 to 8.68 percent at year-end 1998. The number of insured savings institutions declined by 93 institutions in 1998. Mergers absorbed 114 thrifts, while 28 new savings institutions were chartered—the largest number since 1990. Thrifts converting to commercial bank charters accounted for most of the remaining reduction in thrift numbers. For the second consecutive year, no insured savings institutions failed. The number of insured thrifts on the FDIC’s "Problem List" fell from 21 to 15 during 1998. Assets of "problem" thrifts totaled $5.9 billion at year-end. |
| FDIC HOME | TOP OF REPORT | CONTENTS | PREVIOUS PAGE | NEXT PAGE |
| Last Updated 03/21/2000 | communications@fdic.gov |