
|
 |
DIF
Income Statement -
First Quarter 2008
| Fund Financial Results |
($
in millions) |
| Income
Statement |
| |
(unaudited) Mar-08 |
(audited) Dec-07 |
(unaudited) Mar-07 |
Year-Over-Year Change |
| Assessments earned |
$448 |
$643 |
$94 |
$354 |
| Interest earned on investment securities |
618 |
2,540 |
567 |
51 |
| Other revenue |
1 |
14 |
4 |
(3) |
| Total Revenue |
$1,067 |
$3,197 |
$665 |
$402 |
| Operating expenses (includes depreciation expense) |
238 |
993 |
239 |
(1) |
| Provision for insurance losses |
525 |
95 |
(73) |
598 |
| Other expenses |
1 |
3 |
0 |
1 |
| Total
Expenses & Losses |
$764 |
$1,091 |
$166 |
$598 |
| Net Income |
$303 |
$2,106 |
$499 |
$(196) |
| Unrealized gain/(loss) on available-for-sale securities, net |
127 |
125 |
81 |
46 |
| Unrealized postretirement benefit gain/(loss) |
0 |
17 |
0 |
0 |
| YTD Comprehensive Income |
$430 |
$2,248 |
$580 |
$(150) |

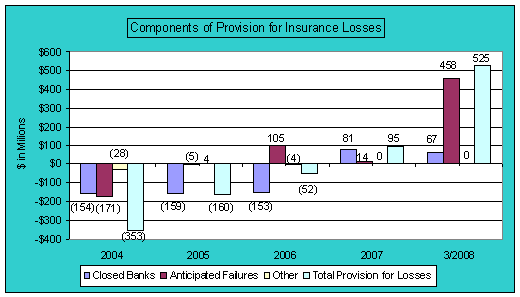
| Anticipated failures as of March 31, 2008 reached its highest mark
in five years. Total losses from anticipated failures by the end of
2008 and 2009 are expected to be higher than the average over the past
ten years. |
| Components
of Provision for Insurance Losses |
Year |
Closed Banks |
Anticipated Failures |
Other |
Total Provision for Losses |
| 2004 |
(154) |
(171) |
(28) |
(353) |
| 2005 |
(159) |
(5) |
4 |
(160) |
| 2006 |
(153) |
105 |
(4) |
(52) |
| 2007 |
81
|
14 |
0 |
95 |
| 2008 |
67 |
458 |
0 |
525 |

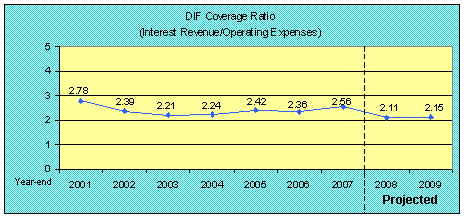
| The
coverage ratio in 2008 and 2009 is projected to decline due
to a modest decrease in interest revenue and a nominal increase
in operating expenses. The projected decline in interest revenue
is attributable to lower Treasury market yields. |
| Year |
Interest
on Obligations |
Operating
Expense |
Coverage
Ratio |
| 2001 |
$2,469 |
$888 |
2.78 |
| 2002 |
$2,256 |
$945 |
2.39 |
| 2003 |
$2,062 |
$934 |
2.21 |
| 2004 |
$2,108 |
$942 |
2.24 |
| 2005 |
$2,341 |
$965 |
2.42 |
| 2006 |
$2,241 |
$951 |
2.36 |
| 2007 |
$2,540
|
$993 |
2.56 |
| 2008 |
$2,174 |
$1,031 |
2.11 |
| 2009 |
$2,291 |
$1,064 |
2.15 |
|