
|
 |
DIF
Balance Sheet -
First Quarter 2008
| Fund Financial Results |
($
in millions) |
Balance
Sheet |
|
(unaudited)
Mar-08 |
(audited)
Dec-07 |
Change |
(unaudited) Mar-07 |
Year-Over-Year Change |
| Cash & cash equivalents |
$8,080 |
$4,245 |
$3,835 |
$3,712 |
$4,368 |
| Investment in U.S. Treasury obligations, net |
43,626 |
46,588 |
(2,962) |
45,942 |
(2,316) |
| Assessments receivable, net |
442 |
244 |
198 |
94 |
348 |
| Interest receivable on investments and other assets, net |
623 |
768 |
(145) |
682 |
(59) |
| Receivables from resolutions, net |
751 |
808 |
(57) |
431 |
320 |
| Property, buildings and other capitalized assets, net |
347 |
352 |
(5) |
368 |
(21) |
| Total Assets |
$53,869 |
$53,005 |
$864 |
$51,229 |
$2,640 |
| Accounts payable and other liabilities |
127 |
152 |
(25) |
119 |
8 |
| Postretirement benefit liability |
116 |
116 |
0 |
130 |
(14) |
| Contingent Liabilities: future failures |
583 |
124 |
459 |
35 |
548 |
| Contingent Liabilities: litigation losses & other |
200 |
200 |
0 |
200 |
0 |
| Total Liabilities |
$1,026 |
$592 |
$434 |
$484 |
$542 |
| FYI: Unrealized gain on available-for-sale securities, net |
486 |
359 |
127 |
315 |
171 |
| FYI: Unrealized postretirement benefit gain |
19 |
19 |
0 |
2 |
17 |
| FUND BALANCE |
$52,843 |
$52,413 |
$430 |
$50,745 |
$2,098 |

| Unrealized
Gains/Losses on AFS Securities |
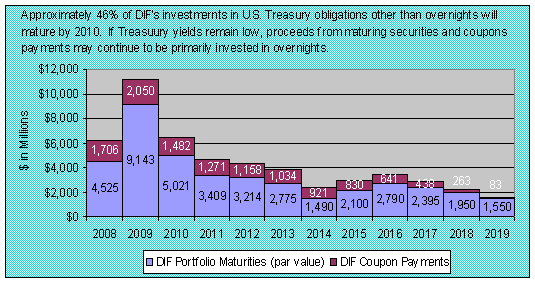
| Year |
DIF
Coupon Payments |
DIF
Portfolio Maturities |
2008
|
1,706 |
4,525 |
2009
|
2,050 |
9,143 |
2010
|
1,482 |
5,021 |
2011 |
1,271 |
3,409 |
2012 |
1,158 |
3,214 |
2013 |
1,034 |
2,775 |
2014 |
921 |
1,490 |
2015 |
830 |
2,100 |
2016 |
641 |
2,790 |
2017 |
438 |
2,395 |
2018 |
263 |
1,950 |
2019 |
83 |
1,550 |
|
|