
|
 |
DIF
Balance Sheet -
Third Quarter 2010
| Fund Financial Results |
($
in millions) |
Balance
Sheet |
|
Unaudited
Sep-10
|
Unaudited
Jun-09
|
Quarterly
Change
|
Unaudited
Sep-09
|
Year-Over-Year
Change
|
| Cash & cash equivalents - unrestricted |
$22,701 |
$18,824 |
$3,877 |
$8,546 |
$14,155 |
| Cash & investments - restricted - systemic risk |
6,158 |
5,786 |
372 |
7,141 |
(983) |
| Investment in U.S. Treasury obligations, net |
14,727 |
19,264 |
(4,537) |
7,590 |
7,137 |
| Trust preferred securities |
2,315 |
2,130 |
185 |
- |
2,315 |
| Assessments receivable, net |
248 |
313 |
(65) |
3,353 |
(3,105) |
| Receivables and other assets, net - systemic risk |
3,007 |
3,486 |
(479) |
5,110 |
(2,103) |
| Interest receivable on investments and other assets, net |
163 |
165 |
(2) |
159 |
4 |
| Receivables from resolutions, net |
49,684 |
50,451 |
(767) |
30,321 |
19,363 |
| Property, buildings and other capitalized assets, net |
387 |
391 |
(4) |
376 |
11 |
| Total Assets |
$99,390 |
$100,810 |
($1,420) |
$62,596 |
$36,794 |
| Accounts payable and other liabilities |
370 |
328 |
42 |
199 |
171 |
| Unearned revenue - prepaid assessments |
33,370 |
36,785 |
(3,415) |
- |
33,370 |
| Liabilities due to resolutions |
42,796 |
41,862 |
934 |
20,106 |
22,690 |
| Deferred revenue - systemic risk |
8,729 |
8,321 |
408 |
10,316 |
(1,587) |
| Postretirement benefit liability |
145 |
145 |
- |
114 |
31 |
| Contingent Liabilities: future failures |
21,267 |
27,534 |
(6,267) |
38,933 |
(17,666) |
| Contingent Liabillties: systemic risk |
422 |
782 |
(360) |
871 |
(449) |
| Contingent Liabilities: litigation losses & other |
300 |
300 |
- |
300 |
0 |
| Total Liabilities |
$107,399 |
$116,057 |
($8,658) |
$70,839 |
$36,560 |
| FYI: Unrealized gain/(loss) on U.S. Treasury investments, net |
40 |
62 |
(22) |
192 |
(152) |
| FYI: Unrealized gain/(loss) on trust preferred securities |
353 |
168 |
185 |
- |
353 |
| FYI: Unrealized postretirement benefit (loss)/gain |
(3) |
(3) |
- |
25 |
(28) |
| FUND BALANCE |
($8,009) |
($15,247) |
$7,238 |
($8,243) |
$234 |

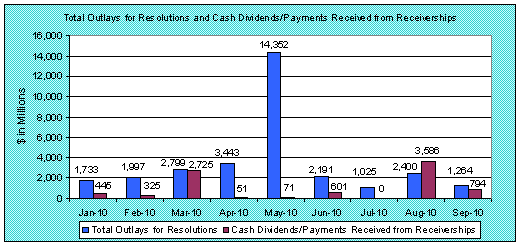
| Total Outlays for Resolutions and Cash Dividends/Payments Received from Receiverships ($ in millions) |
Month |
Total Outlays for Resolutions |
Cash Dividends/Payments Received from Receiverships |
Jan 2010 |
1,733 |
445 |
Feb
2010
|
1,997 |
325 |
Mar 2010
|
2,799 |
2,725 |
Apr
2010
|
3,443 |
51 |
May 2010
|
14,352 |
71 |
Jun 2010 |
2,191 |
601 |
Jul 2010
|
1,025 |
0 |
Aug 2010
|
2,400 |
3,586 |
Sep
2010 |
1,264 |
794 |
|
|