VI. Appendices
A. Key Statistics
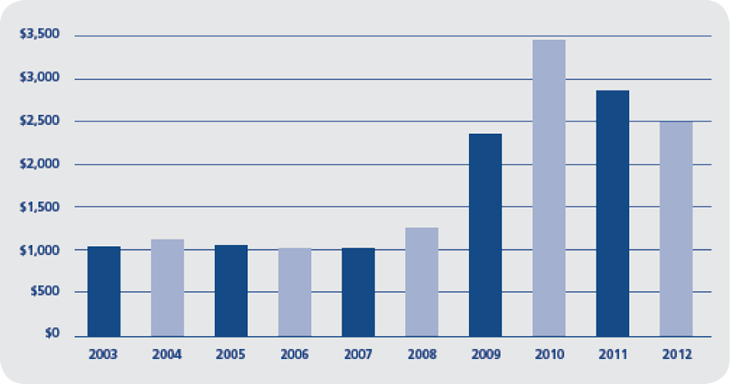
FDIC Expenditures 2003–2012
Dollars in Millions
The FDIC's Strategic Plan and Annual Performance Plan provide the basis for annual planning and budgeting for needed resources. The 2012 aggregate budget (for corporate, receivership, and investment spending) was $3.3 billion, while actual expenditures for the year were $2.5 billion, about $0.3 billion less than 2011 expenditures.
Over the past decade, the FDIC’s expenditures have varied in response to workload. During the last several years, expenditures have risen, largely due to increasing resolution and receivership activity. To a lesser extent, increased expenses have resulted from supervision-related costs associated with the oversight of more troubled institutions.
FDIC Actions on Financial Institutions Applications 2010–2012 |
|
2012 |
2011 |
2010 |
Deposit Insurance |
6 |
10 |
16 |
Approved1 |
6 |
10 |
16 |
Denied |
0 |
0 |
0 |
New Branches |
570 |
442 |
461 |
Approved |
570 |
442 |
459 |
Denied |
0 |
0 |
2 |
Mergers |
238 |
206 |
182 |
Approved |
238 |
206 |
182 |
Denied |
0 |
0 |
0 |
Requests for Consent to Serve2 |
674 |
876 |
839 |
Approved |
674 |
875 |
839 |
Section 19 |
10 |
24 |
10 |
Section 32 |
661 |
851 |
829 |
Denied |
3 |
1 |
0 |
Section 19 |
1 |
0 |
0 |
Section 32 |
2 |
1 |
0 |
Notices of Change in Control |
26 |
21 |
33 |
Letters of Intent Not to Disapprove |
26 |
21 |
33 |
Disapproved |
0 |
0 |
0 |
Brokered Deposit Waivers |
97 |
84 |
66 |
Approved |
95 |
83 |
65 |
Denied |
2 |
1 |
1 |
Savings Association Activities3 |
21 |
30 |
31 |
Approved |
21 |
30 |
31 |
Denied |
0 |
0 |
0 |
State Bank Activities/Investments4 |
7 |
9 |
3 |
Approved |
7 |
9 |
3 |
Denied |
0 |
0 |
0 |
Conversion of Mutual Institutions |
8 |
6 |
2 |
Non-Objection |
8 |
6 |
2 |
Objection |
0 |
0 |
0 |
1Includes deposit insurance application filed on behalf of (1) newly organized institutions, (2) existing uninsured financial services companies seeking establishment as an insured institution, and (3) interim institutions established to facilitate merger or conversion transactions, and applications to facilitate the establishment of thrift holding companies.
2Under Section 19 of the Federal Deposit Insurance (FDI) Act, an insured institution must receive FDIC approval before employing a person convicted of dishonesty or breach of trust. Under Section 32, the FDIC must approve any change of directors or senior executive officers at a state nonmember bank that is not in compliance with capital requirements or is otherwise in troubled condition.
3Amendments to Part 303 of the FDIC Rules and Regulations changed FDIC oversight responsibility in October 1998. In 1998, Part 303 changed the Delegations of Authority to act upon applications.
4Section 24 of the FDI Act, in general, precludes a federally insured state bank from engaging in an activity not permissible for a national bank and requires notices to be filed with the FDIC.
Compliance, Enforcement, and Other Related Legal Actions 2010–2012 |
|
2012 |
2011 |
2010 |
Total Number of Actions Initiated by the FDIC |
557 |
550 |
758 |
Termination of Insurance |
|
|
|
Involuntary Termination |
|
|
|
Sec. 8a For Violations, Unsafe/Unsound Practices or Conditions |
0 |
0 |
0 |
Voluntary Termination |
|
|
|
Sec. 8a By Order Upon Request |
0 |
0 |
0 |
Sec. 8p No Deposits |
3 |
7 |
4 |
Sec. 8q Deposits Assumed |
4 |
2 |
1 |
Sec. 8b Cease-and-Desist Actions |
|
|
|
Notices of Charges Issued1 |
0 |
7 |
3 |
Orders to Pay Restitution |
9 |
N/A |
N/A |
Consent Orders |
120 |
183 |
372 |
Sec. 8e Removal/Prohibition of Director or Officer |
|
|
|
Notices of Intention to Remove/Prohibit |
8 |
11 |
10 |
Consent Orders |
108 |
100 |
111 |
Sec. 8g Suspension/Removal When Charged With Crime |
0 |
1 |
0 |
Civil Money Penalties Issued |
|
|
|
Sec. 7a Call Report Penalties |
1 |
0 |
0 |
Sec. 8i Civil Money Penalties |
164 |
193 |
212 |
Sec. 8i Civil Money Penalty Notices of Assessment |
5 |
5 |
8 |
Sec. 10c Orders of Investigation |
16 |
29 |
15 |
Sec. 19 Waiver Orders |
|
|
|
Approved Section 19 Waiver Orders |
119 |
10 |
24 |
Denied Section 19 Waiver Orders |
0 |
1 |
0 |
Sec. 32 Notices Disapproving Officer/Director’s Request for Review |
0 |
0 |
0 |
Truth-in-Lending Act Reimbursement Actions |
|
|
|
Denials of Requests for Relief |
0 |
0 |
0 |
Grants of Relief |
0 |
0 |
0 |
Banks Making Reimbursement1 |
126 |
84 |
64 |
Suspicious Activity Reports (Open and closed institutions)1 |
139,102 |
125,460 |
126,098 |
Other Actions Not Listed |
0 |
8 |
1 |
1These actions do not constitute the initiation of a formal enforcement action and, therefore, are not included in the total number of actions initiated.
Estimated Insured Deposits and the Deposit Insurance Fund, December 31, 1934, through
September 30, 20121
Dollars in Millions (except Insurance Coverage) |
|
Deposits in Insured Institutions2 |
|
Insurance Fund as a Percentage of |
Year |
Insurance Coverage2 |
Total Domestic Deposits |
Est. Insured Deposits |
Percentage of Insured Deposits |
Deposit Insurance Fund |
Total Domestic Deposits |
Est. Insured Deposits |
2012 |
$250,000 |
$9,084,802 |
$7,250,693 |
79.8 |
$25,223.9 |
0.28 |
0.35 |
2011 |
250,000 |
8,782,165 |
6,981,569 |
79.5 |
11,826.5 |
0.13 |
0.17 |
2010 |
250,000 |
7,887,733 |
6,307,607 |
80.0 |
(7,352.2) |
(0.09) |
(0.12) |
2009 |
250,000 |
7,705,353 |
5,407,773 |
70.2 |
(20,861.8) |
(0.27) |
(0.39) |
2008 |
100,000 |
7,505,409 |
4,750,783 |
63.3 |
17,276.3 |
0.23 |
0.36 |
2007 |
100,000 |
6,921,678 |
4,292,211 |
62.0 |
52,413.0 |
0.76 |
1.22 |
2006 |
100,000 |
6,640,097 |
4,153,808 |
62.6 |
50,165.3 |
0.76 |
1.21 |
2005 |
100,000 |
6,229,823 |
3,891,000 |
62.5 |
48,596.6 |
0.78 |
1.25 |
2004 |
100,000 |
5,724,775 |
3,622,213 |
63.3 |
47,506.8 |
0.83 |
1.31 |
2003 |
100,000 |
5,224,030 |
3,452,606 |
66.1 |
46,022.3 |
0.88 |
1.33 |
2002 |
100,000 |
4,916,200 |
3,383,720 |
68.8 |
43,797.0 |
0.89 |
1.29 |
2001 |
100,000 |
4,565,068 |
3,216,585 |
70.5 |
41,373.8 |
0.91 |
1.29 |
2000 |
100,000 |
4,211,895 |
3,055,108 |
72.5 |
41,733.8 |
0.99 |
1.37 |
1999 |
100,000 |
3,885,826 |
2,869,208 |
73.8 |
39,694.9 |
1.02 |
1.38 |
1998 |
100,000 |
3,817,150 |
2,850,452 |
74.7 |
39,452.1 |
1.03 |
1.38 |
1997 |
100,000 |
3,602,189 |
2,746,477 |
76.2 |
37,660.8 |
1.05 |
1.37 |
1996 |
100,000 |
3,454,556 |
2,690,439 |
77.9 |
35,742.8 |
1.03 |
1.33 |
1995 |
100,000 |
3,318,595 |
2,663,873 |
80.3 |
28,811.5 |
0.87 |
1.08 |
1994 |
100,000 |
3,184,410 |
2,588,619 |
81.3 |
23,784.5 |
0.75 |
0.92 |
1993 |
100,000 |
3,220,302 |
2,602,781 |
80.8 |
14,277.3 |
0.44 |
0.55 |
1992 |
100,000 |
3,275,530 |
2,677,709 |
81.7 |
178.4 |
0.01 |
0.01 |
1991 |
100,000 |
3,331,312 |
2,733,387 |
82.1 |
(6,934.0) |
(0.21) |
(0.25) |
1990 |
100,000 |
3,415,464 |
2,784,838 |
81.5 |
4,062.7 |
0.12 |
0.15 |
1989 |
100,000 |
3,412,503 |
2,755,471 |
80.7 |
13,209.5 |
0.39 |
0.48 |
1988 |
100,000 |
2,337,080 |
1,756,771 |
75.2 |
14,061.1 |
0.60 |
0.80 |
1987 |
100,000 |
2,198,648 |
1,657,291 |
75.4 |
18,301.8 |
0.83 |
1.10 |
1986 |
100,000 |
2,162,687 |
1,636,915 |
75.7 |
18,253.3 |
0.84 |
1.12 |
1985 |
100,000 |
1,975,030 |
1,510,496 |
76.5 |
17,956.9 |
0.91 |
1.19 |
1984 |
100,000 |
1,805,334 |
1,393,421 |
77.2 |
16,529.4 |
0.92 |
1.19 |
1983 |
100,000 |
1,690,576 |
1,268,332 |
75.0 |
15,429.1 |
0.91 |
1.22 |
1982 |
100,000 |
1,544,697 |
1,134,221 |
73.4 |
13,770.9 |
0.89 |
1.21 |
1981 |
100,000 |
1,409,322 |
988,898 |
70.2 |
12,246.1 |
0.87 |
1.24 |
1980 |
100,000 |
1,324,463 |
948,717 |
71.6 |
11,019.5 |
0.83 |
1.16 |
1979 |
40,000 |
1,226,943 |
808,555 |
65.9 |
9,792.7 |
0.80 |
1.21 |
1978 |
40,000 |
1,145,835 |
760,706 |
66.4 |
8,796.0 |
0.77 |
1.16 |
1977 |
40,000 |
1,050,435 |
692,533 |
65.9 |
7,992.8 |
0.76 |
1.15 |
1976 |
40,000 |
941,923 |
628,263 |
66.7 |
7,268.8 |
0.77 |
1.16 |
1975 |
40,000 |
875,985 |
569,101 |
65.0 |
6,716.0 |
0.77 |
1.18 |
1974 |
40,000 |
833,277 |
520,309 |
62.4 |
6,124.2 |
0.73 |
1.18 |
1973 |
20,000 |
766,509 |
465,600 |
60.7 |
5,615.3 |
0.73 |
1.21 |
1972 |
20,000 |
697,480 |
419,756 |
60.2 |
5,158.7 |
0.74 |
1.23 |
1971 |
20,000 |
610,685 |
374,568 |
61.3 |
4,739.9 |
0.78 |
1.27 |
1970 |
20,000 |
545,198 |
349,581 |
64.1 |
4,379.6 |
0.80 |
1.25 |
1969 |
20,000 |
495,858 |
313,085 |
63.1 |
4,051.1 |
0.82 |
1.29 |
1968 |
15,000 |
491,513 |
296,701 |
60.4 |
3,749.2 |
0.76 |
1.26 |
1967 |
15,000 |
448,709 |
261,149 |
58.2 |
3,485.5 |
0.78 |
1.33 |
1966 |
15,000 |
401,096 |
234,150 |
58.4 |
3,252.0 |
0.81 |
1.39 |
1965 |
10,000 |
377,400 |
209,690 |
55.6 |
3,036.3 |
0.80 |
1.45 |
1964 |
10,000 |
348,981 |
191,787 |
55.0 |
2,844.7 |
0.82 |
1.48 |
1963 |
10,000 |
313,304 |
177,381 |
56.6 |
2,667.9 |
0.85 |
1.50 |
1962 |
10,000 |
297,548 |
170,210 |
57.2 |
2,502.0 |
0.84 |
1.47 |
1961 |
10,000 |
281,304 |
160,309 |
57.0 |
2,353.8 |
0.84 |
1.47 |
1960 |
10,000 |
260,495 |
149,684 |
57.5 |
2,222.2 |
0.85 |
1.48 |
1959 |
10,000 |
247,589 |
142,131 |
57.4 |
2,089.8 |
0.84 |
1.47 |
1958 |
10,000 |
242,445 |
137,698 |
56.8 |
1,965.4 |
0.81 |
1.43 |
1957 |
10,000 |
225,507 |
127,055 |
56.3 |
1,850.5 |
0.82 |
1.46 |
1956 |
10,000 |
219,393 |
121,008 |
55.2 |
1,742.1 |
0.79 |
1.44 |
1955 |
10,000 |
212,226 |
116,380 |
54.8 |
1,639.6 |
0.77 |
1.41 |
1954 |
10,000 |
203,195 |
110,973 |
54.6 |
1,542.7 |
0.76 |
1.39 |
1953 |
10,000 |
193,466 |
105,610 |
54.6 |
1,450.7 |
0.75 |
1.37 |
1952 |
10,000 |
188,142 |
101,841 |
54.1 |
1,363.5 |
0.72 |
1.34 |
1951 |
10,000 |
178,540 |
96,713 |
54.2 |
1,282.2 |
0.72 |
1.33 |
1950 |
10,000 |
167,818 |
91,359 |
54.4 |
1,243.9 |
0.74 |
1.36 |
1949 |
5,000 |
156,786 |
76,589 |
48.8 |
1,203.9 |
0.77 |
1.57 |
1948 |
5,000 |
153,454 |
75,320 |
49.1 |
1,065.9 |
0.69 |
1.42 |
1947 |
5,000 |
154,096 |
76,254 |
49.5 |
1,006.1 |
0.65 |
1.32 |
1946 |
5,000 |
148,458 |
73,759 |
49.7 |
1,058.5 |
0.71 |
1.44 |
1945 |
5,000 |
157,174 |
67,021 |
42.6 |
929.2 |
0.59 |
1.39 |
1944 |
5,000 |
134,662 |
56,398 |
41.9 |
804.3 |
0.60 |
1.43 |
1943 |
5,000 |
111,650 |
48,440 |
43.4 |
703.1 |
0.63 |
1.45 |
1942 |
5,000 |
89,869 |
32,837 |
36.5 |
616.9 |
0.69 |
1.88 |
1941 |
5,000 |
71,209 |
28,249 |
39.7 |
553.5 |
0.78 |
1.96 |
1940 |
5,000 |
65,288 |
26,638 |
40.8 |
496.0 |
0.76 |
1.86 |
1939 |
5,000 |
57,485 |
24,650 |
42.9 |
452.7 |
0.79 |
1.84 |
1938 |
5,000 |
50,791 |
23,121 |
45.5 |
420.5 |
0.83 |
1.82 |
1937 |
5,000 |
48,228 |
22,557 |
46.8 |
383.1 |
0.79 |
1.70 |
1936 |
5,000 |
50,281 |
22,330 |
44.4 |
343.4 |
0.68 |
1.54 |
1935 |
5,000 |
45,125 |
20,158 |
44.7 |
306.0 |
0.68 |
1.52 |
1934 |
5,000 |
40,060 |
18,075 |
45.1 |
291.7 |
0.73 |
1.61 |
1 For 2012, figures are as of September 30, all prior years are as of December 31. Prior to 1989, figures are for the Bank Insurance Fund (BIF) only and exclude insured branches of foreign banks. For 1989 to 2005, figures represent sum of the BIF and Savings Association Insurance Fund (SAIF) amounts; for 2006 to 2012, figures are for DIF. Amounts for 1989 - 2012 include insured branches of foreign banks. Prior to year-end 1991, insured deposits were estimated using percentages determined from June Call and Thrift Financial Reports.
2 The year-end 2008 coverage limit and estimated insured deposits do not reflect the temporary increase to $250,000 then in effect under the Emergency Economic Stabilization Act of 2008. The Dodd-Frank Wall Street Reform and Consumer Protection Act (Dodd-Frank Act) made this coverage limit permanent. The year-end 2009 coverage limit and estimated insured deposits reflect the $250,000 coverage limit. The Dodd-Frank Act also temporarily provided unlimited coverage for non-interest bearing transaction accounts for two years beginning December 31, 2010. Coverage for certain retirement accounts increased to $250,000 in 2006. Initial coverage limit was $2,500 from January 1 to June 30, 1934.
Income and Expenses, Deposit Insurance Fund, from Beginning of Operations, September 11, 1933, through December 31, 2012
Dollars in Millions |
Income |
Expenses and Losses |
Year |
Total |
Assessment
Income |
Assessment
Credits |
Investment
and Other |
Effective
Assessment
Rate1 |
Total |
Provision for Ins. Losses |
Admin. and Operating Expenses2 |
Interest & Other Ins. Expenses |
Funding Transfer from the FSLIC Resolution Fund |
Net Income/(Loss) |
Total |
$191,227.8 |
$127,776.5 |
$11,392.9 |
$74,844.2 |
|
$158,831.1 |
$126,258.4 |
$23,134.4 |
$9,438.3 |
$139.5 |
$32,536.2 |
2012 |
18,522.3 |
12,397.2 |
0.2 |
6,125.3 |
0.1013% |
(2,599.0) |
(4,222.6) |
1,777.5 |
(153.9) |
0 |
21,121.3 |
2011 |
16,342.0 |
13,499.5 |
0.9 |
2,843.4 |
0.1110% |
(2,915.4) |
(4,413.6) |
1,625.4 |
(127.2) |
0 |
19,257.4 |
2010 |
13,379.9 |
13,611.2 |
0.8 |
(230.5) |
0.1772% |
75.0 |
(847.8) |
1,592.6 |
(669.8) |
0 |
13,304.9 |
2009 |
24,706.4 |
17,865.4 |
148.0 |
6,989.0 |
0.2330% |
60,709.0 |
57,711.8 |
1,271.1 |
1,726.1 |
0 |
(36,002.6) |
2008 |
7,306.3 |
4,410.4 |
1,445.9 |
4,341.8 |
0.0418% |
44,339.5 |
41,838.8 |
1,033.5 |
1,467.2 |
0 |
(37,033.2) |
2007 |
3,196.2 |
3,730.9 |
3,088.0 |
2,553.3 |
0.0093% |
1,090.9 |
95.0 |
992.6 |
3.3 |
0 |
2,105.3 |
2006 |
2,643.5 |
31.9 |
0.0 |
2,611.6 |
0.0005% |
904.3 |
(52.1) |
950.6 |
5.8 |
0 |
1,739.2 |
2005 |
2,420.5 |
60.9 |
0.0 |
2,359.6 |
0.0010% |
809.3 |
(160.2) |
965.7 |
3.8 |
0 |
1,611.2 |
2004 |
2,240.3 |
104.2 |
0.0 |
2,136.1 |
0.0019% |
607.6 |
(353.4) |
941.3 |
19.7 |
0 |
1,632.7 |
2003 |
2,173.6 |
94.8 |
0.0 |
2,078.8 |
0.0019% |
(67.7) |
(1,010.5) |
935.5 |
7.3 |
0 |
2,241.3 |
2002 |
2,384.7 |
107.8 |
0.0 |
2,276.9 |
0.0023% |
719.6 |
(243.0) |
945.1 |
17.5 |
0 |
1,665.1 |
2001 |
2,730.1 |
83.2 |
0.0 |
2,646.9 |
0.0019% |
3,123.4 |
2,199.3 |
887.9 |
36.2 |
0 |
(393.3) |
2000 |
2,570.1 |
64.3 |
0.0 |
2,505.8 |
0.0016% |
945.2 |
28.0 |
883.9 |
33.3 |
0 |
1,624.9 |
1999 |
2,416.7 |
48.4 |
0.0 |
2,368.3 |
0.0013% |
2,047.0 |
1,199.7 |
823.4 |
23.9 |
0 |
369.7 |
1998 |
2,584.6 |
37.0 |
0.0 |
2,547.6 |
0.0010% |
817.5 |
(5.7) |
782.6 |
40.6 |
0 |
1,767.1 |
1997 |
2,165.5 |
38.6 |
0.0 |
2,126.9 |
0.0011% |
247.3 |
(505.7) |
677.2 |
75.8 |
0 |
1,918.2 |
1996 |
7,156.8 |
5,294.2 |
0.0 |
1,862.6 |
0.1622% |
353.6 |
(417.2) |
568.3 |
202.5 |
0 |
6,803.2 |
1995 |
5,229.2 |
3,877.0 |
0.0 |
1,352.2 |
0.1238% |
202.2 |
(354.2) |
510.6 |
45.8 |
0 |
5,027.0 |
1994 |
7,682.1 |
6,722.7 |
0.0 |
959.4 |
0.2192% |
(1,825.1) |
(2,459.4) |
443.2 |
191.1 |
0 |
9,507.2 |
1993 |
7,354.5 |
6,682.0 |
0.0 |
672.5 |
0.2157% |
(6,744.4) |
(7,660.4) |
418.5 |
497.5 |
0 |
14,098.9 |
1992 |
6,479.3 |
5,758.6 |
0.0 |
720.7 |
0.1815% |
(596.8) |
(2,274.7) |
614.83 |
1,063.1 |
35.4 |
7,111.5 |
1991 |
5,886.5 |
5,254.0 |
0.0 |
632.5 |
0.1613% |
16,925.3 |
15,496.2 |
326.1 |
1,103.0 |
42.4 |
(10,996.4) |
1990 |
3,855.3 |
2,872.3 |
0.0 |
983.0 |
0.0868% |
13,059.3 |
12,133.1 |
275.6 |
650.6 |
56.1 |
(9,147.9) |
1989 |
3,494.8 |
1,885.0 |
0.0 |
1,609.8 |
0.0816% |
4,352.2 |
3,811.3 |
219.9 |
321.0 |
5.6 |
(851.8) |
1988 |
3,347.7 |
1,773.0 |
0.0 |
1,574.7 |
0.0825% |
7,588.4 |
6,298.3 |
223.9 |
1,066.2 |
0 |
(4,240.7) |
1987 |
3,319.4 |
1,696.0 |
0.0 |
1,623.4 |
0.0833% |
3,270.9 |
2,996.9 |
204.9 |
69.1 |
0 |
48.5 |
1986 |
3,260.1 |
1,516.9 |
0.0 |
1,743.2 |
0.0787% |
2,963.7 |
2,827.7 |
180.3 |
(44.3) |
0 |
296.4 |
1985 |
3,385.5 |
1,433.5 |
0.0 |
1,952.0 |
0.0815% |
1,957.9 |
1,569.0 |
179.2 |
209.7 |
0 |
1,427.6 |
1984 |
3,099.5 |
1,321.5 |
0.0 |
1,778.0 |
0.0800% |
1,999.2 |
1,633.4 |
151.2 |
214.6 |
0 |
1,100.3 |
1983 |
2,628.1 |
1,214.9 |
164.0 |
1,577.2 |
0.0714% |
969.9 |
675.1 |
135.7 |
159.1 |
0 |
1,658.2 |
1982 |
2,524.6 |
1,108.9 |
96.2 |
1,511.9 |
0.0769% |
999.8 |
126.4 |
129.9 |
743.5 |
0 |
1,524.8 |
1981 |
2,074.7 |
1,039.0 |
117.1 |
1,152.8 |
0.0714% |
848.1 |
320.4 |
127.2 |
400.5 |
0 |
1,226.6 |
1980 |
1,310.4 |
951.9 |
521.1 |
879.6 |
0.0370% |
83.6 |
(38.1) |
118.2 |
3.5 |
0 |
1,226.8 |
1979 |
1,090.4 |
881.0 |
524.6 |
734.0 |
0.0333% |
93.7 |
(17.2) |
106.8 |
4.1 |
0 |
996.7 |
1978 |
952.1 |
810.1 |
443.1 |
585.1 |
0.0385% |
148.9 |
36.5 |
103.3 |
9.1 |
0 |
803.2 |
1977 |
837.8 |
731.3 |
411.9 |
518.4 |
0.0370% |
113.6 |
20.8 |
89.3 |
3.5 |
0 |
724.2 |
1976 |
764.9 |
676.1 |
379.6 |
468.4 |
0.0370% |
212.3 |
28.0 |
180.44 |
3.9 |
0 |
552.6 |
1975 |
689.3 |
641.3 |
362.4 |
410.4 |
0.0357% |
97.5 |
27.6 |
67.7 |
2.2 |
0 |
591.8 |
1974 |
668.1 |
587.4 |
285.4 |
366.1 |
0.0435% |
159.2 |
97.9 |
59.2 |
2.1 |
0 |
508.9 |
1973 |
561.0 |
529.4 |
283.4 |
315.0 |
0.0385% |
108.2 |
52.5 |
54.4 |
1.3 |
0 |
452.8 |
1972 |
467.0 |
468.8 |
280.3 |
278.5 |
0.0333% |
65.7 |
10.1 |
49.6 |
6.05 |
0 |
401.3 |
1971 |
415.3 |
417.2 |
241.4 |
239.5 |
0.0345% |
60.3 |
13.4 |
46.9 |
0.0 |
0 |
355.0 |
1970 |
382.7 |
369.3 |
210.0 |
223.4 |
0.0357% |
46.0 |
3.8 |
42.2 |
0.0 |
0 |
336.7 |
1969 |
335.8 |
364.2 |
220.2 |
191.8 |
0.0333% |
34.5 |
1.0 |
33.5 |
0.0 |
0 |
301.3 |
1968 |
295.0 |
334.5 |
202.1 |
162.6 |
0.0333% |
29.1 |
0.1 |
29.0 |
0.0 |
0 |
265.9 |
1967 |
263.0 |
303.1 |
182.4 |
142.3 |
0.0333% |
27.3 |
2.9 |
24.4 |
0.0 |
0 |
235.7 |
1966 |
241.0 |
284.3 |
172.6 |
129.3 |
0.0323% |
19.9 |
0.1 |
19.8 |
0.0 |
0 |
221.1 |
1965 |
214.6 |
260.5 |
158.3 |
112.4 |
0.0323% |
22.9 |
5.2 |
17.7 |
0.0 |
0 |
191.7 |
1964 |
197.1 |
238.2 |
145.2 |
104.1 |
0.0323% |
18.4 |
2.9 |
15.5 |
0.0 |
0 |
178.7 |
1963 |
181.9 |
220.6 |
136.4 |
97.7 |
0.0313% |
15.1 |
0.7 |
14.4 |
0.0 |
0 |
166.8 |
1962 |
161.1 |
203.4 |
126.9 |
84.6 |
0.0313% |
13.8 |
0.1 |
13.7 |
0.0 |
0 |
147.3 |
1961 |
147.3 |
188.9 |
115.5 |
73.9 |
0.0323% |
14.8 |
1.6 |
13.2 |
0.0 |
0 |
132.5 |
1960 |
144.6 |
180.4 |
100.8 |
65.0 |
0.0370% |
12.5 |
0.1 |
12.4 |
0.0 |
0 |
132.1 |
1959 |
136.5 |
178.2 |
99.6 |
57.9 |
0.0370% |
12.1 |
0.2 |
11.9 |
0.0 |
0 |
124.4 |
1958 |
126.8 |
166.8 |
93.0 |
53.0 |
0.0370% |
11.6 |
0.0 |
11.6 |
0.0 |
0 |
115.2 |
1957 |
117.3 |
159.3 |
90.2 |
48.2 |
0.0357% |
9.7 |
0.1 |
9.6 |
0.0 |
0 |
107.6 |
1956 |
111.9 |
155.5 |
87.3 |
43.7 |
0.0370% |
9.4 |
0.3 |
9.1 |
0.0 |
0 |
102.5 |
1955 |
105.8 |
151.5 |
85.4 |
39.7 |
0.0370% |
9.0 |
0.3 |
8.7 |
0.0 |
0 |
96.8 |
1954 |
99.7 |
144.2 |
81.8 |
37.3 |
0.0357% |
7.8 |
0.1 |
7.7 |
0.0 |
0 |
91.9 |
1953 |
94.2 |
138.7 |
78.5 |
34.0 |
0.0357% |
7.3 |
0.1 |
7.2 |
0.0 |
0 |
86.9 |
1952 |
88.6 |
131.0 |
73.7 |
31.3 |
0.0370% |
7.8 |
0.8 |
7.0 |
0.0 |
0 |
80.8 |
1951 |
83.5 |
124.3 |
70.0 |
29.2 |
0.0370% |
6.6 |
0.0 |
6.6 |
0.0 |
0 |
76.9 |
1950 |
84.8 |
122.9 |
68.7 |
30.6 |
0.0370% |
7.8 |
1.4 |
6.4 |
0.0 |
0 |
77.0 |
1949 |
151.1 |
122.7 |
0.0 |
28.4 |
0.0833% |
6.4 |
0.3 |
6.1 |
0.0 |
0 |
144.7 |
1948 |
145.6 |
119.3 |
0.0 |
26.3 |
0.0833% |
7.0 |
0.7 |
6.36 |
0.0 |
0 |
138.6 |
1947 |
157.5 |
114.4 |
0.0 |
43.1 |
0.0833% |
9.9 |
0.1 |
9.8 |
0.0 |
0 |
147.6 |
1946 |
130.7 |
107.0 |
0.0 |
23.7 |
0.0833% |
10.0 |
0.1 |
9.9 |
0.0 |
0 |
120.7 |
1945 |
121.0 |
93.7 |
0.0 |
27.3 |
0.0833% |
9.4 |
0.1 |
9.3 |
0.0 |
0 |
111.6 |
1944 |
99.3 |
80.9 |
0.0 |
18.4 |
0.0833% |
9.3 |
0.1 |
9.2 |
0.0 |
0 |
90.0 |
1943 |
86.6 |
70.0 |
0.0 |
16.6 |
0.0833% |
9.8 |
0.2 |
9.6 |
0.0 |
0 |
76.8 |
1942 |
69.1 |
56.5 |
0.0 |
12.6 |
0.0833% |
10.1 |
0.5 |
9.6 |
0.0 |
0 |
59.0 |
1941 |
62.0 |
51.4 |
0.0 |
10.6 |
0.0833% |
10.1 |
0.6 |
9.5 |
0.0 |
0 |
51.9 |
1940 |
55.9 |
46.2 |
0.0 |
9.7 |
0.0833% |
12.9 |
3.5 |
9.4 |
0.0 |
0 |
43.0 |
1939 |
51.2 |
40.7 |
0.0 |
10.5 |
0.0833% |
16.4 |
7.2 |
9.2 |
0.0 |
0 |
34.8 |
1938 |
47.7 |
38.3 |
0.0 |
9.4 |
0.0833% |
11.3 |
2.5 |
8.8 |
0.0 |
0 |
36.4 |
1937 |
48.2 |
38.8 |
0.0 |
9.4 |
0.0833% |
12.2 |
3.7 |
8.5 |
0.0 |
0 |
36.0 |
1936 |
43.8 |
35.6 |
0.0 |
8.2 |
0.0833% |
10.9 |
2.6 |
8.3 |
0.0 |
0 |
32.9 |
1935 |
20.8 |
11.5 |
0.0 |
9.3 |
0.0833% |
11.3 |
2.8 |
8.5 |
0.0 |
0 |
9.5 |
1933-34 |
7.0 |
0.0 |
0.0 |
7.0 |
N/A |
10.0 |
0.2 |
9.8 |
0.0 |
0 |
(3.0) |
1Figures represent only BIF-insured institutions prior to 1990, BIF- and SAIF-insured institutions from 1990 through 2005, and DIF-insured institutions beginning in 2006. After 1995, all thrift closings became the responsibility of the FDIC and amounts are reflected in the SAIF. The effective assessment rate is calculated from annual assessment income (net of assessment credits), excluding transfers to the Financing Corporation (FICO), Resolution Funding Corporation (REFCORP) and FSLIC Resolution Fund, divided by the four quarter average assessment base. The effective rates from 1950 through 1984 varied from the statutory rate of 0.0833 percent due to assessment credits provided in those years. The statutory rate increased to 0.12 percent in 1990 and to a minimum of 0.15 percent in 1991. The effective rates in 1991 and 1992 varied because the FDIC exercised new authority to increase assessments above the statutory minimum rate when needed. Beginning in 1993, the effective rate was based on a risk-related premium system under which institutions paid assessments in the range of 0.23 percent to 0.31 percent. In May 1995, the BIF reached the mandatory recapitalization level of 1.25 percent. As a result, BIF assessment rates were reduced to a range of 0.04 percent to 0.31 percent of assessable deposits, effective June 1995, and assessments totaling $1.5 billion were refunded in September 1995. Assessment rates for the BIF were lowered again to a range of 0 to 0.27 percent of assessable deposits, effective the start of 1996. In 1996, the SAIF collected a one-time special assessment of $4.5 billion. Subsequently, assessment rates for the SAIF were lowered to the same range as the BIF, effective October 1996. This range of rates remained unchanged for both funds through 2006. As part of the implementation of the Federal Deposit Insurance Reform Act of 2005, assessment rates were increased to a range of 0.05 percent to 0.43 percent of assessable deposits effective at the start of 2007, but many institutions received a one-time assessment credit ($4.7 billion in total) to offset the new assessments. For the first quarter of 2009, assessment rates were increased to a range of 0.12 to 0.50 percent of assessable deposits. From the second quarter of 2009 through the first quarter of 2011, initial assessment rates ranged between 0.12 and 0.45 percent of assessable deposits. Initial rates are subject to further adjustments. Beginning in the second quarter of 2011, the assessment base changed to average total consolidated assets less average tangible equity (with certain adjustments for banker’s banks and custodial banks), as required by the Dodd-Frank Act. The FDIC implemented a new assessment rate schedule at the same time to conform to the larger assessment base. Initial assessment rates were lowered to a range of 0.05 to 0.35 percent of the new base. The annualized assessment rates averaged approximately 17.6 cents per $100 of assessable deposits for the first quarter of 2011 and 11.1 cents per $100 of the new base for the last three quarters of 2011 (which is the figure shown in the table). The effective assessment rate for 2012 was based on full year accrued assessment income, actual assessment base figures for the first three quarters of 2012, and an estimate for the assessment base for fourth quarter 2012. On June 30, 2009, a special assessment was imposed on all insured banks and thrifts, which amounted in aggregate to approximately $5.4 billion. For 8,106 institutions, with $9.3 trillion in assets, the special assessment was 5 basis points of each institution’s assets minus tier one capital; 89 other institutions, with assets of $4.0 trillion, had their special assessment capped at 10 basis points of their second quarter assessment base.
2These expenses, which are presented as operating expenses in the Statement of Income and Fund Balance, pertain to the FDIC in its corporate capacity only and do not include costs that are charged to the failed bank receiverships that are managed by the FDIC. The receivership expenses are presented as part of the “Receivables from Resolutions, net” line on the Balance Sheet. The narrative and graph presented in the “Corporate Planning and Budget” section of this report show the aggregate (corporate and receivership) expenditures of the FDIC.
3Includes $210 million for the cumulative effect of an accounting change for certain postretirement benefits (1992).
4Includes a $106 million net loss on government securities (1976).
5This amount represents interest and other insurance expenses from 1933 to 1972.
6Includes the aggregate amount of $81 million of interest paid on capital stock between 1933 and 1948.
Number, Assets, Deposits, Losses, and Loss to Funds of Insured Thrifts Taken Over or Closed Because of Financial Difficulties, 1989 through 19951
Dollars in Thousands |
Year |
Total |
Assets |
Deposits |
Estimated Receivership Loss2 |
Loss to Funds3 |
Total |
748 |
$393,986,574 |
$317,501,978 |
$75,977,702 |
$81,577,294 |
1995 |
2 |
423,819 |
414,692 |
28,192 |
27,750 |
1994 |
2 |
136,815 |
127,508 |
11,472 |
14,599 |
1993 |
10 |
6,147,962 |
4,881,461 |
267,595 |
65,212 |
1992 |
59 |
44,196,946 |
34,773,224 |
3,286,957 |
3,832,195 |
1991 |
144 |
78,898,904 |
65,173,122 |
9,235,906 |
9,734,202 |
1990 |
213 |
129,662,498 |
98,963,962 |
16,062,552 |
19,257,446 |
19894 |
318 |
134,519,630 |
113,168,009 |
47,085,028 |
48,645,890 |
1Beginning in 1989 through July 1, 1995, all thrift closings were the responsibility of the Resolution Trust Corporation (RTC). Since the RTC was terminated on December 31, 1995, and all assets and liabilities transferred to the FSLIC Resolution Fund (FRF), all the results of the thrift closing activity from 1989 through 1995 are now reflected on FRF’s books. Year is the year of failure, not the year of resolution.
2The estimated losses represent the projected loss at the fund level from receiverships for unreimbursed subrogated claims of the FRF and unpaid advances to receiverships from the FRF.
3The Loss to Funds represents the total resolution cost of the failed thrifts in the FRF-RTC fund, which includes corporate revenue and expense items such as interest expense on Federal Financing Bank debt, interest expense on escrowed funds, and interest revenue on advances to receiverships, in addition to the estimated losses for receiverships.
4Total for 1989 excludes nine failures of the former FSLIC.
FDIC-Insured Institutions Closed During 2012
Dollars in Thousands |
Codes for Bank Class: |
NM = State-chartered bank that is not a member of the Federal Reserve System
N = National Bank |
SB = Savings Bank
SI = Stock and Mutual Savings Bank |
SM = State-chartered bank that is a member of the Federal Reserve System
SA = Savings Association |
Name and Location |
BankClass |
Number of Deposit Accounts |
TotalAssets1 |
TotalDeposits1 |
Insured Deposit Funding and Other Disbursements |
Estimated Loss to the DIF2 |
Date of Closing or Acquisition |
Receiver/Assuming Bank and Location |
Purchase and Assumption – All Deposits |
Fort Lee Federal Savings Bank, FSB
Fort Lee, NJ |
SA |
882 |
$48,861 |
$47,786 |
$48,938 |
$18,311 |
04/20/12 |
Alma Bank
Astoria, NY |
Montgomery Bank & Trust
Ailey, GA |
NM |
7,153 |
$153,208 |
$164,181 |
$171,459 |
$75,228 |
07/06/12 |
Ameris Bank
Moultrie, GA |
Second Federal SLA of Chicago
Chicago, IL |
SA |
13,801 |
$190,891 |
$171,627 |
$195,896 |
$76,851 |
07/20/12 |
Hinsdale Bank & Trust Company
Hinsdale, IL |
Whole Bank Purchase and Assumption – All Deposits |
American Eagle Savings Bank
Boothwyn, PA |
SA |
1,467 |
$19,259 |
$17,548 |
$18,730 |
$7,027 |
01/20/12 |
Capital Bank, N.A.
Rockville, MD |
Central Florida State Bank
Belleview, FL |
NM |
2,433 |
$71,485 |
$71,080 |
$71,596 |
$30,740 |
01/20/12 |
CenterState Bank of Florida, N.A.
Winter Haven, FL |
The First State Bank
Stockbridge, GA |
NM |
32,773 |
$516,760 |
$509,065 |
$509,638 |
$219,086 |
01/20/12 |
Hamilton State Bank
Hoschton, GA |
BankEast
Knoxville, TN |
SM |
7,795 |
$261,947 |
$259,571 |
$249,604 |
$76,798 |
01/27/12 |
U.S. Bank National Association
Cincinnati, OH |
First Guaranty Bank & Trust of Jacksonville
Jacksonville, FL |
NM |
10,733 |
$397,082 |
$378,309 |
$371,225 |
$89,662 |
01/27/12 |
CenterState Bank of Florida, N.A.
Winter Haven, FL |
Patriot Bank Minnesota
Forest Lake, MN |
NM |
4,897 |
$105,029 |
$102,833 |
$100,870 |
$42,651 |
01/27/12 |
First Resource Bank
Savage, MN |
Tennessee Commerce Bank
Franklin, TN |
NM |
12,437 |
$1,009,154 |
$1,037,716 |
$1,056,017 |
$374,555 |
01/27/12 |
Republic Bank & Trust Company
Louisville, KY |
Charter National Bank & Trust
Hoffman Estates, IL |
N |
7,053 |
$93,894 |
$89,485 |
$92,749 |
$25,974 |
02/10/12 |
Barrington Bank & Trust Company, N.A.
Barrington, IL |
SCB Bank
Shelbyville, IN |
SA |
7,848 |
$182,561 |
$171,365 |
$169,673 |
$41,513 |
02/10/12 |
First Merchants Bank, N.A. Muncie, IN |
Central Bank of Georgia
Ellaville, GA |
NM |
9,991 |
$278,860 |
$266,589 |
$262,985 |
$69,584 |
02/24/12 |
Ameris Bank
Moultrie, GA |
Global Commerce Bank
Doraville, GA |
NM |
5,006 |
$143,678 |
$116,813 |
$118,373 |
$33,001 |
03/02/12 |
Metro City Bank
Doraville, GA |
Covenant Bank & Trust
Rock Spring, GA |
NM |
2,340 |
$95,725 |
$90,632 |
$87,210 |
$38,847 |
03/23/12 |
Stearns Bank, N.A.
St. Cloud, MN |
Premier Bank
Wilmette, IL |
NM |
3,097 |
$268,703 |
$198,953 |
$196,298 |
$64,177 |
03/23/12 |
International Bank of Chicago
Chicago, IL |
Fidelity Bank
Dearborn, MI |
NM |
22,179 |
$818,237 |
$747,640 |
$713,322 |
$96,013 |
03/30/12 |
The Huntington National Bank
Columbus, OH |
Harvest Bank of Maryland
Gaithersburg, MD |
NM |
3,174 |
$163,019 |
$145,534 |
$141,811 |
$28,010 |
04/27/12 |
Sonabank
McLean, VA |
Inter Savings Bank, FSB D/B/A InterBank, FSB
Maple Grove, MN |
SA |
13,528 |
$463,840 |
$458,053 |
$456,244 |
$120,949 |
04/27/12 |
Great Southern Bank
Reeds Spring, MO |
Palm Desert National Bank
Palm Desert, CA |
N |
2,905 |
$129,253 |
$129,023 |
$123,485 |
$30,892 |
04/27/12 |
Pacific Premier Bank
Costa Mesa, CA |
Plantation Federal Bank
Pawleys Island, SC |
SA |
13,816 |
$433,512 |
$415,943 |
$420,208 |
$87,831 |
04/27/12 |
First Federal Bank
Charleston, SC |
Security Bank, National Association
North Lauderdale, FL |
N |
2,322 |
$101,026 |
$99,067 |
$99,650 |
$18,472 |
05/04/12 |
Banesco USA
Coral Gables, FL |
Alabama Trust Bank, National Association
Sylacauga, AL |
N |
2,719 |
$51,553 |
$45,149 |
$44,121 |
$14,065 |
05/18/12 |
Southern States Bank
Anniston, AL |
Carolina Federal Savings Bank
Charleston, SC |
SA |
3,458 |
$54,373 |
$53,082 |
$54,557 |
$20,566 |
06/08/12 |
Bank of North Carolina
Thomasville, NC |
Farmers’ and Traders’ State Bank
Shabbona, IL |
NM |
3,010 |
$43,077 |
$42,302 |
$39,719 |
$13,403 |
06/08/12 |
First State Bank
Mendota, IL |
First Capital Bank
Kingfisher, OK |
NM |
2,422 |
$44,448 |
$44,828 |
$47,726 |
$9,883 |
06/08/12 |
F & M Bank
Edmond, OK |
Waccamaw Bank
Whiteville, NC |
SM |
22,381 |
$533,114 |
$472,704 |
$462,747 |
$60,442 |
06/08/12 |
First Community Bank
Bluefield, VA |
Putnam State Bank
Palatka, FL |
NM |
8,035 |
$169,489 |
$160,024 |
$156,122 |
$43,255 |
06/15/12 |
Harbor Community Bank
Indiantown, FL |
Security Exchange Bank
Marietta, GA |
NM |
2,832 |
$150,962 |
$147,896 |
$148,018 |
$42,430 |
06/15/12 |
Fidelity Bank
Atlanta, GA |
The Farmers Bank of Lynchburg
Lynchburg, TN |
NM |
9,293 |
$163,859 |
$156,402 |
$153,177 |
$35,720 |
06/15/12 |
Clayton Bank and Trust
Knoxville, TN |
Glasgow Savings Bank
Glasgow, MO |
NM |
2,176 |
$22,341 |
$21,809 |
$22,627 |
$3,081 |
07/13/12 |
Regional Missouri Bank
Marceline, MO |
First Cherokee State Bank
Woodstock, GA |
NM |
9,617 |
$209,021 |
$182,114 |
$180,780 |
$40,998 |
07/20/12 |
Community & Southern Bank
Atlanta, GA |
Georgia Trust Bank
Buford, GA |
NM |
2,404 |
$116,890 |
$114,748 |
$116,810 |
$24,782 |
07/20/12 |
Community & Southern Bank
Atlanta, GA |
Heartland Bank
Leawood, KS |
NM |
1,965 |
$96,002 |
$89,723 |
$86,811 |
$7,161 |
07/20/12 |
Metcalf Bank
Lees Summit, MO |
The Royal Palm Bank of Florida
Naples, FL |
NM |
2,303 |
$78,771 |
$78,876 |
$78,836 |
$16,406 |
07/20/12 |
First National Bank of the Gulf Coast
Naples, FL |
Jasper Banking Company
Jasper, GA |
NM |
10,984 |
$206,672 |
$204,238 |
$198,872 |
$62,319 |
07/27/12 |
Stearns Bank, N.A
St. Cloud, MN |
Waukegan Savings Bank
Waukegan, IL |
SB |
5,737 |
$83,679 |
$73,001 |
$73,716 |
$22,435 |
08/03/12 |
First Midwest Bank
Itasca, IL |
First Commerical Bank
Bloomington, MN |
NM |
3,642 |
$215,867 |
$206,809 |
$198,028 |
$65,923 |
09/07/12 |
Republic Bank & Trust Company
Louisville, KY |
Truman Bank
St. Louis, MO |
SM |
9,526 |
$282,338 |
$245,716 |
$237,573 |
$36,710 |
09/14/12 |
Simmons First National Bank
Pine Bluff, AR |
First United Bank
Crete, IL |
NM |
23,002 |
$328,422 |
$316,877 |
$321,680 |
$50,686 |
09/28/12 |
Old Plank Trail Community Bank, N.A.
New Lenox, IL |
Excel Bank
Sedalia, MO |
NM |
10,023 |
$186,113 |
$173,670 |
$170,087 |
$44,297 |
10/19/12 |
Simmons First National Bank
Pine Bluff, AR |
First East Side Savings Bank
Tamarac, FL |
SA |
1,242 |
$65,686 |
$64,888 |
$66,403 |
$12,348 |
10/19/12 |
Stearns Bank, N.A.
St. Cloud, MN |
GulfSouth Private Bank
Destin, FL |
NM |
1,896 |
$139,391 |
$131,579 |
$128,540 |
$38,932 |
10/19/12 |
SmartBank
Pigeon Forge, TN |
Citizens First National Bank
Princeton, IL |
N |
59,696 |
$923,959 |
$869,440 |
$840,261 |
$47,650 |
11/02/12 |
Heartland Bank & Trust Company
Bloomington, IL |
Heritage Bank of Florida
Lutz, FL |
NM |
6,664 |
$225,477 |
$223,309 |
$220,586 |
$67,786 |
11/02/12 |
Centennial Bank
Conway, AR |
Hometown Community Bank
Braselton, GA |
NM |
3,158 |
$124,561 |
$108,931 |
$105,207 |
$39,125 |
11/16/12 |
CertusBank, N.A.
Easley, SC |
Community Bank of the Ozarks
Sunrise Beach, MO |
NM |
2,864 |
$42,816 |
$41,881 |
$40,247 |
$12,415 |
12/14/12 |
Bank of Sullivan
Sullivan, MO |
Insured Deposit Transfer/Purchase & Assumption |
Bank of the Eastern Shore
Cambridge, MD |
SM |
9,691 |
$162,460 |
$150,951 |
$166,270 |
$52,968 |
04/27/12 |
Federal Deposit Insurance Corporation |
Insured Deposit Payoff |
Home Savings of America
Little Falls, MN |
SA |
12,025 |
$434,111 |
$432,223 |
$481,476 |
$83,646 |
02/24/12 |
Federal Deposit Insurance Corporation |
New City Bank
Chicago, IL |
NM |
850 |
$71,202 |
$72,399 |
$78,269 |
$20,082 |
03/09/12 |
Federal Deposit Insurance Corporation |
Nova Bank
Berwyn, PA |
SB |
12,390 |
$444,710 |
$395,248 |
$439,261 |
$91,238 |
10/26/12 |
Federal Deposit Insurance Corporation |
1Total Assets and Total Deposits data are based upon the last Call Report filed by the institution prior to failure.
2Estimated losses are as of 12/31/12. Estimated losses are routinely adjusted with updated information from new appraisals and asset sales, which ultimately affect the asset values and projected recoveries. Represents the estimated loss to the DIF from deposit insurance obligations. This amount does not include the estimated loss allocable to the Transaction Account Guarantee and Debt Guarantee Program claims.
Recoveries and Losses by the Deposit Insurance Fund on Disbursements for the Protection of Depositors, 1934 – 2012
Dollars in Thousands |
Bank and Thrift Failures1 |
Year2 |
Number of Banks/
Thrifts |
Total Assets3 |
Total Deposits3 |
Insured Deposit Funding and Other Disbursements |
Recoveries |
Estimated Additional Recoveries |
Estimated Losses |
|
2,560 |
$925,620,900 |
$695,536,729 |
$572,325,121 |
$395,365,464 |
$54,971,765 |
$121,987,892 |
2012 |
51 |
11,617,348 |
11,009,630 |
11,034,508 |
499,565 |
7,788,019 |
2,746,924 |
2011 |
92 |
34,922,997 |
31,071,862 |
31,686,966 |
2,230,090 |
20,693,288 |
8,763,588 |
20104 |
157 |
92,084,987 |
78,290,185 |
82,210,860 |
50,082,606 |
10,796,927 |
21,331,327 |
20094 |
140 |
169,709,160 |
137,783,121 |
135,926,307 |
86,969,627 |
12,869,470 |
36,087,210 |
20084 |
25 |
371,945,480 |
234,321,715 |
205,447,245 |
183,261,881 |
2,279,073 |
19,906,291 |
2007 |
3 |
2,614,928 |
2,424,187 |
1,917,998 |
1,369,413 |
322,914 |
225,671 |
2006 |
0 |
0 |
0 |
0 |
0 |
0 |
0 |
2005 |
0 |
0 |
0 |
0 |
0 |
0 |
0 |
2004 |
4 |
170,099 |
156,733 |
138,926 |
134,978 |
31 |
3,917 |
2003 |
3 |
947,317 |
901,978 |
883,772 |
812,933 |
8,192 |
62,647 |
2002 |
11 |
2,872,720 |
2,512,834 |
2,127,047 |
1,704,030 |
7,556 |
415,461 |
2001 |
4 |
1,821,760 |
1,661,214 |
1,605,249 |
1,128,577 |
184,367 |
292,305 |
2000 |
7 |
410,160 |
342,584 |
297,313 |
265,175 |
0 |
32,138 |
1999 |
8 |
1,592,189 |
1,320,573 |
1,307,260 |
711,758 |
5,583 |
589,919 |
1998 |
3 |
290,238 |
260,675 |
292,691 |
58,248 |
11,644 |
222,799 |
1997 |
1 |
27,923 |
27,511 |
25,546 |
20,520 |
0 |
5,026 |
1996 |
6 |
232,634 |
230,390 |
201,533 |
140,918 |
0 |
60,615 |
1995 |
6 |
802,124 |
776,387 |
609,043 |
524,571 |
0 |
84,472 |
1994 |
13 |
1,463,874 |
1,397,018 |
1,224,769 |
1,045,718 |
0 |
179,051 |
1993 |
41 |
3,828,939 |
3,509,341 |
3,841,658 |
3,209,012 |
0 |
632,646 |
1992 |
120 |
45,357,237 |
39,921,310 |
14,541,102 |
10,866,760 |
309 |
3,674,033 |
1991 |
124 |
64,556,512 |
52,972,034 |
21,499,326 |
15,500,130 |
4,392 |
5,994,804 |
1990 |
168 |
16,923,462 |
15,124,454 |
10,812,484 |
8,040,995 |
0 |
2,771,489 |
1989 |
206 |
28,930,572 |
24,152,468 |
11,443,281 |
5,247,995 |
0 |
6,195,286 |
1988 |
200 |
38,402,475 |
26,524,014 |
10,432,655 |
5,055,158 |
0 |
5,377,497 |
1987 |
184 |
6,928,889 |
6,599,180 |
4,876,994 |
3,014,502 |
0 |
1,862,492 |
1986 |
138 |
7,356,544 |
6,638,903 |
4,632,121 |
2,949,583 |
0 |
1,682,538 |
1985 |
116 |
3,090,897 |
2,889,801 |
2,154,955 |
1,506,776 |
0 |
648,179 |
1984 |
78 |
2,962,179 |
2,665,797 |
2,165,036 |
1,641,157 |
0 |
523,879 |
1983 |
44 |
3,580,132 |
2,832,184 |
3,042,392 |
1,973,037 |
0 |
1,069,355 |
1982 |
32 |
1,213,316 |
1,056,483 |
545,612 |
419,825 |
0 |
125,787 |
1981 |
7 |
108,749 |
100,154 |
114,944 |
105,956 |
0 |
8,988 |
1980 |
10 |
239,316 |
219,890 |
152,355 |
121,675 |
0 |
30,680 |
1934 - 1979 |
558 |
8,615,743 |
5,842,119 |
5,133,173 |
4,752,295 |
0 |
380,878 |
Assistance Transactions |
Year2 |
Number of Banks/
Thrifts |
Total Assets3 |
Total Deposits3 |
Insured Deposit Funding and Other Disbursements |
Recoveries |
Estimated Additional Recoveries |
Estimated Losses |
|
154 |
$3,317,099,253 |
$1,442,173,417 |
$11,630,356 |
$6,199,875 |
$0 |
$5,430,481 |
2012 |
0 |
0 |
0 |
0 |
0 |
0 |
0 |
2011 |
0 |
0 |
0 |
0 |
0 |
0 |
0 |
2010 |
0 |
0 |
0 |
0 |
0 |
0 |
0 |
20095 |
8 |
1,917,482,183 |
1,090,318,282 |
0 |
0 |
0 |
0 |
20085 |
5 |
1,306,041,994 |
280,806,966 |
0 |
0 |
0 |
0 |
2007 |
0 |
0 |
0 |
0 |
0 |
0 |
0 |
2006 |
0 |
0 |
0 |
0 |
0 |
0 |
0 |
2005 |
0 |
0 |
0 |
0 |
0 |
0 |
0 |
2004 |
0 |
0 |
0 |
0 |
0 |
0 |
0 |
2003 |
0 |
0 |
0 |
0 |
0 |
0 |
0 |
2002 |
0 |
0 |
0 |
0 |
0 |
0 |
0 |
2001 |
0 |
0 |
0 |
0 |
0 |
0 |
0 |
2000 |
0 |
0 |
0 |
0 |
0 |
0 |
0 |
1999 |
0 |
0 |
0 |
0 |
0 |
0 |
0 |
1998 |
0 |
0 |
0 |
0 |
0 |
0 |
0 |
1997 |
0 |
0 |
0 |
0 |
0 |
0 |
0 |
1996 |
0 |
0 |
0 |
0 |
0 |
0 |
0 |
1995 |
0 |
0 |
0 |
0 |
0 |
0 |
0 |
1994 |
0 |
0 |
0 |
0 |
0 |
0 |
0 |
1993 |
0 |
0 |
0 |
0 |
0 |
0 |
0 |
1992 |
2 |
33,831 |
33,117 |
1,486 |
1,236 |
0 |
250 |
1991 |
3 |
78,524 |
75,720 |
6,117 |
3,093 |
0 |
3,024 |
1990 |
1 |
14,206 |
14,628 |
4,935 |
2,597 |
0 |
2,338 |
1989 |
1 |
4,438 |
6,396 |
2,548 |
252 |
0 |
2,296 |
1988 |
80 |
15,493,939 |
11,793,702 |
1,730,351 |
189,709 |
0 |
1,540,642 |
1987 |
19 |
2,478,124 |
2,275,642 |
160,877 |
713 |
0 |
160,164 |
1986 |
7 |
712,558 |
585,248 |
158,848 |
65,669 |
0 |
93,179 |
1985 |
4 |
5,886,381 |
5,580,359 |
765,732 |
406,676 |
0 |
359,056 |
1984 |
2 |
40,470,332 |
29,088,247 |
5,531,179 |
4,414,904 |
0 |
1,116,275 |
1983 |
4 |
3,611,549 |
3,011,406 |
764,690 |
427,007 |
0 |
337,683 |
1982 |
10 |
10,509,286 |
9,118,382 |
1,729,538 |
686,754 |
0 |
1,042,784 |
1981 |
3 |
4,838,612 |
3,914,268 |
774,055 |
1,265 |
0 |
772,790 |
1980 |
1 |
7,953,042 |
5,001,755 |
0 |
0 |
0 |
0 |
1934 - 1979 |
4 |
1,490,254 |
549,299 |
0 |
0 |
0 |
0 |
1Institutions closed by the FDIC, including deposit payoff, insured deposit transfer, and deposit assumption cases.
2For 1990 through 2005, amounts represent the sum of BIF and SAIF failures (excluding those handled by the RTC); prior to 1990, figures are only for the BIF. After 1995, all thrift closings became the responsibility of the FDIC and amounts are reflected in the SAIF. For 2006 to 2012, figures are for the DIF.
3Assets and deposit data are based on the last Call Report or TFR filed before failure.
4Includes amounts related to transaction account coverage under the Transaction Account Guarantee Program (TAG). The estimated losses as of 12/31/10 for TAG accounts in 2010, 2009, and 2008 are $519 million, $1,526 million, and $15 million, respectively.
5Includes institutions where assistance was provided under a systemic risk determination. Any costs that exceed the amounts estimated under the least cost resolution requirement would be recovered through a special assessment on all FDIC-insured institutions.
|