6. APPENDICES
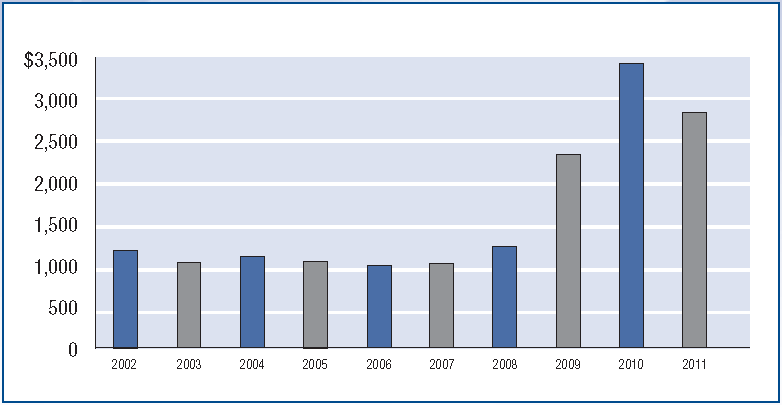
FDIC EXPENDITURES 2002 – 2011
Dollars in Millions |
 |
A. Key Statistics
The FDICs Strategic Plan and Annual Performance Plan provide the basis for annual planning and budgeting for needed resources. The 2011 aggregate budget (for corporate, receivership, and investment spending) was $3.88 billion, while actual expenditures for the year were $2.83 billion, about $590 million less than 2010 expenditures.
Over the past decade the FDIC’s expenditures have varied in response to workload. After peaking in 2010, expenditure levels subsided in 2011, largely due to decreasing resolution and receivership activity.
FDIC Actions on Financial Institutions Applications 2009 –
2011 |
|
2011 |
2010 |
2009 |
| Deposit Insurance |
10 |
16 |
19 |
| Approved 1 |
10 |
16 |
19 |
| Denied |
0 |
0 |
0 |
| New Branches |
442 |
461 |
521 |
| Approved |
442 |
459 |
521 |
| Denied |
0 |
2 |
0 |
| Mergers |
206 |
182 |
190 |
| Approved |
206 |
182 |
190 |
| Denied |
0 |
0 |
0 |
| Requests
for Consent to Serve2 |
876 |
839 |
503 |
| Approved |
875 |
839 |
503 |
| Section 19 |
24 |
10 |
20 |
| Section 32 |
851 |
829 |
483 |
| Denied |
1 |
0 |
0 |
| Section 19 |
0 |
0 |
0 |
| Section 32 |
1 |
0 |
0 |
| Notices of
Change in Control |
21 |
33 |
18 |
| Letters of Intent Not to Disapprove |
21 |
33 |
18 |
| Disapproved |
0 |
0 |
0 |
| Brokered Deposit Waivers |
84 |
66 |
35 |
| Approved |
83 |
65 |
34 |
| Denied |
1 |
1 |
1 |
| Savings Association Activities 3 |
30 |
31 |
39 |
| Approved |
30 |
31 |
39 |
| Denied |
0 |
0 |
0 |
| State Bank Activities/Investments 4 |
9 |
3 |
2 |
| Approved |
9 |
3 |
2 |
| Denied |
0 |
0 |
0 |
| Conversion of Mutual Institutions |
6 |
2 |
6 |
| Non-Objection |
6 |
2 |
6 |
| Objection |
0 |
0 |
0 |
1 Includes deposit insurance applications
filed on behalf of: (1) newly
organized institutions, (2) existing uninsured
financial services companies seeking establishment as an insured
institution, and (3) interim institutions established to
facilitate merger or conversion transactions, and applications to
facilitate the establishment of thrift holding companies.
2 Under Section 19 of the
Federal Deposit Insurance (FDI) Act, an insured institution must
receive FDIC approval
before employing a person convicted of dishonesty or breach of trust.
Under Section 32, the FDIC must approve
any change of directors or senior executive officers at a state
non-member bank that is not in compliance with capital
requirements or is otherwise in troubled condition.
3 Amendments to Part 303
of the FDIC Rules and Regulations changed FDIC oversight responsibility
in October 1998.
In 1998, Part 303 changed the Delegations of Authority to act upon
applications.
4 Section 24 of the FDI
Act, in general, precludes a federally insured state bank from engaging
in an activity not
permissible for a national bank and requires notices to be filed with
the FDIC.
Compliance, Enforcement, and Other Related Legal Actions 2009
– 2011 |
| |
2011 |
2010 |
2009 |
Total Number of Actions
Initiated by the FDIC
|
550 |
758
|
551
|
| Termination of Insurance |
|
|
|
| Involuntary Termination |
|
|
|
| Sec. 8a For Violations, Unsafe/Unsound
Practices or Conditions |
0 |
0 |
0 |
| Voluntary Termination |
|
|
|
| Sec. 8a By Order Upon Request |
0 |
0 |
0 |
| Sec. 8p No Deposits |
7 |
4 |
4 |
| Sec. 8q Deposits
Assumed |
2 |
1 |
2 |
| Sec. 8b Cease-and-Desist Actions |
|
|
|
| Notices of Charges Issued * |
7 |
1 |
3 |
| Consent Orders |
183 |
372 |
302 |
| Sec. 8e Removal/Prohibition of Director or Officer |
|
|
|
| Notices of Intention to Remove/Prohibit |
11 |
10 |
2 |
| Consent Orders |
100 |
111 |
64 |
| Sec. 8g
Suspension/Removal When Charged With Crime |
1 |
0 |
0 |
| Civil Money Penalties Issued |
|
|
|
| Sec. 7a Call Report Penalties |
0 |
0 |
1 |
| Sec. 8i Civil Money Penalties |
193 |
212 |
154 |
| Sec. 8i
Civil Money Penalty Notices of Assessment |
5 |
8 |
0 |
| Sec. 10c Orders of
Investigation |
29 |
15 |
10 |
| Sec. 19 Waiver Orders |
|
|
|
| Approved Section 19 Waiver Orders |
10 |
24 |
12 |
| Denied Section 19 Waiver Orders |
1 |
0 |
0 |
| Sec.
32 Notices Disapproving Officer/Director’s Request for Review |
0 |
0 |
0 |
| Truth-in-Lending Act Reimbursement Actions |
|
|
|
| Denials of Requests for
Relief |
0 |
0 |
0 |
| Grants of Relief |
0 |
0 |
0 |
| Banks Making
Reimbursement * |
84 |
64 |
94 |
| Suspicious Activity Reports (Open and closed
institutions) * |
125,460 |
126,098 |
128,973 |
| Other Actions Not Listed |
8 |
1 |
0 |
* These actions do not constitute the
initiation of a formal enforcement
action and, therefore, are not included in the total number of actions
initiated.
Estimated Insured Deposits and the Deposit Insurance Fund, December 31, 1934, through December 31, 2011
Dollars in Millions (except Insurance Coverage) |
|
|
Deposits
in
Insured
Institutions |
|
Insurance
Fund
as
a
Percentage
of |
| Year |
Insurance
Coverage 1 |
Total
Domestic
Deposits |
Est.
Insured
Deposits 2 |
Percentage
of
Insured
Deposits |
Deposit
Insurance
Fund |
Total
Domestic
Deposits |
Est.
Insured
Deposits |
2011
2010
2009
2008
2007
2006
2005 |
$250,000
250,000
250,000
100,000
100,000
100,000
100,000 |
$8,779,282
7,887,732
7,705,353
7,505,409
6,921,678
6,640,097
6,229,823 |
$6,979,126
6,315,302
5,407,757
4,750,783
4,292,211
4,153,808
3,891,000 |
79.5
80.1
70.2
63.3
62.0
62.6
62.5 |
$11,826.5
(7,352.2)
(20,861.8)
17,276.3
52,413.0
50,165.3
48,596.6 |
0.13
(0.09)
(0.27)
0.23
0.76
0.76
0.78 |
0.17
(0.12)
(0.39)
0.36
1.22
1.21
1.25 |
2004
2003
2002
2001
2000 |
100,000
100,000
100,000
100,000
100,000 |
5,724,775
5,224,030
4,916,200
4,565,068
4,211,895 |
3,622,213
3,452,606
3,383,720
3,216,585
3,055,108 |
63.3
66.1
68.8
70.5
72.5 |
47,506.8
46,022.3
43,797.0
41,373.8
41,733.8 |
0.83
0.88
0.89
0.91
0.99 |
1.31
1.33
1.29
1.29
1.37 |
1999
1998
1997
1996
1995 |
100,000
100,000
100,000
100,000
100,000 |
3,885,826
3,817,150
3,602,189
3,454,556
3,318,595 |
2,869,208
2,850,452
2,746,477
2,690,439
2,663,873 |
73.8
74.7
76.2
77.9
80.3 |
39,694.9
39,452.1
37,660.8
35,742.8
28,811.5 |
1.02
1.03
1.05
1.03
0.87 |
1.38
1.38
1.37
1.33
1.08 |
1994
1993
1992
1991
1990 |
100,000
100,000
100,000
100,000
100,000 |
3,184,410
3,220,302
3,275,530
3,331,312
3,415,464 |
2,588,619
2,602,781
2,677,709
2,733,387
2,784,838 |
81.3
80.8
81.7
82.1
81.5 |
23,784.5
14,277.3
178.4
(6,934.0)
4,062.7 |
0.75
0.44
0.01
(0.21)
0.12 |
0.92
0.55
0.01
(0.25)
0.15 |
1989
1988
1987
1986
1985 |
100,000
100,000
100,000
100,000
100,000 |
3,412,503
2,337,080
2,198,648
2,162,687
1,975,030 |
2,755,471
1,756,771
1,657,291
1,636,915
1,510,496 |
80.7
75.2
75.4
75.7
76.5 |
13,209.5
14,061.1
18,301.8
18,253.3
17,956.9 |
0.39
0.60
0.83
0.84
0.91 |
0.48
0.80
1.10
1.12
1.19 |
1984
1983
1982
1981
1980 |
100,000
100,000
100,000
100,000
100,000 |
1,805,334
1,690,576
1,544,697
1,409,322
1,324,463 |
1,393,421
1,268,332
1,134,221
988,898
948,717 |
77.2
75.0
73.4
70.2
71.6 |
16,529.4
15,429.1
13,770.9
12,246.1
11,019.5 |
0.92
0.91
0.89
0.87
0.83 |
1.19
1.22
1.21
1.24
1.16 |
1979
1978
1977
1976
1975 |
40,000
40,000
40,000
40,000
40,000 |
1,226,943
1,145,835
1,050,435
941,923
875,985 |
808,555
760,706
692,533
628,263
569,101 |
65.9
66.4
65.9
66.7
65.0 |
9,792.7
8,796.0
7,992.8
7,268.8
6,716.0 |
0.80
0.77
0.76
0.77
0.77 |
1.21
1.16
1.15
1.16
1.18 |
1974
1973
1972
1971
1970 |
40,000
20,000
20,000
20,000
20,000 |
833,277
766,509
697,480
610,685
545,198 |
520,309
465,600
419,756
374,568
349,581 |
62.4
60.7
60.2
61.3
64.1 |
6,124.2
5,615.3
5,158.7
4,739.9
4,379.6 |
0.73
0.73
0.74
0.78
0.80 |
1.18
1.21
1.23
1.27
1.25 |
1969
1968
1967
1966
1965 |
20,000
15,000
15,000
15,000
10,000 |
495,858
491,513
448,709
401,096
377,400 |
313,085
296,701
261,149
234,150
209,690 |
63.1
60.4
58.2
58.4
55.6 |
4,051.1
3,749.2
3,485.5
3,252.0
3,036.3 |
0.82
0.76
0.78
0.81
0.80 |
1.29
1.26
1.33
1.39
1.45 |
1964
1963
1962
1961
1960 |
10,000
10,000
10,000
10,000
10,000 |
348,981
313,304
297,548
281,304
260,495 |
191,787
177,381
170,210
160,309
149,684 |
55.0
56.6
57.2
57.0
57.5 |
2,844.7
2,667.9
2,502.0
2,353.8
2,222.2 |
0.82
0.85
0.84
0.84
0.85 |
1.48
1.50
1.47
1.47
1.48 |
1959
1958
1957
1956
1955 |
10,000
10,000
10,000
10,000
10,000 |
247,589
242,445
225,507
219,393
212,226 |
142,131
137,698
127,055
121,008
116,380 |
57.4
56.8
56.3
55.2
54.8 |
2,089.8
1,965.4
1,850.5
1,742.1
1,639.6 |
0.84
0.81
0.82
0.79
0.77 |
1.47
1.43
1.46
1.44
1.41 |
1954
1953
1952
1951
1950 |
10,000
10,000
10,000
10,000
10,000 |
203,195
193,466
188,142
178,540
167,818 |
110,973
105,610
101,841
96,713
91,359 |
54.6
54.6
54.1
54.2
54.4 |
1,542.7
1,450.7
1,363.5
1,282.2
1,243.9 |
0.76
0.75
0.72
0.72
0.74 |
1.39
1.37
1.34
1.33
1.36 |
1949
1948
1947
1946
1945 |
5,000
5,000
5,000
5,000
5,000 |
156,786
153,454
154,096
148,458
157,174 |
76,589
75,320
76,254
73,759
67,021 |
48.8
49.1
49.5
49.7
42.6 |
1,203.9
1,065.9
1,006.1
1,058.5
929.2 |
0.77
0.69
0.65
0.71
0.59 |
1.57
1.42
1.32
1.44
1.39 |
1944
1943
1942
1941
1940 |
5,000
5,000
5,000
5,000
5,000 |
134,662
111,650
89,869
71,209
65,288 |
56,398
48,440
32,837
28,249
26,638 |
41.9
43.4
36.5
39.7
40.8 |
804.3
703.1
616.9
553.5
496.0 |
0.60
0.63
0.69
0.78
0.76 |
1.43
1.45
1.88
1.96
1.86 |
1939
1938
1937
1936
1935 |
5,000
5,000
5,000
5,000
5,000 |
57,485
50,791
48,228
50,281
45,125 |
24,650
23,121
22,557
22,330
20,158 |
42.9
45.5
46.8
44.4
44.7 |
452.7
420.5
383.1
343.4
306.0 |
0.79
0.83
0.79
0.68
0.68 |
1.84
1.82
1.70
1.54
1.52 |
1934
|
5,000
|
40,060 |
18,075 |
45.1 |
291.7 |
0.73 |
1.61 |
1 The Dodd-Frank Wall Street Reform and
Consumer Protection Act
(Dodd-Frank Act) temporarily provides unlimited
coverage for non-interest bearing transaction accounts for two years
beginning December 31, 2010. Coverage limits do
not reflect temporary increases authorized by the Emergency Economic
Stabilization Act of 2008. Coverage for certain
retirement accounts increased to $250,000 in 2006. Initial coverage
limit was $2,500 from January 1 to June 30, 1934.
2 Beginning in
the
fourth
quarter
of
2010,
estimates
of
insured
deposits
include
the
Dodd-Frank
Act
temporary
unlimited
coverage
for
non-interest bearing
transaction
accounts.
Prior
to
1989,
figures
are
for
the
Bank
Insurance
Fund
(BIF) only and exclude insured branches of foreign banks. For 1989 to
2005, figures represent sum of the BIF and
Savings Association Insurance Fund (SAIF) amounts; for 2006 to 2011,
figures are for DIF. Amounts for 1989 - 2011
include insured branches of foreign banks. Prior to year-end 1991,
insured deposits were estimated using percentages
determined from June Call and Thrift Financial Reports.
Income and Expenses, Deposit Insurance Fund, from Beginning
of Operations, September 11, 1933, through December 31, 2011
Dollars in Millions |
|
Income |
Expenses
and
Losses |
| Year |
Total |
Assessment
Income |
Assessment
Credits |
Investment
and
Other |
Effective
Assessment
Rate 1 |
Total |
Provision
for
Ins.
Losses |
Administrative
and
Operating
Expenses 2 |
Interest
&
Other
Ins.
Expenses |
Funding
Transfer
from
the
FSLIC
Resolution
Fund |
Net
Income/
(Loss) |
| Total |
$172,116.7 |
$115,379.3 |
$11,392.7 |
$68,718.9 |
|
$161,430.1 |
$130,481.0 |
$21,356.9 |
$9,592.2 |
$139.5 |
$10,826.1 |
| 2011 2010
2009 2008 2007 2006
2005 |
$16,342.0 13,379.9
24,706.4
7,306.3
3,196.2
2,643.5
2,420.5 |
13,499.5 13,611.2
17,865.4
4,410.4
3,730.9
31.9
60.9 |
0.9
0.8
148.0 1,445.9 3,088.0
0.0
0.0 |
2,843.4 (230.5)
6,989.0
4,341.8
2,553.3
2,611.6
2,359.6 |
0.1110% 0.1772%
0.2330%
0.0418%
0.0093%
0.0005%
0.0010% |
(2,915.4) 75.0
60,709.0
44,339.5
1,090.9
904.3
809.3 |
(4,413.6) (847.8)
57,711.8
41,838.8
95.0
(52.1)
(160.2) |
1,625.4
1,592.6
1,271.1
1,033.5
992.6
950.6
965.7 |
(127.2) (669.8)
1,726.1
1,467.2
3.3
5.8
3.8 |
0
0
0
0
0
0
0 |
19,257.4
13,304.9
(36,002.6)
(37,033.2)
2,105.3
1,739.2
1,611.2 |
| 2004
2003 2002 2001 2000 |
2,240.3
2,173.6
1,795.9
2,730.1
2,570.1 |
104.2
94.8
107.8
83.2
64.3 |
0.0
0.0
0.0
0.0
0.0 |
2,136.1
2,078.8
2,276.9
2,646.9
2,505.8 |
0.0019%
0.0019%
0.0023%
0.0019%
0.0016% |
607.6
(67.7) 719.6
3,123.4 945.2 |
(353.4)
(1,010.5)
(243.0)
2,199.3
28.0 |
941.3
935.5
945.1
887.9
883.9 |
19.7
7.3
17.5
36.2
33.3 |
0
0
0
0
0
|
1,632.7
2,241.3
1,076.3
(393.3)
1,624.9 |
| 1999
1998 1997 1996 1995 |
2,416.7
2,584.6
2,165.5
7,156.8
5,229.2 |
48.4
37.0
38.6
5,294.2
3,877.0 |
0.0
0.0
0.0
0.0
0.0 |
2,368.3
2,547.6
2,126.9
1,862.6
1,352.2 |
0.0013%
0.0010%
0.0011%
0.1622%
0.1238% |
2,047.0
817.5
247.3
353.6
202.2 |
1,199.7
(5.7)
(505.7)
(417.2)
(354.2) |
823.4
782.6
677.2
568.3
510.6 |
23.9
40.6
75.8
202.5
45.8 |
0
0
0
0
0 |
369.7
1,767.1
1,918.2
6,803.2
5,027.0 |
| 1994
1993 1992 1991 1990 |
7,682.1
7,354.5
6,479.3
5,886.5
3,855.3 |
6,722.7
6,682.0
5,758.6
5,254.0
2,872.3 |
0.0
0.0
0.0
0.0
0.0 |
959.4
672.5
720.7
632.5
983.0 |
0.2192%
0.2157%
0.1815%
0.1613%
0.0868% |
(1,825.1)
(6,744.4)
(596.8)
16,925.3
13,059.3 |
(2,459.4)
(7,660.4)
(2,274.7)
15,496.2
12,133.1 |
443.2
418.5
614.8 3
326.1
275.6 |
191.1
497.5 1,063.1
1,103.0 650.6 |
0
0
35.4
42.4
56.1 |
9,507.2
14,098.9
7,111.5
(10,996.4)
(9,147.9) |
| 1989
1988 1987 1986 1985 |
3,494.8
3,347.7
3,319.4
3,260.1
3,385.5 |
1,885.0
1,773.0
1,696.0
1,516.9
1,433.5 |
0.0
0.0
0.0
0.0
0.0 |
1,609.8
1,574.7
1,623.4
1,743.2
1,952.0 |
0.0816%
0.0825%
0.0833%
0.0787%
0.0815% |
4,352.2
7,588.4
3,270.9
2,963.7
1,957.9 |
3,811.3
6,298.3
2,996.9
2,827.7
1,569.0 |
219.9
223.9
204.9
180.3
179.2 |
321.0
1,066.2
69.1
(44.3)
209.7 |
5.6
0
0
0
0 |
(851.8)
(4,240.7)
48.5
296.4
1,427.6 |
| 1984
1983 1982 1981 1980 |
3,099.5
2,628.1
2,524.6
2,074.7
1,310.4 |
1,321.5
1,214.9
1,108.9
1,039.0
951.9 |
0.0
164.0
96.2
117.1
521.1 |
1,778.0
1,577.2
1,511.9
1,152.8
879.6 |
0.0800%
0.0714%
0.0769%
0.0714%
0.0370% |
1,999.2
969.9
999.8
848.1
83.6 |
1,633.4
675.1
126.4
320.4
(38.1) |
151.2
135.7
129.9
127.2
118.2 |
214.6
159.1 743.5 400.5
3.5 |
0
0
0
0
0 |
1,100.3
1,658.2
1,524.8
1,226.6
1,226.8 |
| 1979
1978 1977 1976 1975 |
1,090.4
952.1
837.8
764.9
689.3 |
881.0
810.1
731.3
676.1
641.3 |
524.6
443.1
411.9
379.6
362.4 |
734.0
585.1
518.4
468.4
410.4 |
0.0333%
0.0385%
0.0370%
0.0370%
0.0357% |
93.7
148.9
113.6
212.3
97.5 |
(17.2)
36.5
20.8
28.0
27.6 |
106.8
103.3
89.3
180.4 4
67.7 |
4.1
9.1
3.5
3.9
2.2 |
0
0
0
0
0 |
996.7
803.2
724.2
552.6
591.8 |
| 1974
1973 1972 1971 1970 |
668.1
561.0
467.0
415.3
382.7 |
587.4
529.4
468.8
417.2
369.3 |
285.4
283.4
280.3
241.4
210.0 |
366.1
315.0
278.5
239.5
223.4 |
0.0435%
0.0385%
0.0333%
0.0345%
0.0357% |
159.2
108.2
65.7
60.3
46.0 |
97.9
52.5
10.1
13.4
3.8 |
59.2
54.4
49.6
46.9
42.2 |
2.1
1.3
6.0 5
0.0
0.0 |
0
0
0
0
0 |
508.9
452.8
401.3
355.0
336.7 |
| 1969
1968 1967 1966 1965 |
335.8
295.0
263.0
241.0
214.6 |
364.2
334.5
303.1
284.3
260.5 |
220.2
202.1
182.4
172.6
158.3 |
191.8
162.6
142.3
129.3
112.4 |
0.0333%
0.0333%
0.0333%
0.0323%
0.0323% |
34.5
29.1
27.3
19.9
22.9 |
1.0
0.1
2.9
0.1
5.2 |
33.5
29.0
24.4
19.8
17.7 |
0.0
0.0
0.0
0.0
0.0 |
0
0
0
0
0 |
301.3
265.9
235.7
221.1
191.7 |
| 1964
1963 1962 1961 1960 |
197.1
181.9
161.1
147.3
144.6 |
238.2
220.6
203.4
188.9
180.4 |
145.2
136.4
126.9
115.5
100.8 |
104.1
97.7
84.6
73.9
65.0 |
0.0323%
0.0313%
0.0313%
0.0323%
0.0370% |
18.4
15.1
13.8
14.8
12.5 |
2.9
0.7
0.1
1.6
0.1 |
15.5
14.4
13.7
13.2
12.4 |
0.0
0.0
0.0
0.0
0.0 |
0
0
0
0
0 |
178.7
166.8
147.3
132.5
132.1 |
| 1959
1958 1957 1956 1955 |
136.5
126.8
117.3
111.9
105.8 |
178.2
166.8
159.3
155.5
151.5 |
99.6
93.0
90.2
87.3
85.4 |
57.9
53.0
48.2
43.7
39.7 |
0.0370%
0.0370%
0.0357%
0.0370%
0.0370% |
12.1
11.6
9.7
9.4
9.0 |
0.2
0.0
0.1
0.3
0.3 |
11.9
11.6
9.6
9.1
8.7 |
0.0
0.0
0.0
0.0
0.0 |
0
0
0
0
0 |
124.4
115.2
107.6
102.5
96.8 |
| 1954
1953 1952 1951 1950 |
99.7
94.2
88.6
83.5
84.8 |
144.2
138.7
131.0
124.3
122.9 |
81.8
78.5
73.7
70.0
68.7 |
37.3
34.0
31.3
29.2
30.6 |
0.0357%
0.0357%
0.0370%
0.0370%
0.0370% |
7.8
7.3
7.8
6.6
7.8 |
0.1
0.1
0.8
0.0
1.4 |
7.7
7.2
7.0
6.6
6.4 |
0.0
0.0
0.0
0.0
0.0 |
0
0
0
0
0 |
91.9
86.9
80.8
76.9
77.0 |
| 1949
1948 1947 1946 1945 |
151.1
145.6
157.5
130.7
121.0 |
122.7
119.3
114.4
107.0
93.7 |
0.0
0.0
0.0
0.0
0.0 |
28.4
26.3
43.1
23.7
27.3 |
0.0833%
0.0833%
0.0833%
0.0833%
0.0833% |
6.4
7.0
9.9
10.0
9.4 |
0.3
0.7
0.1
0.1
0.1 |
6.1
6.3 6
9.8
9.9
9.3 |
0.0
0.0
0.0
0.0
0.0 |
0
0
0
0
0 |
144.7
138.6
147.6
120.7
111.6 |
| 1944
1943 1942 1941 1940 |
99.3
86.6
69.1
62.0
55.9 |
80.9
70.0
56.5
51.4
46.2 |
0.0
0.0
0.0
0.0
0.0 |
18.4
16.6
12.6
10.6
9.7 |
0.0833%
0.0833%
0.0833%
0.0833%
0.0833% |
9.3
9.8
10.1
10.1
12.9
|
0.1
0.2
0.5
0.6
3.5 |
9.2
9.6
9.6
9.5
9.4 |
0.0
0.0
0.0
0.0
0.0 |
0
0
0
0
0 |
90.0
76.8
59.0
51.9
43.0 |
| 1939
1938 1937 1936 1935
1933-34 |
51.2
47.7
48.2
43.8
20.8
7.0 |
40.7
38.3
38.8
35.6
11.5
0.0 |
0.0
0.0
0.0
0.0
0.0
0.0
|
10.5
9.4
9.4
8.2
9.3
7.0 |
0.0833%
0.0833%
0.0833%
0.0833%
0.0833%
N/A |
16.4
11.3
12.2
10.9
11.3
10.0 |
7.2
2.5
3.7
2.6
2.8
0.2 |
9.2
8.8
8.5
8.3
8.5
9.8 |
0.0
0.0
0.0
0.0
0.0
0.0
|
0
0
0
0
0
0
|
34.8
36.4
36.0
32.9
9.5
(3.0)
|
1 Figures represent only BIF-insured
institutions prior to 1990, BIF- and
SAIF-insured institutions from 1990 through 2005, and DIF-insured
institutions beginning in 2006. After 1995, all thrift closings became
the responsibility of the FDIC and amounts are reflected in the SAIF.
The effective assessment rate is calculated from annual assessment
income (net of assessment credits), excluding transfers to the
Financing
Corporation (FICO), Resolution Funding Corporation (REFCORP) and FSLIC
Resolution Fund, divided by the four quarter average
assessment base. The effective rates from 1950 through 1984 varied from
the statutory rate of 0.0833 percent due to assessment credits provided
in those years. The statutory rate increased to 0.12 percent in 1990
and to a minimum of 0.15 percent in 1991. The effective rates in 1991
and
1992 varied because the FDIC exercised new authority to increase
assessments above the statutory minimum rate when needed. Beginning in
1993, the effective rate was based on a risk-related premium system
under which institutions paid assessments in the range of 0.23 percent
to
0.31 percent. In May 1995, the BIF reached the mandatory
recapitalization level of 1.25 percent. As a result, BIF assessment
rates were reduced
to a range of 0.04 percent to 0.31 percent of assessable deposits,
effective June 1995, and assessments totaling $1.5 billion were
refunded in
September 1995. Assessment rates for the BIF were lowered again to a
range of 0 to 0.27 percent of assessable deposits, effective the start
of
1996. In 1996, the SAIF collected a one-time special assessment of $4.5
billion. Subsequently, assessment rates for the SAIF were lowered
to the same range as the BIF, effective October 1996. This range of
rates remained unchanged for both funds through 2006. As part of the
implementation of the Federal Deposit Insurance Reform Act of 2005,
assessment rates were increased to a range of 0.05 percent to 0.43
percent
of assessable deposits effective at the start of 2007, but many
institutions received a one-time assessment credit ($4.7 billion in
total) to offset the
new assessments. On December 16, 2008, the FDIC Board of Directors (the
“Board”) adopted a final rule to temporarily increase assessment
rates for the first quarter of 2009 to a range of 0.12 percent to 0.50
percent of assessable deposits. On February 27, 2009, the Board adopted
a
final rule effective April 1, 2009, setting initial base assessment
rates to a range of 0.12 percent to 0.45 percent of assessable
deposits. On June
30, 2009, a special assessment was imposed on all insured banks and
thrifts, which amounted in aggregate to approximately $5.4 billion. For
8,106 institutions, with $9.3 trillion in assets, the special
assessment was 5 basis points of each institution’s assets minus tier
one capital; 89 other
institutions, with assets of $4.0 trillion, had their special
assessment capped at 10 basis points of their second quarter
assessment base.
2 These expenses, which are presented as operating expenses in the Statement of Income and Fund Balance, pertain to the FDIC in its corporate capacity only and do not include costs that are charged to the failed bank receiverships that are managed by the FDIC. The receivership expenses are presented as part of the “Receivables from Resolutions, net” line on the Balance Sheet. The narrative and graph presented in the “Corporate Planning and Budget” section of this report (page 127) show the aggregate (corporate and receivership) expenditures of the FDIC.
3 Includes $210 million for the cumulative effect of an accounting change for certain postretirement benefits.
4 Includes a $106 million net loss on government securities.
5 This amount represents interest and other insurance expenses from 1933 to 1972.
6 Includes the aggregate amount of $81 million of interest paid on capital stock between 1933 and 1948.
Number, Assets, Deposits, Losses, and Loss to Funds of Insured
Thrifts Taken Over or Closed Because of Financial Difficulties,
1989 Through 19951
Dollars in Thousands |
| Year |
Total |
Assets |
Deposits |
Estimated
Receivership
Loss2 |
Loss
to
Funds3 |
| Total |
748 |
$393,986,574 |
$317,501,978 |
$75,979,051 |
$81,577,711 |
1995
1994
1993
1992
1991
1990
1989 4 |
2
2
10
59
144
213
318 |
423,819
136,815
6,147,962
44,196,946
78,898,904
129,662,498
134,519,630 |
414,692
127,508
4,881,461
34,773,224
65,173,122
98,963,962
113,168,009 |
28,192
11,472
267,595
3,287,038
9,235,975
16,063,752
47,085,027 |
27,750
14,599
65,212
3,832,275
9,734,271
19,258,646
48,644,958 |
1 Beginning in 1989 through July 1, 1995, all
thrift closings
were the responsibility of the Resolution Trust Corporation
(RTC). Since the RTC was terminated on December 31, 1995, and all
assets and liabilities transferred to the FSLIC
Resolution Fund (FRF), all the results of the thrift closing activity
from 1989 through 1995 are now reflected on FRF’s
books. Year is the year of failure, not the year of resolution.
2 The estimated losses
represent the projected loss at the fund level from receiverships for
unreimbursed subrogated claims
of the FRF and unpaid advances to receiverships from the FRF.
3 The Loss to Funds
represents the total resolution cost of the failed thrifts in the
FRF-RTC fund, which includes
corporate revenue and expense items such as interest expense on Federal
Financing Bank debt, interest expense on
escrowed funds, and interest revenue on advances to receiverships, in
addition to the estimated losses for receiverships.
4Total for 1989 excludes
nine failures of the former FSLIC.
FDIC-Insured Institutions Closed During 2011
Dollars in Thousands |
| Codes for Bank Class: |
NM = State-chartered bank
that is not a member of the Federal Reserve
System
N = National Bank |
SB = Savings Bank
SI = Stock and Mutual Savings
Bank
|
SM = State-chartered bank that is a member of the Federal Reserve
System
SA = Savings Association |
| Name
and
Location |
Bank
Class
|
Number
of Deposit
Accounts
|
Total
Assets1
|
Total
Deposits1 |
Insured
Deposit Funding
and Other
Disbursements
|
Estimated
Loss to
the DIF2 |
Date
of
Closing or
Acquisition
|
Receiver/Assuming
Bank
and Location |
Purchase and Assumption - All Deposits |
The First National Bank of Davis
Davis, OK |
N
|
2,334 |
$90,183 |
$68,331 |
$117,515 |
$25,925 |
03/11/11 |
The Pauls Valley National Bank
Pauls Valley, OK |
Whole Bank Purchase and Assumption - All Deposits |
First Commercial Bank of Florida Orlando, FL
|
SM
|
14,657
|
$578,638 |
$537,223 |
$532,370 |
$113,687 |
01/07/11 |
First Southern Bank
Boca Raton, FL |
Legacy Bank
Scottsdale, AZ |
NM |
1,262
|
$136,446 |
$119,685 |
$115,300 |
$39,529 |
01/07/11 |
Enterprise Bank and Trust
St. Louis, MO |
Oglethorpe Bank
Brunswick, GA |
NM |
8,414
|
$211,149 |
$201,369 |
$199,988 |
$77,875 |
01/14/11 |
Bank of the Ozarks
Little Rock, AR |
Community South Bank and Trust
Easley, SC |
NM |
13,832
|
$340,986
|
$314,250 |
$321,432 |
$65,732 |
01/21/11 |
CertusBank, National Association
Easley, SC
|
The Bank of Asheville
Asheville, NC |
NM |
10,489 |
$204,925 |
$199,394 |
$194,360 |
$58,361 |
01/21/11 |
First Bank
Troy, NC |
United Western Bank
Denver, CO |
SA |
6,388 |
$2,153,690 |
$1,535,194 |
$1,628,067 |
$372,785 |
01/21/11 |
First-Citizens Bank and Trust Company
Raleigh, NC |
Evergreen State Bank
Stoughton, WI |
NM |
7,084 |
$240,949 |
$193,694 |
$193,625 |
$37,690 |
01/28/11 |
MacFarland State Bank
McFarland, WI |
First Community Bank
Taos, NM |
SM
|
81,640 |
$2,188,154 |
$1,847,851 |
$1,815,138 |
$299,150 |
01/28/11 |
U.S. Bank, National
Association
Minneapolis, MN |
First State Bank
Camargo, OK |
NM |
1,528
|
$44,546
|
$41,204 |
$43,105 |
$35,122 |
01/28/11 |
Bank 7
Oklahoma City, OK |
American Trust Bank
Roswell, GA |
NM
|
4,260
|
$238,205
|
$222,161 |
$225,382 |
$79,591 |
02/04/11 |
Renasant Bank
Tupelo, MS |
Community First Bank
Chicago, IL |
SM
|
1,404
|
$51,083 |
$49,504 |
$50,032 |
$17,456 |
02/04/11 |
Northbrook Bank and
Trust Company
Northbrook, IL |
North Georgia Bank
Watkinsville, GA |
NM
|
3,833
|
$153,172 |
$139,672 |
$137,002 |
$54,619 |
02/04/11 |
BankSouth
Greensboro, GA |
Badger State Bank
Cassville, WI |
NM |
5,386 |
$83,828 |
$78,549 |
$77,786 |
$20,798 |
02/11/11 |
Royal Bank
Elroy, WI |
Canyon National Bank
Palm Springs, CA |
N |
9,588 |
$210,859 |
$205,285 |
$205,839 |
$19,065 |
02/11/11 |
Pacific Premier Bank
Costa Mesa, CA |
Peoples State Bank
Hamtramck, MI |
NM |
21,775 |
$390,524 |
$389,868 |
$388,437 |
$134,570 |
02/11/11 |
First Michigan Bank
Troy, MI |
Sunshine State Community Bank
Port Orange, FL |
NM |
8,387 |
$125,531 |
$116,715 |
$111,658 |
$34,884 |
02/11/11 |
Premier American
Bank, N.A.
Miami, FL |
Charter Oak Bank
Napa, CA |
NM
|
2,416 |
$120,833 |
$105,309 |
$100,297 |
$25,905 |
02/18/11 |
Bank of Marin
Novato, CA |
Citizens Bank of Effingham
Springfield, GA |
NM
|
11,329 |
$214,275 |
$206,490 |
$208,501 |
$55,387 |
02/18/11 |
Heritage Bank of the South
Albany, GA |
Habersham Bank
Clarkesville, GA |
NM
|
21,586 |
$387,681 |
$339,934 |
$342,242 |
$121,456 |
02/18/11 |
SCBT National Association
Orangeburg, SC |
San Luis Trust Bank, FSB
San Luis Obispo, CA |
SA
|
3,993 |
$332,596 |
$272,216 |
$272,049 |
$96,403 |
02/18/11 |
First California Bank
Westlake Village, CA |
Valley Community Bank
St. Charles, IL |
NM
|
6,176 |
$123,774 |
$124,179 |
$123,022 |
$30,277 |
02/25/11 |
First State Bank
Mendota, IL |
Legacy Bank
Milwaukee, WI |
SM |
4,761 |
$190,418 |
$183,309 |
$199,694 |
$53,309 |
03/11/11 |
Seaway Bank and
Trust Company
Chicago, IL |
The Bank of Commerce
Wood Dale, IL |
NM |
3,139 |
$163,074 |
$161,379 |
$165,795 |
$47,322 |
03/25/11 |
Advantage National
Bank Group
Elk Grove Village, IL |
Nevada Commerce Bank
Las Vegas, NV |
NM
|
1,601 |
$135,064 |
$128,573 |
$130,778 |
$39,818 |
04/08/11 |
City National Bank
Los Angeles, CA |
Western Springs National Bank and Trust
Western Springs, IL |
N
|
6,870 |
$186,677 |
$182,441 |
$185,555 |
$32,523 |
04/08/11 |
Heartland Bank and
Trust Company
Bloomington, IL |
Bartow County Bank
Cartersville, GA |
NM
|
20,216 |
$314,019 |
$290,005 |
$290,241 |
$78,302 |
04/15/11 |
Hamilton State Bank
Hoschton, GA |
Heritage Banking Group
Carthage, MS |
NM
|
11,820 |
$228,328 |
$205,035 |
$205,753 |
$57,429 |
04/15/11 |
Trustmark National Bank
Jackson, MS |
New Horizons Bank
East Ellijay, GA |
NM
|
3,251 |
$103,055 |
$99,022 |
$99,562 |
$37,622 |
04/15/11 |
Citizens South Bank
Gastonia, NC |
Nexity Bank
Birmingham, AL |
NM
|
11,141 |
$757,574 |
$611,681 |
$609,677 |
$196,204 |
04/15/11 |
Alostar Bank of Commerce
Birmingham, AL |
Rosemount National Bank
Rosemount, MN |
N
|
2,887 |
$21,454 |
$20,980 |
$22,899 |
$8,986 |
04/15/11 |
Central Bank
Stillwater, MN |
Superior Bank
Birmingham, AL |
SA
|
110,217 |
$2,977,290 |
$2,736,201 |
$2,752,261 |
$276,107 |
04/15/11 |
Superior Bank, N.A.
Birmingham, AL |
Community Central Bank
Mount Clemens, MI |
NM
|
9,558 |
$451,683 |
$371,494 |
$359,734 |
$191,415 |
04/29/11 |
Talmer Bank & Trust
Troy, MI |
Cortez Community Bank
Brooksville, FL |
NM
|
2,751 |
$66,282 |
$65,439 |
$66,587 |
$26,709 |
04/29/11 |
Premier American
Bank, N.A.
Miami, FL |
First Choice Community Bank
Dallas, GA |
NM |
11,419 |
$291,196 |
$294,769 |
$295,306 |
$100,197 |
04/29/11 |
Bank of the Ozarks
Little Rock, AR |
First National Bank of Central Florida
Winter Park, FL |
N |
7,247 |
$342,079 |
$308,784 |
$306,179 |
$53,519 |
04/29/11 |
Premier American
Bank, N.A.
Miami, FL |
The Park Avenue Bank
Valdosta, GA |
SM |
38,484 |
$849,409 |
$724,483 |
$694,752 |
$326,980 |
04/29/11 |
Bank of the Ozarks
Little Rock, AR |
Coastal Bank
Cocoa Beach, FL |
SA |
3,880 |
$129,429 |
$123,950 |
$124,171 |
$20,561 |
05/06/11 |
Premier American
Bank, N.A.
Miami, FL |
Atlantic Southern Bank
Macon, GA |
NM |
22,000 |
$741,855 |
$707,643 |
$680,442 |
$279,539 |
05/20/11 |
CertusBank, N.A.
Easley, SC |
First Georgia Banking Co.
Franklin, GA |
NM |
27,959 |
$730,981 |
$702,231 |
$672,275 |
$177,408 |
05/20/11 |
CertusBank, N.A.
Easley, SC |
Summit Bank
Burlington, WA |
NM |
4,495 |
$142,729 |
$131,631 |
$127,373 |
$21,969 |
05/20/11 |
Columbia State Bank
Tacoma, WA |
First Heritage Bank
Snohomish, WA |
NM |
9,427 |
$173,478 |
$163,303 |
$161,772 |
$41,368 |
05/27/11 |
Columbia State Bank
Tacoma, WA |
Atlantic Bank and Trust
Charleston, SC |
SA
|
3,996 |
$208,204 |
$191,614 |
$185,844 |
$44,145 |
06/03/11 |
First Citizens Bank and
Trust Company, Inc.
Columbia, SC |
First Commercial Bank of Tampa Bay
Tampa, FL |
NM
|
2,163 |
$98,624 |
$92,641 |
$92,400 |
$34,940 |
06/17/11 |
Stonegate Bank
Fort Lauderdale, FL |
McIntosh State Bank
Jackson, GA |
NM
|
20,633 |
$339,929 |
$324,403 |
$312,588 |
$87,540 |
06/17/11 |
Hamilton State Bank
Hoschton, GA |
Mountain Heritage Bank
Clayton, GA |
NM |
2,779 |
$103,716 |
$89,554 |
$91,032 |
$45,738 |
06/24/11 |
First American Bank and
Trust Company
Athens, GA |
Colorado Capital Bank
Castle Rock, CO |
NM
|
7,078 |
$665,806 |
$635,202 |
$628,260 |
$287,099 |
07/08/11 |
First-Citizens Bank &
Trust Company
Raleigh, NC |
First Chicago Bank and Trust
Chicago, IL |
SM
|
17,859 |
$896,864 |
$830,530 |
$834,519 |
$275,894 |
07/08/11 |
Northbrook Bank &
Trust Company
Northbrook, IL |
Signature Bank
Windsor, CO |
NM
|
2,723 |
$62,518 |
$60,349 |
$61,752 |
$26,373 |
07/08/11 |
Points West
Community Bank
Julesburg, CO |
First Peoples Bank
Port Saint Lucie, FL |
NM
|
8,323 |
$225,035 |
$207,621 |
$214,077 |
$12,387 |
07/15/11 |
Florida Community
Bank, N.A.
Miami, FL |
High Trust Bank
Stockbridge, GA |
NM |
2,440 |
$180,340 |
$177,221 |
$177,388 |
$70,381 |
07/15/11 |
Ameris Bank
Moultrie, GA |
One Georgia Bank
Atlanta, GA |
NM
|
1,861 |
$177,715 |
$158,123 |
$157,917 |
$48,939 |
07/15/11 |
Ameris Bank
Moultrie, GA |
Summit Bank
Prescott, AZ |
NM |
2,455 |
$73,066 |
$67,471 |
$68,365 |
$15,428 |
07/15/11 |
The Foothills Bank
Yuma, AZ |
Bank of Choice
Greeley, CO |
NM
|
33,194 |
$954,106 |
$818,670 |
$812,887 |
$216,810 |
07/22/11 |
Bank Midwest, N.A.
Kansas City, MO |
Landmark Bank of Florida
Sarasota, FL |
SM
|
7,972 |
$266,482 |
$244,362 |
$238,884 |
$38,542 |
07/22/11 |
American Momentum Bank
Tampa, FL |
Southshore Community Bank
Apollo Beach, FL |
NM
|
1,337 |
$41,252 |
$41,434 |
$42,091 |
$12,515 |
07/22/11 |
American Momentum Bank
Tampa, FL |
BankMeridian, N.A.
Columbia, SC |
N
|
3,650 |
$232,648 |
$209,737 |
$206,959 |
$69,114 |
07/29/11 |
SCBT National Association
Orangeburg, SC |
Integra Bank, N.A.
Evansville, IN |
N
|
140,008 |
$1,994,430 |
$1,693,592 |
$2,219,143 |
$205,874 |
07/29/11 |
Old National Bank
Evansville, IN |
Virginia Business Bank
Richmond, VA |
SM |
581 |
$83,493 |
$72,955 |
$78,785 |
$21,523 |
07/29/11 |
Xenith Bank
Richmond, VA |
Bank of Shorewood
Shorewood, IL |
NM
|
6,681 |
$110,723 |
$104,021 |
$106,460 |
$29,692 |
08/05/11 |
Heartland Bank &
Trust Company
Bloomington, IL |
Bank of Whitman
Colfax, WA |
SM
|
23,299 |
$548,570 |
$515,732 |
$498,979 |
$135,323 |
08/05/11 |
Columbia State Bank
Tacoma, WA |
First National Bank of Olathe
Olathe, KS |
N
|
27,367 |
$538,091 |
$524,290 |
$511,819 |
$119,472 |
08/12/11 |
Enterprise Bank & Trust
Clayton, MO |
Public Savings Bank
Huntingdon Valley, PA |
SB |
904 |
$46,818 |
$45,770 |
$48,185 |
$14,982 |
08/18/11 |
Capital Bank, N.A.
Rockville, MD |
First Choice Bank
Geneva, IL |
NM
|
3,221 |
$141,016 |
$137,215 |
$131,111 |
$35,184 |
08/19/11 |
Inland Bank & Trust
Oak Brook, IL |
First Southern National Bank
Stateboro, GA |
N
|
8,873 |
$164,599 |
$159,673 |
$147,285 |
$43,901 |
08/19/11 |
Heritage Bank of the South
Albany, GA |
Lydian Private Bank
Palm Beach, FL |
SA
|
26,875 |
$1,700,117 |
$1,253,835 |
$1,277,109 |
$292,057 |
08/19/11 |
Sabadell United Bank, N.A.
Miami, FL |
Creekside Bank
Woodstock, GA |
NM
|
2,204 |
$102,338 |
$96,583 |
$98,591 |
$32,227 |
09/02/11 |
Georgia Commerce Bank
Atlanta, GA |
Patriot Bank of Georgia
Cumming, GA |
NM
|
2,468 |
$150,751 |
$140,612 |
$136,077 |
$48,986 |
09/02/11 |
Georgia Commerce Bank
Atlanta, GA |
The First National Bank of Florida
Milton, FL |
N
|
12,096 |
$296,841 |
$280,095 |
$248,052 |
$50,203 |
09/09/11 |
CharterBank
West Point, GA |
Bank of the Commonwealth
Norfolk, VA |
SM
|
20,383 |
$985,096 |
$901,845 |
$864,974 |
$268,111 |
09/23/11 |
Southern Bank &
Trust Company
Mount Olive, NC |
Citizens Bank of Northern California
Nevada City, CA |
NM
|
16,248 |
$288,765 |
$253,079 |
$241,383 |
$41,053 |
09/23/11 |
Tri Counties Bank
Chico, CA |
First International Bank
Plano, TX |
NM
|
9,148 |
$239,916 |
$208,775 |
$205,505 |
$57,644 |
09/30/11 |
American First
National Bank
Houston, TX |
The RiverBank
Wyoming, MN |
NM
|
31,327 |
$419,723 |
$384,120 |
$385,166 |
$74,971 |
10/07/11 |
Central Bank
Stillwater, MN |
Sun Security Bank
Ellington, MO |
NM
|
19,213 |
$351,492 |
$280,649 |
$282,436 |
$121,734 |
10/07/11 |
Great Southern Bank
Springfield, MO |
Blue Ridge Savings Bank, Inc.
Asheville, NC |
SB
|
5,503 |
$161,430 |
$159,628 |
$161,760 |
$41,985 |
10/14/11 |
Bank of North Carolina
Thomasville, NC |
Country Bank
Aledo, IL |
NM
|
6,476 |
$195,034 |
$180,835 |
$180,555 |
$67,225 |
10/14/11 |
Blackhawk Bank & Trust
Milan, IL |
First State Bank
Cranford, NJ |
NM
|
3,883 |
$191,852 |
$188,099 |
$190,497 |
$49,650 |
10/14/11 |
Northfield Bank
Staten Island, NY |
Piedmont Community Bank
Gray, GA |
NM
|
5,022 |
$198,993 |
$178,773 |
$177,419 |
$75,872 |
10/14/11 |
State Bank &
Trust Company
Macon, GA |
Community Banks of Colorado
Greenwood Village, CO |
SM
|
52,119 |
$1,280,964 |
$1,239,630 |
$1,217,323 |
$227,340 |
10/21/11 |
Bank Midwest, N.A.
Kansas City, MO |
Community Capital Bank
Jonesboro, GA |
NM
|
4,032 |
$165,291 |
$157,808 |
$157,578 |
$66,293 |
10/21/11 |
State Bank &
Trust Company
Macon, GA |
Decatur First Bank
Decatur, GA |
NM
|
8,213 |
$184,750 |
$172,042 |
$171,399 |
$36,898 |
10/21/11 |
Fidelity Bank
Atlanta, GA |
Old Harbor Bank
Clearwater, FL |
NM
|
7,506 |
$209,048 |
$212,184 |
$211,246 |
$43,507 |
10/21/11 |
1st United Bank
Boca Raton, FL |
All American Bank
Des Plaines, IL |
NM
|
1,341 |
$34,800 |
$30,542 |
$32,075 |
$11,594 |
10/28/11 |
International Bank
of Chicago
Chicago, IL |
Mid City Bank, Inc.
Omaha, NE |
NM
|
6,638 |
$106,075 |
$105,461 |
$102,662 |
$17,390 |
11/04/11 |
Premier Bank
Purdum, NE |
SunFirst Bank
Saint George, UT |
NM
|
4,862 |
$198,081 |
$169,135 |
$150,980 |
$53,230 |
11/04/11 |
Cache Valley Bank
Logan, UT |
Community Bank of Rockmart
Rockmart, GA |
NM
|
2,567 |
$62,383 |
$55,906 |
$57,481 |
$18,898 |
11/11/11 |
Century Bank of Georgia
Cartersville, GA |
Central Progressive Bank
Lacombe, LA |
NM
|
26,761 |
$383,132 |
$347,720 |
$346,598 |
$61,919 |
11/18/11 |
First NBC Bank
New Orleans, LA |
Polk County Bank
Johnston, IA |
NM
|
7,112 |
$91,580 |
$81,967 |
$82,181 |
$17,339 |
11/18/11 |
Grinnell State Bank
Grinnell, IA |
Premier Community Bank of the Emerald Coast
Crestview, FL |
NM
|
2,782 |
$125,976 |
$112,050 |
$111,322 |
$35,512 |
12/16/11 |
Summit Bank, N.A.
Panama City, FL |
Western National Bank
Phoenix, AZ |
N |
2,678 |
$162,872 |
$144,491 |
$145,903 |
$42,869 |
12/16/11 |
Washington Federal
Seattle, WA |
Insured
Deposit
Transfer/Purchase
&
Assumption |
Enterprise Banking Co.
McDonough, GA |
NM |
2,173 |
$99,461 |
$94,591 |
$106,020 |
$44,600 |
01/21/11 |
Federal Deposit Insurance
Corporation
|
FirsTier Bank
Louisville, CO |
NM |
10,399 |
$764,090 |
$718,797 |
$768,384 |
$270,815 |
01/28/11 |
Federal Deposit Insurance
Corporation
|
- Total Assets and Total Deposits data is based
upon the last Call Report
filed by the institution prior to failure.
- Estimated losses are as of
12/31/11. Estimated losses are routinely
adjusted with updated information from new appraisals and asset sales,
which
ultimately affect the asset values and projected recoveries. Represents
the estimated loss to the DIF from deposit insurance obligations. This
amount does not include the estimated loss allocable to the Transaction
Account Guarantee and Debt Guarantee Program claims.
Recoveries and Losses by the Deposit Insurance Fund on
Disbursements for the Protection of Depositors,
1934 – 2011
Dollars in Thousands |
Bank and Thrift Failures 1
|
| Year 2 |
Number
of
Banks/
Thrifts |
Total
Assets 3 |
Total
Deposits 3 |
Insured
Deposit
Funding
and Other
Disbursements |
Recoveries |
Estimated
Additional
Recoveries |
Estimated
Losses |
|
2,509 |
$914,003,552 |
$685,069,066 |
$561,016,616 |
$390,577,746 |
$48,373,749 |
$122,065,121 |
2011
20104 |
92
157
|
34,922,997
92,084,987
|
31,071,862
79,548,141 |
31,531,359
82,172,287 |
910,708
49,268,600 |
22,675,379
9,999,848 |
7,945,272
22,903,839 |
20094
20084
2007
2006
2005 |
140
25
3
0
0 |
169,709,160
371,945,480
2,614,928
0
0 |
137,067,132
234,321,715
2,424,187
0
0 |
135,863,380
205,431,491
1,914,408
0
0 |
82,330,857
182,605,479
1,368,679
0
0 |
11,800,273
2,651,137
343,954
0
0 |
38,732,250
20,174,875
204,775
0
0 |
2004
2003
2002
2001
2000 |
4
3
11
4
7 |
170,099
947,317
2,872,720
1,821,760
410,160 |
156,733
901,978
2,512,834
1,661,214
342,584 |
138,912
883,772
2,126,922
1,605,191
297,313 |
134,978
812,933
1,689,034
1,128,577
265,175 |
17
8,192
68,928
180,378
0 |
3,917
62,647
368,960
296,236
32,138 |
1999
1998
1997
1996
1995 |
8
3
1
6
6 |
1,592,189
290,238
27,923
232,634
802,124 |
1,320,573
260,675
27,511
230,390
776,387 |
1,307,226
292,686
25,546
201,533
609,043 |
711,758
58,248
20,520
140,918
524,571 |
4,584
11,608
0
0
0 |
590,884
222,830
5,026
60,615
84,472 |
1994
1993
1992
1991
1990 |
13
41
120
124
168 |
1,463,874
3,828,939
45,357,237
64,556,512
16,923,462 |
1,397,018
3,509,341
39,921,310
52,972,034
15,124,454 |
1,224,769
3,841,658
14,540,882
21,499,236
10,812,484 |
1,045,718
3,209,012
10,866,745
15,656,282
8,040,995 |
0
0
110
629,341
0 |
179,051
632,646
3,674,027
5,213,613
2,771,489 |
1989
1988
1987
1986
1985 |
206
200
184
138
116 |
28,930,572
38,402,475
6,928,889
7,356,544
3,090,897 |
24,152,468
26,524,014
6,599,180
6,638,903
2,889,801 |
11,443,281
10,432,655
4,876,994
4,632,121
2,154,955 |
5,247,995
5,055,158
3,014,502
2,949,583
1,506,776 |
0
0
0
0
0 |
6,195,286
5,377,497
1,862,492
1,682,538
648,179 |
1984
1983
1982
1981
1980 |
78
44
32
7
10 |
2,962,179
3,580,132
1,213,316
108,749
239,316 |
2,665,797
2,832,184
1,056,483
100,154
219,890 |
2,165,036
3,042,392
545,612
114,944
152,355 |
1,641,157
1,973,037
419,825
105,956
121,675 |
0
0
0
0
0 |
523,879
1,069,355
125,787
8,988
30,680 |
| 1934-1979 |
558 |
8,615,743 |
5,842,119 |
5,133,173 |
4,752,295 |
0 |
380,878 |
Recoveries and Losses by the Deposit Insurance Fund on
Disbursements for the Protection of Depositors,
1934 – 2011
Dollars in Thousands |
Assistance
Transactions |
| Year 2 |
Number
of
Banks/
Thrifts |
Total
Assets 3 |
Total
Deposits 3 |
Insured
Deposit
Funding
and Other
Disbursements |
Recoveries |
Estimated
Additional
Recoveries |
Estimated
Losses |
|
154 |
$3,317,099,253 |
$1,442,173,417 |
$11,630,356 |
$6,199,875 |
$0 |
$5,430,481 |
20115
20105 |
0
0
|
0
0
|
0
0 |
0
0 |
0
0 |
0
0 |
0
0 |
2009 5
2008 5
2007
2006
2005 |
8
5
0
0
0 |
1,917,482,183
1,306,041,994
0
0
0 |
1,090,318,282
280,806,966
0
0
0 |
0
0
0
0
0 |
0
0
0
0
0 |
0
0
0
0
0 |
0
0
0
0
0 |
2004
2003
2002
2001
2000 |
0
0
0
0
0 |
0
0
0
0
0 |
0
0
0
0
0 |
0
0
0
0
0 |
0
0
0
0
0 |
0
0
0
0
0 |
0
0
0
0
0 |
1999
1998
1997
1996
1995 |
0
0
0
0
0 |
0
0
0
0
0 |
0
0
0
0
0 |
0
0
0
0
0 |
0
0
0
0
0 |
0
0
0
0
0 |
0
0
0
0
0 |
1994
1993
1992
1991
1990 |
0
0
2
3
1 |
0
0
33,831
78,524
14,206 |
0
0
33,117
75,720
14,628 |
0
0
1,486
6,117
4,935 |
0
0
1,236
3,093
2,597 |
0
0
0
0
0 |
0
0
250
3,024
2,338 |
1989
1988
1987
1986
1985 |
1
80
19
7
4 |
4,438
15,493,939
2,478,124
712,558
5,886,381 |
6,396
11,793,702
2,275,642
585,248
5,580,359 |
2,548
1,730,351
160,877
158,848
765,732 |
252
189,709
713
65,669
406,676 |
0
0
0
0
0 |
2,296
1,540,642
160,164
93,179
359,056 |
1984
1983
1982
1981
1980 |
2
4
10
3
1 |
40,470,332
3,611,549
10,509,286
4,838,612
7,953,042 |
29,088,247
3,011,406
9,118,382
3,914,268
5,001,755 |
5,531,179
764,690
1,729,538
774,055
0 |
4,414,904
427,007
686,754
1,265
0 |
0
0
0
0
0 |
1,116,275
337,683
1,042,784
772,790
0 |
| 1934-1979 |
4 |
1,490,254 |
549,299 |
0 |
0 |
0 |
0 |
|
- Institutions closed
by
the
FDIC,
including
deposit
payoff,
insured
deposit
transfer,
and
deposit
assumption
cases.
- For 1990
through
2005,
amounts
represent
the
sum
of
BIF
and
SAIF failures (excluding those
handled by the RTC); prior to 1990, figures are
only for the BIF. After 1995, all thrift closings became the
responsibility of the FDIC and amounts are reflected in the SAIF. For
2006 to 2011,
figures are for the DIF.
- Assets and
deposit
data
are
based
on
the
last
Call
Report
or TFR filed before failure.
- Includes amounts
related
to
transaction
account
coverage
under
the
Transaction
Account
Guarantee
Program (TAG). The estimated losses as of
12/31/10 for TAG accounts in 2010, 2009, and 2008 are $571 million,
$1,639 million, and $19 million, respectively.
- Includes institutions
where
assistance
was
provided
under
a
systemic
risk
determination.
Any
costs
that
exceed
the
amounts
estimated
under
the
least
cost
resolution
requirement
would
be
recovered
through
a
special assessment on all FDIC-insured institutions.
|


