|
Appendices
Estimated Insured Deposits and the Deposit Insurance Fund,
A. Key Statistics
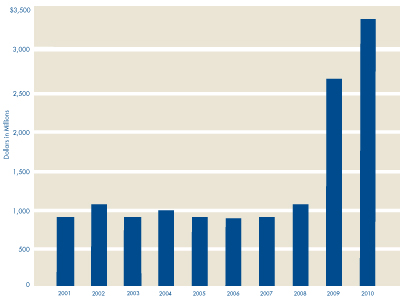
FDIC EXPENDITURES 2001 – 2010
|
 |
The FDIC's Strategic Plan and Annual
Performance Plan provide the basis for annual
planning and budgeting for needed resources. The
2010 aggregate budget (for corporate, receivership,
and investment spending) was $4.0 billion, while
actual expenditures for the year were $3.4 billion,
about $1.1 billion more than 2009 expenditures.
Over the past decade, the FDIC's expenditures
have varied in response to workload. During the
last two years, expenditures have risen, largely due
to increasing resolution and receivership activity.
To a lesser extent, increased expenses have resulted
from supervision-related costs associated with the
oversight of more troubled institutions.
Estimated Insured Deposits and the Deposit Insurance Fund, December 31, 1934, through December 31, 2010
Dollars in Millions (except Insurance Coverage)
|
|
Deposits
in
Insured
Institutions
|
|
Insurance
Fund
as
a
Percentage
of
|
| Year
|
Insurance
Coverage
1 |
Total
Domestic
Deposits
|
Est.
Insured
Deposits
2 |
Percentage
of
Insured
Deposits
|
Deposit
Insurance
Fund
|
Total
Domestic
Deposits
|
Est.
Insured
Deposits
|
2010
2009
2008
2007
2006
2005 |
$250,000
250,000
100,000
100,000
100,000
100,000 |
$7,887,730
7,705,329
7,505,409
6,921,678
6,640,097
6,229,823 |
$6,221,127
5,407,733
4,750,783
4,292,211
4,153,808
3,891,000 |
78.9
70.2
63.3
62.0
62.6
62.5 |
$(7,352.2)
(20,861.8)
17,276.3
52,413.0
50,165.3
48,596.6 |
(0.09)
(0.27)
0.23
0.76
0.76
0.78 |
(0.12)
(0.39)
0.36
1.22
1.21
1.25 |
2004
2003
2002
2001
2000 |
100,000
100,000
100,000
100,000
100,000 |
5,724,775
5,224,030
4,916,200
4,565,068
4,211,895 |
3,622,213
3,452,606
3,383,720
3,216,585
3,055,108 |
63.3
66.1
68.8
70.5
72.5 |
47,506.8
46,022.3
43,797.0
41,373.8
41,733.8 |
0.83
0.88
0.89
0.91
0.99 |
1.31
1.33
1.29
1.29
1.37 |
1999
1998
1997
1996
1995 |
100,000
100,000
100,000
100,000
100,000 |
3,885,826
3,817,150
3,602,189
3,454,556
3,318,595 |
2,869,208
2,850,452
2,746,477
2,690,439
2,663,873 |
73.8
74.7
76.2
77.9
80.3 |
39,694.9
39,452.1
37,660.8
35,742.8
28,811.5 |
1.02
1.03
1.05
1.03
0.87 |
1.38
1.38
1.37
1.33
1.08 |
1994
1993
1992
1991
1990 |
100,000
100,000
100,000
100,000
100,000 |
3,184,410
3,220,302
3,275,530
3,331,312
3,415,464 |
2,588,619
2,602,781
2,677,709
2,733,387
2,784,838 |
81.3
80.8
81.7
82.1
81.5 |
23,784.5
14,277.3
178.4
(6,934.0)
4,062.7 |
0.75
0.44
0.01
(0.21)
0.12 |
0.92
0.55
0.01
(0.25)
0.15 |
1989
1988
1987
1986
1985 |
100,000
100,000
100,000
100,000
100,000 |
3,412,503
2,337,080
2,198,648
2,162,687
1,975,030 |
2,755,471
1,756,771
1,657,291
1,636,915
1,510,496 |
80.7
75.2
75.4
75.7
76.5 |
13,209.5
14,061.1
18,301.8
18,253.3
17,956.9 |
0.39
0.60
0.83
0.84
0.91 |
0.48
0.80
1.10
1.12
1.19 |
1984
1983
1982
1981
1980 |
100,000
100,000
100,000
100,000
100,000 |
1,805,334
1,690,576
1,544,697
1,409,322
1,324,463 |
1,393,421
1,268,332
1,134,221
988,898
948,717 |
77.2
75.0
73.4
70.2
71.6 |
16,529.4
15,429.1
13,770.9
12,246.1
11,019.5 |
0.92
0.91
0.89
0.87
0.83 |
1.19
1.22
1.21
1.24
1.16 |
1979
1978
1977
1976
1975 |
40,000
40,000
40,000
40,000
40,000 |
$1,226,943
1,145,835
1,050,435
941,923
875,985 |
$808,555
760,706
692,533
628,263
569,101 |
65.9
66.4
65.9
66.7
65.0 |
$9,792.7
8,796.0
7,992.8
7,268.8
6,716.0 |
0.80
0.77
0.76
0.77
0.77 |
1.21
1.16
1.15
1.16
1.18 |
1974
1973
1972
1971
1970 |
40,000
20,000
20,000
20,000
20,000 |
833,277
766,509
697,480
610,685
545,198 |
520,309
465,600
419,756
374,568
349,581 |
62.4
60.7
60.2
61.3
64.1 |
6,124.2
5,615.3
5,158.7
4,739.9
4,379.6 |
0.73
0.73
0.74
0.78
0.80 |
1.18
1.21
1.23
1.27
1.25 |
1969
1968
1967
1966
1965 |
10,000
10,000
10,000
10,000
10,000 |
495,858
491,513
448,709
401,096
377,400 |
313,085
296,701
261,149
234,150
209,690 |
63.1
60.4
58.2
58.4
55.6 |
4,051.1
3,749.2
3,485.5
3,252.0
3,036.3 |
0.82
0.76
0.78
0.81
0.80 |
1.29
1.26
1.33
1.39
1.45 |
1964
1963
1962
1961
1960 |
10,000
10,000
10,000
10,000
10,000 |
348,981
313,304
297,548
281,304
260,495 |
191,787
177,381
170,210
160,309
149,684 |
55.0
56.6
57.0
57.0
57.5 |
2,844.7
2,667.9
2,502.0
2,353.8
2,222.2 |
0.82
0.85
0.84
0.84
0.85 |
1.48
1.50
1.47
1.47
1.48 |
1959
1958
1957
1956
1955 |
10,000
10,000
10,000
10,000
10,000 |
247,589
242,445
225,507
219,393
212,226 |
142,131
137,698
127,055
121,008
116,380 |
57.4
56.8
56.3
55.2
54.8 |
2,089.8
1,965.4
1,850.5
1,742.1
1,639.6 |
0.84
0.81
0.82
0.79
0.77 |
1.47
1.43
1.46
1.44
1.41 |
1954
1953
1952
1951
1950 |
10,000
10,000
10,000
10,000
10,000 |
203,195
193,466
188,142
178,540
167,818 |
110,973
105,610
101,841
96,713
91,359 |
54.6
54.6
54.1
54.2
54.4 |
1,542.7
1,450.7
1,363.5
1,282.2
1,243.9 |
0.76
0.75
0.72
0.72
0.74 |
1.39
1.37
1.34
1.33
1.36 |
1949
1948
1947
1946
1945 |
5,000
5,000
5,000
5,000
5,000 |
156,786
153,454
154,096
148,458
157,174 |
76,589
75,320
76,254
73,759
67,021 |
48.8
49.1
49.5
49.7
42.6 |
1,203.9
1,065.9
1,006.1
1,058.5
929.2 |
0.77
0.69
0.65
0.71
0.59 |
1.57
1.42
1.32
1.44
1.39 |
1944
1943
1942
1941
1940 |
5,000
5,000
5,000
5,000
5,000 |
134,662
111,650
89,869
71,209
65,288 |
56,398
48,440
32,837
28,249
26,638 |
41.9
43.4
36.5
39.7
40.8 |
804.3
703.1
616.9
553.5
496.0 |
0.60
0.63
0.69
0.78
0.76 |
1.43
1.45
1.88
1.96
1.86 |
1939
1938
1937
1936
1935 |
5,000
5,000
5,000
5,000
5,000 |
57,485
50,791
48,228
50,281
45,125 |
24,650
23,121
22,557
22,330
20,158 |
42.9
45.5
46.8
44.4
44.7 |
452.7
420.5
383.1
343.4
306.0 |
0.79
0.83
0.79
0.68
0.68 |
1.84
1.82
1.70
1.54
1.52 |
1934
|
5,000
|
40,060 |
18,075 |
45.1 |
291.7 |
0.73 |
1.61 |
- The Dodd-Frank Wall Street Reform and
Consumer Protection Act
(Dodd-Frank Act) temporarily provides unlimited
coverage for noninterest-bearing transaction accounts for two years
beginning December 31, 2010. Coverage limits do
not reflect temporary increases authorized by the Emergency Economic
Stabilization Act of 2008. Coverage for certain
retirement accounts increased to $250,000 in 2006. Initial coverage
limit was $2,500 from January 1 to June 30, 1934. back
- Beginning in
the
fourth
quarter
of
2010,
estimates
of
insured
deposits
include
the
Dodd-Frank
Act
temporary
unlimited
coverage
for
noninterest-bearing
transaction
accounts.
Prior
to
1989,
figures
are
for
the
Bank
Insurance
Fund
(BIF) only and exclude insured branches of foreign banks. For 1989 to
2005, figures represent sum of the BIF and
Savings Association Insurance Fund (SAIF) amounts; for 2006 to 2010,
figures are for DIF. Amounts for 1989 - 2010
include insured branches of foreign banks. Prior to year-end 1991,
insured deposits were estimated using percentages
determined from June Call and Thrift Financial Reports. back
Income and Expenses, Deposit Insurance Fund, from Beginning
of Operations, September 11, 1933, through December 31, 2010
Dollars in Millions
|
Income
|
Expenses
and
Losses
|
| Year
|
Total
|
Assessment
Income
|
Assessment
Credits
|
Investment
and
Other
|
Effective
Assessment
Rate
1 |
Total
|
Provision
for
Ins.
Losses
|
Administrative
and
Operating
Expenses
2 |
Interest
&
Other
Ins.
Expenses
|
Funding
Transfer
from
the
FSLIC
Resolution
Fund
|
Net
Income/
(Loss)
|
| Total |
$155,776.5 |
$101,879.8 |
$11,391.8 |
$65,877.3 |
|
$164,345.5 |
$134,894.6 |
$19,731.5 |
$9,719.4 |
$139.5
|
$(8,429.5)
|
| 2010
2009 2008 2007 2006
2005 |
13,379.9
24,706.4
7,306.3
3,196.2
2,643.5
2,420.5
|
13,611.2
17,865.4
4,410.4
3,730.9
31.9
60.9 |
0.8
148.0 1,445.9 3,088.0
0.0
0.0 |
(230.5)
6,989.0
4,341.8
2,553.3
2,611.6
2,359.6
|
0.1772%
0.2330%
0.0418%
0.0093%
0.0005%
0.0010%
|
75.0
60,709.0
44,339.5
1,090.9
904.3
809.3 |
(847.8)
57,711.8
41,838.8
95.0
(52.1)
(160.2) |
1,592.6
1,271.1
1,033.5
992.6
950.6
965.7 |
(669.8)
1,726.1
1,467.2
3.3
5.8
3.8 |
0
0
0
0
0
0 |
13,304.9
(36,002.6)
(37,033.2)
2,105.3
1,739.2
1,611.2
|
| 2004
2003 2002 2001 2000 |
2,240.3
2,173.6
1,795.9
2,730.1
2,570.1
|
104.2
94.8
107.8
83.2
64.3 |
0.0
0.0
0.0
0.0
0.0 |
2,136.1
2,078.8
2,276.9
2,646.9
2,505.8
|
0.0019%
0.0019%
0.0023%
0.0019%
0.0016%
|
607.6
(67.7) 719.6
3,123.4 945.2 |
(353.4)
(1,010.5)
(243.0)
2,199.3
28.0
|
941.3
935.5
945.1
887.9
883.9 |
19.7
7.3
17.5
36.2
33.3 |
0
0
0
0
0
|
1,632.7
2,241.3
1,076.3
(393.3)
1,624.9
|
| 1999
1998 1997 1996 1995 |
2,416.7
2,584.6
2,165.5
7,156.8
5,229.2
|
48.4
37.0
38.6
5,294.2
3,877.0 |
0.0
0.0
0.0
0.0
0.0 |
2,368.3
2,547.6
2,126.9
1,862.6
1,352.2
|
0.0013%
0.0010%
0.0011%
0.1622%
0.1238%
|
2,047.0
817.5
247.3
353.6
202.2
|
1,199.7
(5.7)
(505.7)
(417.2)
(354.2)
|
823.4
782.6
677.2
568.3
510.6 |
23.9
40.6
75.8
202.5
45.8 |
0
0
0
0
0 |
369.7
1,767.1
1,918.2
6,803.2
5,027.0 |
| 1994
1993 1992 1991 1990 |
7,682.1
7,354.5
6,479.3
5,886.5
3,855.3
|
6,722.7
6,682.0
5,758.6
5,254.0
2,872.3
|
0.0
0.0
0.0
0.0
0.0 |
959.4
672.5
720.7
632.5
983.0 |
0.2192%
0.2157%
0.1815%
0.1613%
0.0868%
|
(1,825.1)
(6,744.4)
(596.8)
16,925.3
13,059.3
|
(2,459.4)
(7,660.4)
(2,274.7)
15,496.2
12,133.1
|
443.2
418.5
614.8 3
326.1
275.6 |
191.1
497.5 1,063.1
1,103.0 650.6 |
0
0
35.4
42.4
56.1 |
9,507.2
14,098.9
7,111.5
(10,996.4)
(9,147.9)
|
| 1989
1988 1987 1986 1985 |
3,496.6
3,347.7
3,319.4
3,260.1
3,385.5
|
1,885.0
1,773.0
1,696.0
1,516.9
1,433.5
|
0.0
0.0
0.0
0.0
0.0 |
1,611.6
1,574.7
1,623.4
1,743.2
1,952.0
|
0.0816%
0.0825%
0.0833%
0.0787%
0.0815%
|
4,352.2
7,588.4
3,270.9
2,963.7
1,957.9
|
3,811.3
6,298.3
2,996.9
2,827.7
1,569.0
|
219.9
223.9
204.9
180.3
179.2 |
321.0
1,066.2
69.1
(44.3)
209.7 |
5.6
0
0
0
0 |
(850.0)
(4,240.7)
48.5
296.4
1,427.6
|
| 1984
1983 1982 1981 1980 |
3,099.5
2,628.1
2,524.6
2,074.7
1,310.4
|
1,321.5
1,214.9
1,108.9
1,039.0
951.9
|
0.0
164.0
96.2
117.1
521.1 |
1,778.0
1,577.2
1,511.9
1,152.8
879.6
|
0.0800%
0.0714%
0.0769%
0.0714%
0.0370%
|
1,999.2
969.9
999.8
848.1
83.6 |
1,633.4
675.1
126.4
320.4
(38.1) |
151.2
135.7
129.9
127.2
118.2 |
214.6
159.1 743.5 400.5
3.5 |
0
0
0
0
0 |
1,100.3
1,658.2
1,524.8
1,226.6
1,226.8
|
| 1979
1978 1977 1976 1975 |
1,090.4
952.1
837.8
764.9
689.3 |
881.0
810.1
731.3
676.1
641.3 |
524.6
443.1
411.9
379.6
362.4 |
734.0
585.1
518.4
468.4
410.4 |
0.0333%
0.0385%
0.0370%
0.0370%
0.0357% |
93.7
148.9
113.6
212.3
97.5 |
(17.2)
36.5
20.8
28.0
27.6 |
106.8
103.3
89.3
180.4 4
67.7 |
4.1
9.1
3.5
3.9
2.2 |
0
0
0
0
0 |
996.7
803.2
724.2
552.6
591.8 |
| 1974
1973 1972 1971 1970 |
668.1
561.0
467.0
415.3
382.7 |
587.4
529.4
468.8
417.2
369.3 |
285.4
283.4
280.3
241.4
210.0 |
366.1
315.0
278.5
239.5
223.4 |
0.0435%
0.0385%
0.0333%
0.0345%
0.0357% |
159.2
108.2
65.7
60.3
46.0 |
97.9
52.5
10.1
13.4
3.8 |
59.2
54.4
49.6
46.9
42.2 |
2.1
1.3
6.0 5
0.0
0.0 |
0
0
0
0
0 |
508.9
452.8
401.3
355.0
336.7 |
| 1969
1968 1967 1966 1965 |
335.8
295.0
263.0
241.0
214.6 |
364.2
334.5
303.1
284.3
260.5 |
220.2
202.1
182.4
172.6
158.3 |
191.8
162.6
142.3
129.3
112.4 |
0.0333%
0.0333%
0.0333%
0.0323%
0.0323% |
34.5
29.1
27.3
19.9
22.9 |
1.0
0.1
2.9
0.1
5.2 |
33.5
29.0
24.4
19.8
17.7 |
0.0
0.0
0.0
0.0
0.0 |
0
0
0
0
0 |
301.3
265.9
235.7
221.1
191.7 |
| 1964
1963 1962 1961 1960 |
197.1
181.9
161.1
147.3
144.6 |
238.2
220.6
203.4
188.9
180.4 |
145.2
136.4
126.9
115.5
100.8 |
104.1
97.7
84.6
73.9
65.0 |
0.0323%
0.0313%
0.0313%
0.0323%
0.0370% |
18.4
15.1
13.8
14.8
12.5 |
2.9
0.7
0.1
1.6
0.1 |
15.5
14.4
13.7
13.2
12.4 |
0.0
0.0
0.0
0.0
0.0 |
0
0
0
0
0 |
178.7
166.8
147.3
132.5
132.1 |
| 1959
1958 1957 1956 1955 |
136.5
126.8
117.3
111.9
105.8 |
178.2
166.8
159.3
155.5
151.5 |
99.6
93.0
90.2
87.3
85.4 |
57.9
53.0
48.2
43.7
39.7 |
0.0370%
0.0370%
0.0357%
0.0370%
0.0370% |
12.1
11.6
9.7
9.4
9.0 |
0.2
0.0
0.1
0.3
0.3 |
11.9
11.6
9.6
9.1
8.7 |
0.0
0.0
0.0
0.0
0.0 |
0
0
0
0
0 |
124.4
115.2
107.6
102.5
96.8 |
| 1954
1953 1952 1951 1950 |
99.7
94.2
88.6
83.5
84.8 |
144.2
138.7
131.0
124.3
122.9 |
81.8
78.5
73.7
70.0
68.7 |
37.3
34.0
31.3
29.2
30.6 |
0.0357%
0.0357%
0.0370%
0.0370%
0.0370% |
7.8
7.3
7.8
6.6
7.8 |
0.1
0.1
0.8
0.0
1.4 |
7.7
7.2
7.0
6.6
6.4 |
0.0
0.0
0.0
0.0
0.0 |
0
0
0
0
0 |
91.9
86.9
80.8
76.9
77.0 |
| 1949
1948 1947 1946 1945 |
151.1
145.6
157.5
130.7
121.0 |
122.7
119.3
114.4
107.0
93.7 |
0.0
0.0
0.0
0.0
0.0 |
28.4
26.3
43.1
23.7
27.3 |
0.0833%
0.0833%
0.0833%
0.0833%
0.0833% |
6.4
7.0
9.9
10.0
9.4 |
0.3
0.7
0.1
0.1
0.1 |
6.1
6.3 6
9.8
9.9
9.3 |
0.0
0.0
0.0
0.0
0.0 |
0
0
0
0
0 |
144.7
138.6
147.6
120.7
111.6 |
| 1944
1943 1942 1941 1940 |
99.3
86.6
69.1
62.0
55.9 |
80.9
70.0
56.5
51.4
46.2 |
0.0
0.0
0.0
0.0
0.0 |
18.4
16.6
12.6
10.6
9.7 |
0.0833%
0.0833%
0.0833%
0.0833%
0.0833% |
9.3
9.8
10.1
10.1
12.9
|
0.1
0.2
0.5
0.6
3.5 |
9.2
9.6
9.6
9.5
9.4 |
0.0
0.0
0.0
0.0
0.0 |
0
0
0
0
0 |
90.0
76.8
59.0
51.9
43.0 |
| 1939
1938 1937 1936 1935
1933-34 |
51.2
47.7
48.2
43.8
20.8
7.0 |
40.7
38.3
38.8
35.6
11.5
0.0 |
0.0
0.0
0.0
0.0
0.0
0.0
|
10.5
9.4
9.4
8.2
9.3
7.0 |
0.0833%
0.0833%
0.0833%
0.0833%
0.0833%
N/A |
16.4
11.3
12.2
10.9
11.3
10.0 |
7.2
2.5
3.7
2.6
2.8
0.2 |
9.2
8.8
8.5
8.3
8.5
9.8 |
0.0
0.0
0.0
0.0
0.0
0.0
|
0
0
0
0
0
0
|
34.8
36.4
36.0
32.9
9.5
(3.0)
|
- Figures represent only BIF-insured
institutions prior to 1990, BIF- and
SAIF-insured institutions from 1990 through 2005, and DIF-insured
institutions beginning in 2006. After 1995, all thrift closings became
the reponsibility of the FDIC and amounts are reflected in the SAIF.
The effective assessment rate is calculated from annual assessment
income (net of assessment credits), excluding transfers to the
Financing
Corporation (FICO), Resolution Funding Corporation (REFCORP) and FSLIC
Resolution Fund, divided by the four quarter average
assessment base. The effective rates from 1950 through 1984 varied from
the statutory rate of 0.0833 percent due to assessment credits provided
in those years. The statutory rate increased to 0.12 percent in 1990
and to a minimum of 0.15 percent in 1991. The effective rates in 1991
and
1992 varied because the FDIC exercised new authority to increase
assessments above the statutory minimum rate when needed. Beginning in
1993, the effective rate was based on a risk-related premium system
under which institutions paid assessments in the range of 0.23 percent
to
0.31 percent. In May 1995, the BIF reached the mandatory
recapitalization level of 1.25 percent. As a result, BIF assessment
rates were reduced
to a range of 0.04 percent to 0.31 percent of assessable deposits,
effective June 1995, and assessments totaling $1.5 billion were
refunded in
September 1995. Assessment rates for the BIF were lowered again to a
range of 0 to 0.27 percent of assessable deposits, effective the start
of
1996. In 1996, the SAIF collected a one-time special assessment of $4.5
billion. Subsequently, assessment rates for the SAIF were lowered
to the same range as the BIF, effective October 1996. This range of
rates remained unchanged for both funds through 2006. As part of the
implementation of the Federal Deposit Insurance Reform Act of 2005,
assessment rates were increased to a range of 0.05 percent to 0.43
percent
of assessable deposits effective at the start of 2007, but many
institutions received a one-time assessment credit ($4.7 billion in
total) to offset the
new assessments. On December 16, 2008, the FDIC Board of Directors (the
“Board”) adopted a final rule to temporarily increase assessment
rates for the first quarter of 2009 to a range of 0.12 percent to 0.50
percent of assessable deposits. On February 27, 2009, the Board adopted
a
final rule effective April 1, 2009, setting initial base assessment
rates to a range of 0.12 percent to 0.45 percent of assessable
deposits. On June
30, 2009, a special assessment was imposed on all insured banks and
thrifts, which amounted in aggregate to approximately $5.4 billion. For
8,106 institutions, with $9.3 trillion in assets, the special
assessment was 5 basis points of each institution’s assets minus tier
one capital; 89 other
institutions, with assets of $4.0 trillion, had their special
asssessment capped at 10 basis points of their second quarter
assessment base. back
- These expenses, which
are presented as operating expenses in the Statement of Income and Fund
Balance, pertain to the FDIC in its corporate
capacity only and do not include costs that are charged to the failed
bank receiverships that are managed by the FDIC. The receivership
expenses
are presented as part of the “Receivables from Resolutions, net” line
on the Balance Sheet. The narrative and graph presented in the
“Corporate
Planning and Budget” section of this report (page 132) show the
aggregate (corporate and receivership) expenditures of the FDIC. back
- Includes $210 million
for the cumulative effect of an accounting change for certain
postretirement benefits.back
- Includes a $106 million
net loss on government securities. back
- This amount represents
interest and other insurance expenses from 1933 to 1972. back
- Includes the aggregate
amount of $81 million of interest paid on capital stock between 1933
and 1948. back
Number, Assets, Deposits, Losses, and Loss To Funds of Insured
Thrifts Taken Over or Closed Because of Financial Difficulties,
1989 Through 19951
Dollars in Thousands
| Year
|
Total
|
Assets
|
Deposits
|
Estimated
Receivership
Loss2 |
Loss
to
Funds3 |
| Total |
748 |
$393,986,574
|
$317,501,978
|
$75,318,843
|
$81,580,645
|
1995
1994
1993
1992
1991
1990
1989 4 |
2
2
10
59
144
213
318 |
423,819
136,815
6,147,962
44,196,946
78,898,904
129,662,498
134,519,630 |
414,692
127,508
4,881,461
34,773,224
65,173,122
98,963,962
113,168,009 |
28,192
11,472
267,595
3,234,883
8,627,894
16,063,762
47,085,045 |
27,750
14,599
65,212
3,780,121
9,126,190
19,258,655
49,308,118 |
- Beginning in 1989 through July 1, 1995, all
thrift closings
were the responsibility of the Resolution Trust Corporation
(RTC). Since the RTC was terminated on December 31, 1995, and all
assets and liabilities transferred to the FSLIC
Resolution Fund (FRF), all the results of the thrift closing activity
from 1989 through 1995 are now reflected on FRF’s
books. Year is the year of failure, not the year of resolution. back
- The estimated losses
represent the projected loss at the fund level from receiverships for
unreimbursed subrogated claims
of the FRF and unpaid advances to receiverships from the FRF. back
- The Loss to Funds
represents the total resolution cost of the failed thrifts in the
FRF-RTC fund, which includes
corporate revenue and expense items such as interest expense on Federal
Financing Bank debt, interest expense on
escrowed funds, and interest revenue on advances to receiverships, in
addition to the estimated losses for receiverships. back
- Total for 1989 excludes
nine failures of the former FSLIC. back
FDIC-Insured Institutions Closed During 2010
Dollars in Thousands
| Name
and
Location |
Bank
Class
|
Number
of Deposit
Accounts
|
Total
Assets1
|
Total
Deposits1 |
Insured
Deposit Funding
and Other
Disbursements
|
Estimated
Loss to
the DIF2 |
Date
of
Closing or
Acquisition
|
Receiver/Assuming
Bank
and Location |
Purchase and Assumption - All Deposits
|
Bank of Leeton
Leeton, MO
|
NM
|
1,662
|
$20,128
|
$20,335
|
$20,091
|
$9,046
|
01/22/10
|
Sunflower Bank, N.A.
Salina, KS
|
Citizens Bank Trust Company of Chicago
Chicago, IL
|
NM
|
2,259
|
$73,490
|
$74,519 |
$71,552
|
$42,861
|
04/23/10
|
Republic Bank of Chicago
Oak Brook, IL
|
The Bank of Bonifay
Bonifay, FL
|
NM
|
10,577
|
$242,871
|
$230,190 |
$225,391
|
$78,605
|
05/07/10
|
First Federal Bank of Florida
Lake City, FL
|
Towne Bank of Arizona
Mesa, AZ
|
NM
|
1,018
|
$120,246
|
$113,243
|
$98,547
|
$44,096
|
05/07/10 |
Commerce Bank of Arizona
Tucson, AZ
|
First National Bank
Savannah, GA
|
N
|
3,856
|
$252,520
|
$231,857
|
$211,261
|
$93,989
|
06/25/10
|
The Savannah Bank, N.A.
Savannah, GA
|
The Gordon Bank
Gordon, GA
|
NM
|
2,548
|
$29,259
|
$26,867
|
$29,273
|
$8,882
|
10/22/10
|
Morris Bank
Dublin, GA
|
Whole Bank Purchase and Assumption - All Deposits
|
Horizon Bank
Bellingham, WA
|
NM
|
39,716
|
$1,188,956
|
$1,049,063
|
$1,040,135
|
$383,684
|
01/08/10
|
Washington FS&LA
Seattle, WA
|
St. Stephen State Bank
St. Stephen, MN
|
NM
|
2,347
|
$22,895
|
$23,912
|
$23,371
|
$12,197
|
01/15/10
|
First State Bank of St. Joseph
St. Joseph, MN
|
Town Community Bank & Trust
Antioch, IL
|
NM
|
1,717
|
$70,758
|
$68,323
|
$69,557
|
$26,642
|
01/15/10
|
First American Bank
Elk Grove Village, IL
|
Evergreen Bank
Seattle, WA
|
NM
|
11,116
|
$395,980
|
$340,378 |
$315,121
|
$109,168
|
01/22/10
|
Umpqua Bank
Roseburg, OR
|
Premier American Bank
Miami, FL
|
NM
|
4,865
|
$299,225
|
$285,554
|
$268,053
|
$112,344
|
01/22/10
|
Premier American Bank, N.A.
Miami, FL
|
Charter Bank
Santa Fe, NM
|
SB
|
19,945
|
$1,201,922
|
$859,933
|
$821,503
|
$246,120
|
01/22/10
|
Charter Bank
Albuquerque, NM
|
Columbia River Bank
The Dalles, OR
|
NM
|
49,744
|
$955,112
|
$908,132
|
$891,998
|
$167,875
|
01/22/10
|
Columbia State Bank
Tacoma, WA
|
First Regional Bank
Los Angeles, CA
|
NM
|
17,633
|
$2,082,684
|
$1,664,450
|
$1,540,091
|
$545,163
|
01/29/10
|
First-Citizens Bank & Trust Company
Raleigh, NC
|
American Marine Bank
Bainbridge Island, WA
|
NM
|
22,622
|
$329,246
|
$287,443
|
$269,735
|
$81,369
|
01/29/10
|
Columbia State Bank
Tacoma, WA
|
First National Bank of Georgia
Carrollton, GA
|
N
|
49,467
|
$840,633
|
$780,196
|
$751,253
|
$197,132
|
01/29/10
|
Community & Southern Bank
Carrollton, GA
|
Community Bank and Trust
Cornelia, GA
|
NM
|
99,016
|
$1,181,717
|
$1,067,957
|
$1,020,389 |
$363,060
|
01/29/10
|
SCBT, N.A.
Orangeburg, SC
|
Florida Community Bank
Immokalee, FL
|
NM
|
25,340
|
$835,701
|
$776,556
|
$794,414
|
$331,055
|
01/29/10
|
Premier American Bank, N.A.
Miami, FL |
Marshall Bank National Association
Hallock, MN
|
N
|
3,837
|
$58,566
|
$55,662
|
$49,297
|
$14,524
|
01/29/10
|
United Valley Bank
Cavalier, ND |
1st American State Bank of Minnesota
Hancock, MN
|
NM
|
1,375
|
$18,155
|
$16,327
|
$14,452
|
$5,042
|
02/05/10
|
Community Development
Bank, FSB
Ogema, MN
|
George Washington Savings Bank
Orland Park, IL
|
SI
|
15,015
|
$413,673
|
$395,310
|
$398,398
|
$91,528
|
02/19/10
|
FirstMerit Bank, N.A.
Akron, OH
|
La Jolla Bank, FSB
La Jolla, CA |
SB
|
43,243
|
$3,646,071
|
$2,799,362
|
$2,879,761
|
$1,035,182
|
02/19/10
|
OneWest Bank, FSB
Pasadena, CA
|
The La Coste National Bank
La Coste, TX |
N
|
3,052
|
$53,936
|
$49,275
|
$49,068
|
$3,684
|
02/19/10
|
Community National Bank
Hondo, TX
|
Marco Community Bank
Marco Island, FL
|
SM |
4,326
|
$119,578
|
$117,097
|
$120,435
|
$33,844
|
02/19/10
|
Mutual of Omaha Bank
Omaha, NE
|
Carson River Community Bank
Carson City, NV
|
NM
|
937 |
$51,095
|
$50,024
|
$51,024
|
$19,057 |
02/26/10
|
Heritage Bank of Nevada
Reno, NV
|
Rainier Pacific Bank
Tacoma, WA
|
SI
|
38,259
|
$717,806
|
$446,192
|
$429,154
|
$184,644
|
02/26/10
|
Umpqua Bank
Roseburg, OR
|
Bank of Illinois
Normal, IL
|
SM
|
8,050
|
$211,711
|
$198,487
|
$185,977
|
$41,856
|
03/05/10
|
Heartland Bank and Trust
Company
Bloomington, IL |
Sun American Bank
Boca Raton, FL
|
SM
|
9,845
|
$535,724
|
$443,481
|
$438,042
|
$149,588
|
03/05/10
|
First-Citizens Bank & Trust
Company
Raleigh, NC
|
LibertyPointe Bank
New York, NY
|
NM |
4,809
|
$216,500
|
$209,477
|
$198,442
|
$39,489
|
03/11/10
|
Valley National Bank
Wayne, NJ
|
The Park Avenue Bank
New York, NY
|
NM |
8,771
|
$520,146
|
$494,505
|
$477,584
|
$107,539
|
03/12/10
|
Valley National Bank
Wayne, NJ
|
Statewide Bank
Covington, LA
|
NM |
9,696
|
$243,215
|
$207,821
|
$206,074
|
$59,955
|
03/12/10
|
Home Bank
Lafayette, LA
|
Old Southern Bank
Orlando, FL
|
SM
|
6,110
|
$336,390
|
$319,746
|
$328,893
|
$87,984
|
03/12/10
|
Centennial Bank
Conway, AR
|
Century Security Bank
Duluth, GA
|
NM |
1,256 |
$96,535
|
$93,967
|
$95,230
|
$39,269
|
03/19/10 |
Bank of Upson
Thomaston, GA
|
Appalachian Community Bank
Ellijay, GA
|
NM |
40,289
|
$1,010,075
|
$917,575
|
$924,510
|
$309,652
|
03/19/10
|
Community & Southern Bank
Carrollton, GA
|
American National Bank
Parma, OH
|
N
|
1,173
|
$70,318
|
$66,752
|
$67,496 |
$26,511
|
03/19/10
|
The National Bank & Trust
Company
Wilmington, OH
|
Bank of Hiawassee
Hiawassee, GA
|
NM |
17,119
|
$377,779
|
$339,597
|
$329,792
|
$116,484
|
03/19/10 |
Citizens South Bank
Gastonia, NC
|
State Bank of Aurora
Aurora, MN
|
NM |
2,641
|
$27,801
|
$28,159
|
$26,502 |
$8,693
|
03/19/10
|
Northern State Bank
Ashland, WI
|
First Lowndes Bank
Fort Deposit, AL
|
NM |
8,621
|
$137,175
|
$131,117
|
$122,594
|
$35,314
|
03/19/10
|
First Citizens Bank
Luverne, AL
|
Desert Hills Bank
Phoenix, AZ
|
NM |
9,393
|
$496,552
|
$426,473
|
$410,763
|
$108,310 |
03/26/10
|
New York Community Bank
Westbury, NY
|
Key West Bank
Key West, FL
|
SB |
1,477
|
$88,031
|
$67,662 |
$76,254
|
$25,370
|
03/26/10
|
Centennial Bank
Conway, AR
|
McIntosh Commercial Bank
Carrollton, GA
|
NM |
7,785
|
$363,405
|
$343,339 |
$315,912
|
$141,844
|
03/26/10
|
CharterBank
West Point, GA
|
Unity National Bank
Cartersville, GA
|
N
|
13,028
|
$300,590
|
$264,286
|
$244,923
|
$70,961
|
03/26/10
|
Bank of the Ozarks
Little Rock, AR
|
Beach First National Bank
Myrtle Beach, SC
|
N |
12,329
|
$590,024
|
$516,026
|
$518,344
|
$119,396
|
04/09/10
|
Bank of North Carolina
Thomasville, NC
|
AmericanFirst Bank
Clermont, FL
|
NM
|
2,684
|
$104,034
|
$81,887
|
$92,563
|
$19,084
|
04/16/10
|
TD Bank, N.A.
Wilmington, DE
|
Butler Bank
Lowell, MA |
SI
|
8,010
|
$245,534
|
$233,222
|
$225,408
|
$27,738
|
04/16/10 |
People’s United Bank
Bridgeport, CT
|
City Bank
Lynwood, WA
|
NM
|
26,952
|
$981,913
|
$1,020,494
|
$903,819
|
$264,329
|
04/16/10
|
Whidbey Island Bank
Coupeville, WA
|
First Federal Bank of
North Florida
Palatka, FL
|
SB
|
16,768
|
$440,122
|
$324,198 |
$371,552
|
$13,095
|
04/16/10
|
TD Bank, N.A.
Wilmington, DE
|
Innovative Bank
Oakland, CA
|
NM
|
4,349 |
$266,816
|
$225,241
|
$211,111
|
$44,817
|
04/16/10
|
Center Bank
Los Angeles, CA |
Riverside National Bank of
Florida
Fort Pierce, FL
|
N
|
235,048
|
$3,393,818
|
$2,724,623
|
$2,861,518
|
$605,501
|
04/16/10
|
TD Bank, N.A.
Wilmington, DE
|
Tamalpais Bank
San Rafael, CA
|
NM
|
12,006
|
$611,504
|
$487,582
|
$462,814
|
$76,525
|
04/16/10
|
Union Bank, N.A.
San Francisco, CA
|
Amcore Bank, N.A.
Rockford, IL
|
N
|
154,667
|
$3,066,240
|
$3,421,194
|
$2,774,842
|
$320,947
|
04/23/10
|
Harris National Association
Chicago, IL
|
Broadway Bank
Chicago, IL
|
NM |
8,086
|
$1,059,194
|
$1,113,959
|
$1,021,203
|
$391,357
|
04/23/10
|
MB Financial Bank, N.A.
Chicago, IL
|
Lincoln Park Savings Bank
Chicago,IL
|
SI
|
11,153
|
$194,618
|
$162,627
|
$162,662
|
$52,020
|
04/23/10
|
Northbrook Bank and Trust Company
Northbrook, IL
|
New Century Bank
Chicago, IL
|
NM
|
6,612
|
$447,239
|
$492,046
|
$427,045
|
$125,868
|
04/23/10
|
MB Financial Bank, N.A.
Chicago, IL
|
Peotone Bank and Trust
Company
Peotone, IL
|
NM
|
8,405 |
$130,165
|
$124,676
|
$124,317
|
$46,514
|
04/23/10
|
First Midwest Bank
Itasca, IL
|
Wheatland Bank
Naperville, IL
|
NM
|
8,011 |
$441,694
|
$438,502
|
$445,153
|
$136,915
|
04/23/10
|
Wheaton Bank and Trust
Wheaton, IL |
BC National Bank
Butler, MO
|
N
|
3,382
|
$52,204
|
$43,635
|
$40,180
|
$15,798
|
04/30/10
|
Community First Bank
Butler, MO
|
CF Bancorp
Port Huron, MI |
SI
|
73,727
|
$1,599,122
|
$1,418,445 |
$1,732,557
|
$487,779
|
04/30/10
|
First Michigan Bank
Troy, MI
|
Champion Bank
Creve Coeur, MO
|
NM
|
4,242
|
$195,510
|
$153,763
|
$160,292
|
$68,999
|
04/30/10
|
BankLiberty
Liberty, MO
|
Frontier Bank
Everett, WA
|
NM |
96,539 |
$3,250,734
|
$2,846,886
|
$2,759,290
|
$1,096,211 |
04/30/10
|
Union Bank, N.A.
San Francisco, CA
|
Eurobank
San Juan, PR |
NM |
23,521
|
$2,453,138
|
$1,970,724 |
$2,313,651
|
$1,187,775
|
04/30/10 |
Oriental Bank and Trust
San Juan, PR
|
R-G Premier Bank of Puerto
Rico
Hato Rey, PR
|
NM
|
325,495 |
$5,681,177
|
$4,220,108
|
$5,496,730
|
$1,455,166
|
04/30/10
|
Scotiabank de Puerto Rico
San Juan, PR |
Westernbank Puerto Rico
Mayaguez, PR
|
NM
|
302,338
|
$10,797,345
|
$8,619,969
|
$10,274,407
|
$4,249,644
|
04/30/10 |
Banco Popular de Puerto
Rico
San Juan, PR
|
1st Pacific Bank of
California
San Diego, CA
|
SM
|
4,299
|
$335,798
|
$291,173
|
$267,981
|
$80,457
|
05/07/10
|
City National Bank
Los Angeles, CA
|
Access Bank
Champlin, MN
|
NM
|
1,602
|
$31,996
|
$31,969
|
$29,681
|
$8,644
|
05/07/10 |
Prinsbank
Prinsburg, MN
|
Midwest Bank and Trust
Company
Elmwood Park, IL
|
SM
|
78,283
|
$3,172,915
|
$2,420,738
|
$2,265,630
|
$221,301
|
05/14/10 |
FirstMerit Bank, N.A.
Akron, OH
|
New Liberty Bank
Plymouth, MI
|
NM
|
3,125
|
$111,239
|
$101,884
|
$99,290
|
$28,640
|
05/14/10 |
Bank of Ann Arbor
Ann Arbor, MI
|
Satilla Community Bank
Saint Marys, GA
|
NM
|
2,348
|
$135,688
|
$134,005
|
$122,425
|
$32,822
|
05/14/10
|
Ameris Bank
Moultrie, GA
|
Southwest Community Bank
Springfield, MO
|
NM |
1,505
|
$100,659
|
$102,463
|
$97,449
|
$32,114
|
05/14/10
|
Simmons First National Bank
Pine Bluff, AR
|
Pinehurst Bank
St. Paul, MN
|
NM |
1,597
|
$61,215
|
$58,288
|
$54,630
|
$11,474
|
05/21/10
|
Coulee Bank
La Crosse, WI
|
Bank of Florida–Southeast
Ft. Lauderdale, FL
|
NM |
7,333
|
$595,318
|
$531,752
|
$477,614
|
$77,586
|
05/28/10
|
Everbank
Jacksonville, FL
|
Bank of Florida–Southwest
Naples, FL
|
NM |
11,061
|
$640,894
|
$559,897
|
$567,536
|
$106,905
|
05/28/10
|
Everbank
Jacksonville, FL
|
Bank of Florida–Tampa Bay
Tampa, FL
|
NM |
2,628
|
$240,513
|
$224,024
|
$244,489
|
$40,273
|
05/28/10
|
Everbank
Jacksonville, FL
|
Granite Community Bank
Granite Bay, CA
|
N
|
2,920
|
$102,913
|
$94,252
|
$94,825
|
$21,447
|
05/28/10
|
Tri Counties Bank
Chico, CA
|
Sun West Bank
Las Vegas, NV
|
NM |
6,753
|
$360,662
|
$353,943
|
$331,949
|
$96,693
|
05/28/10
|
City National Bank
Los Angeles, CA
|
First National Bank
Rosedale, MS
|
N
|
2,122
|
$60,449
|
$63,483
|
$72,828
|
$25,123
|
06/04/10
|
The Jefferson Bank
Fayette, MS
|
TierOne Bank
Lincoln, NE
|
SB
|
176,888
|
$2,824,737
|
$2,185,817
|
$1,897,433
|
$313,755
|
06/04/10
|
Great Western Bank
Sioux Falls, SD
|
Washington First International Bank
Seattle, WA
|
NM
|
10,035
|
$520,887
|
$441,362
|
$396,237
|
$136,118
|
06/11/10
|
East West Bank
Pasadena, CA
|
Nevada Security Bank
Reno, NV
|
NM |
9,846
|
$492,491
|
$479,759
|
$475,638
|
$87,810
|
06/18/10
|
Umpqua Bank
Roseburg, OR |
High Desert State Bank
Albuquerque, NM
|
NM |
2,026
|
$80,343
|
$80,985
|
$73,025
|
$24,829
|
06/25/10
|
First American Bank
Artesia, NM
|
Peninsula Bank
Englewood, FL
|
NM |
13,339
|
$630,179
|
$580,140
|
$605,285
|
$226,929
|
06/25/10
|
Premier American Bank
Miami, FL
|
USA Bank
Port Chester, NY
|
NM |
2,985
|
$190,678
|
$188,644
|
$190,006
|
$65,243
|
07/09/10
|
New Century Bank
Phoenixville, PA
|
Bay National Bank
Lutherville, MD
|
N
|
2,661
|
$217,743
|
$212,612
|
$205,167
|
$23,368
|
07/09/10
|
Bay Bank, FSB
Lutherville, MD
|
Home National Bank
Blackwell, OK
|
N
|
25,726
|
$585,445
|
$514,038
|
$512,769
|
$83,213
|
07/09/10
|
RCB Bank
Claremore, OK
|
Mainstreet Savings Bank, FSB
Hastings, MI
|
SB
|
8,132
|
$96,584
|
$63,291
|
$62,759
|
$15,690
|
07/16/10
|
Commercial Bank
Alma, MI
|
Metro Bank of Dade County
Miami, FL
|
SM
|
8,766
|
$399,441
|
$375,522
|
$369,253
|
$75,556 |
07/16/10
|
NAFH National Bank
Miami, FL
|
Olde Cypress Community Bank
Clewiston, FL
|
SB
|
8,110
|
$161,355
|
$157,997
|
$160,183
|
$38,643
|
07/16/10 |
CenterState Bank of
Florida, N.A.
Winter Haven, FL
|
Turnberry Bank
Aventura, FL
|
SB |
3,888
|
$240,250
|
$179,169
|
$177,459
|
$40,535
|
07/16/10
|
NAFH National Bank
Miami, FL
|
Woodlands Bank
Bluffton, SC
|
SB |
6,554
|
$382,803
|
$364,808
|
$360,454
|
$120,068
|
07/16/10
|
Bank of the Ozarks
Little Rock, AR
|
First National Bank of the South
Spartanburg, SC
|
N
|
20,097
|
$619,374
|
$550,891
|
$540,575
|
$83,037
|
07/16/10
|
NAFH National Bank
Miami, FL
|
Community Security Bank
New Prague, MN
|
NM
|
4,984
|
$100,649
|
$95,100
|
$94,987
|
$21,438
|
07/23/10
|
Roundbank
Waseca, MN
|
Crescent Bank & Trust Company
Jasper, GA
|
NM
|
28,701
|
$970,235
|
$932,809
|
$918,107
|
$279,759
|
07/23/10
|
Renasant Bank
Tupelo, MS
|
Home Valley Bank
Cave Junction, OR
|
SM
|
13,230
|
$250,488
|
$227,935
|
$227,449
|
$44,651
|
07/23/10
|
South Valley Bank & Trust
Klamath Falls, OR
|
Southwest USA Bank
Las Vegas, NV
|
NM
|
2,068
|
$203,690
|
$183,985
|
$178,885
|
$79,904
|
07/23/10
|
Plaza Bank
Irvine, CA
|
Sterling Bank
Lantana, FL
|
SM
|
7,533
|
$354,966
|
$329,541
|
$317,657
|
$54,119
|
07/23/10
|
IBERIABANK
Lafayette, LA
|
Thunder Bank
Sylvan Grove, KS
|
SM
|
1,454 |
$28,248
|
$27,048
|
$25,813
|
$8,007
|
07/23/10
|
The Bennington State Bank
Salina, KS |
Williamsburg First National Bank
Kingstree, SC
|
N
|
8,801
|
$130,411
|
$126,993
|
$117,906
|
$10,103
|
07/23/10
|
First Citizens Bank and Trust
Company, Inc.
Columbia, SC
|
Bayside Savings Bank
Port Saint Joe, FL
|
SB
|
2,191
|
$64,344
|
$52,720
|
$49,891
|
$19,966
|
07/30/10
|
Centennial Bank
Conway, AR
|
Coastal Community Bank
Panama City Beach, FL
|
NM
|
12,152
|
$377,469
|
$370,016
|
$372,707
|
$106,767
|
07/30/10
|
Centennial Bank
Conway, AR
|
Liberty Bank
Eugene, OR
|
NM |
30,465
|
$714,574
|
$692,670
|
$679,600
|
$200,197
|
07/30/10
|
Home Federal Bank
Nampa, ID
|
NorthWest Bank and Trust
Acworth, GA
|
NM |
3,861 |
$160,763
|
$155,531
|
$152,916
|
$39,380
|
07/30/10
|
State Bank and Trust Company
Macon, GA
|
The Cowlitz Bank
Longview, WA
|
NM |
10,709
|
$489,019
|
$474,742
|
$448,186
|
$82,180
|
07/30/10
|
Heritage Bank
Olympia, WA
|
Ravenswood Bank
Chicago, IL
|
NM |
4,472
|
$264,628
|
$269,448
|
$265,043
|
$104,994
|
08/06/10
|
Northbrook Bank and
Trust Company
Northbrook, IL
|
Palos Bank and Trust Company
Palos Heights, IL
|
NM |
26,165
|
$493,391
|
$467,784
|
$462,086
|
$86,611
|
08/13/10
|
First Midwest Bank
Itasca, IL
|
Butte Community Bank
Chico, CA
|
NM |
45,195
|
$498,751
|
$471,256
|
$461,309
|
$34,729
|
08/20/10
|
Rabobank, N.A.
El Centro, CA
|
Community National Bank at Bartow
Bartow, FL
|
N |
2,804
|
$67,918 |
$63,708
|
$60,308
|
$15,429
|
08/20/10
|
CenterState Bank of Florida, N.A.
Winter Haven, FL
|
Imperial Savings & Loan Association
Martinsville, VA
|
SB |
1,363
|
$9,448
|
$10,090
|
$9,374
|
$5,062
|
08/20/10
|
River Community Bank, N.A.
Martinsville, VA
|
Independent National Bank
Ocala, FL
|
N
|
10,146
|
$156,218
|
$141,877
|
$143,569
|
$32,403 |
08/20/10
|
CenterState Bank of Florida, N.A.
Winter Haven, FL
|
Los Padres Bank
Solvang, CA
|
SB
|
22,198
|
$866,459
|
$770,899
|
$754,140
|
$120,143
|
08/20/10
|
Pacific Western Bank
San Diego, CA
|
Pacific State Bank
Stockton, CA
|
SM
|
9,957
|
$312,077
|
$278,832
|
$254,769
|
$38,909
|
08/20/10
|
Rabobank, N.A.
El Centro, CA
|
ShoreBank
Chicago, IL
|
NM |
39,039
|
$2,166,431
|
$1,547,403
|
$2,147,161
|
$570,625
|
08/20/10
|
Urban Partnership Bank
Chicago, IL
|
Sonoma Valley Bank
Sonoma, CA
|
NM
|
12,728
|
$337,113
|
$255,501
|
$251,413
|
$19,076
|
08/20/10
|
Westamerica Bank
San Rafael, CA
|
Horizon Bank
Bradenton, FL
|
SM
|
6,284
|
$187,819
|
$164,594
|
$162,893
|
$68,863
|
09/10/10
|
Bank of the Ozarks
Little Rock, AR
|
Bank of Ellijay
Ellijay, GA
|
NM
|
4,524
|
$168,820
|
$160,718
|
$172,102
|
$60,270
|
09/17/10
|
Community & Southern Bank
Carrollton, GA
|
Bramble Savings Bank
Milford, OH
|
SI
|
1,936
|
$47,523
|
$41,551
|
$41,548
|
$17,588
|
09/17/10
|
Foundation Bank
Cincinnati, OH
|
First Commerce Community Bank
Douglasville, GA
|
NM |
4,173
|
$248,151
|
$242,831
|
$228,416
|
$77,233
|
09/17/10
|
Community & Southern Bank
Carrollton, GA
|
ISN Bank
Cherry Hill, NJ
|
NM
|
1,106
|
$81,564
|
$79,652
|
$76,930
|
$27,799
|
09/17/10
|
New Century Bank
Phoenixville, PA
|
Maritime Savings Bank
West Allis, WI
|
SB |
12,973
|
$350,488
|
$248,134
|
$344,476
|
$105,372
|
09/17/10
|
North Shore Bank, FSB
Brookfield, WI
|
The Peoples Bank
Winder, GA
|
NM
|
24,437
|
$447,185
|
$398,181
|
$373,755
|
$100,169
|
09/17/10
|
Community & Southern Bank
Carrollton, GA
|
Haven Trust Bank Florida
Ponte Vedra Beach, FL
|
NM
|
2,223
|
$148,575
|
$133,561
|
$130,909 |
$36,793
|
09/24/10
|
First Southern Bank
Boca Raton, FL
|
North County Bank
Arlington, WA
|
NM
|
7,602
|
$288,776
|
$276,081
|
$258,513 |
$80,531
|
09/24/10
|
Whidbey Island Bank
Coupeville, WA
|
Shoreline Bank
Shoreline, WA
|
NM
|
4,649
|
$92,980
|
$90,644
|
$90,930
|
$40,381
|
10/01/10
|
GBC International Bank
Los Angeles, CA
|
Wakulla Bank
Crawfordville, FL
|
NM
|
26,383
|
$402,205
|
$367,228
|
$394,803
|
$109,487
|
10/01/10
|
Centennial Bank
Conway, AR
|
Premier Bank
Jefferson City, MO
|
NM |
28,804
|
$989,382
|
$869,367
|
$965,935
|
$404,596
|
10/15/10
|
Providence Bank
Columbia, MO
|
Security Savings Bank
Olathe, KS
|
SA
|
18,336
|
$453,349
|
$347,080
|
$339,787 |
$80,362
|
10/15/10
|
Simmons First National Bank
Pine Bluff, AR
|
Westbridge Bank and Trust
Chesterfield, MO
|
NM
|
1,261
|
$87,782
|
$70,131
|
$67,242
|
$18,588
|
10/15/10
|
Midland States Bank
Effingham, IL
|
First Bank of Jacksonville
Jacksonville, FL
|
NM
|
1,814
|
$73,922
|
$72,198
|
$72,037
|
$16,098
|
10/22/10
|
Ameris Bank
Moultrie, GA
|
First Suburban National Bank
Maywood, IL
|
N |
6,482
|
$143,451
|
$135,475
|
$137,665
|
$28,974
|
10/22/10
|
Seaway Bank and Trust
Company
Chicago, IL
|
Hillcrest Bank
Overland Park, KS
|
NM
|
38,922
|
$1,583,611
|
$1,488,785
|
$1,476,695
|
$318,195
|
10/22/10
|
Hillcrest Bank, N.A.
Overland Park, KS
|
Progress Bank of Florida
Tampa, FL
|
SM
|
1,882
|
$94,823
|
$86,861
|
$85,294
|
$24,996
|
10/22/10
|
Bay Cities Bank
Tampa, FL
|
The First National Bank of Barnesville
Barnesville, GA
|
N
|
6,835
|
$126,622
|
$122,880
|
$123,943
|
$32,885
|
10/22/10
|
United Bank
Zebulon, GA
|
First Vietnamese American Bank
Westminster, CA
|
NM
|
721
|
$48,000
|
$47,012
|
$38,028
|
$9,635
|
11/05/10
|
Grandpoint Bank
Los Angeles, CA
|
K Bank
Randallstown, MD
|
NM
|
23,944
|
$538,258
|
$500,056
|
$498,567
|
$196,706
|
11/05/10
|
Manufacturers & Traders Trust Co. (M&T Bank)
Buffalo, NY
|
Pierce Commercial Bank
Tacoma, WA
|
SM
|
3,356
|
$221,082
|
$193,473
|
$181,310
|
$19,814 |
11/05/10
|
Heritage Bank
Olympia, WA
|
Western Commercial Bank
Woodland Hills, CA
|
NM
|
1,241
|
$98,635
|
$101,127
|
$105,176
|
$24,310
|
11/05/10
|
First California Bank
Westlake Village, CA
|
Cooper Star Bank
Scottsdale, AZ
|
NM
|
3,321
|
$203,955
|
$190,182
|
$194,655
|
$43,169
|
11/12/10
|
Stearns Bank, N.A.
St. Cloud, MN
|
Darby Bank & Trust Co.
Vidalia, GA
|
NM
|
19,886
|
$654,714
|
$587,626
|
$582,144
|
$129,590
|
11/12/10
|
Ameris Bank
Moultrie, GA
|
Tifton Banking Company
Tifton, GA
|
NM
|
2,685
|
$143,729
|
$141,573
|
$132,992 |
$24,576 |
11/12/10
|
Ameris Bank
Moultrie, GA
|
Allegiance Bank of America
Bala Cynwyd, PA
|
NM
|
2,765
|
$106,595
|
$91,996
|
$96,741
|
$14,235
|
11/19/10
|
VIST Bank
Wyomissing, PA
|
First Banking Center
Burlington, WI
|
SM
|
44,356
|
$750,724
|
$664,752
|
$676,743
|
$139,746
|
11/19/10
|
First Michigan Bank
Troy, MI
|
Gulf State Community Bank
Carrabelle, FL
|
NM
|
7,338
|
$112,144 |
$112,193 |
$108,568
|
$42,279
|
11/19/10
|
Centennial Bank
Conway, AR
|
Earthstar Bank
Southhampton, PA
|
NM
|
4,313
|
$112,643 |
$104,505
|
$98,170
|
$22,926
|
12/10/10
|
Polonia Bank
Huntingdon Valley, PA
|
Paramount Bank
Farmington Hills, MI
|
SM
|
4,725
|
$252,744 |
$213,550 |
$187,403 |
$89,354
|
12/10/10
|
Level One Bank
Farmington Hills, MI
|
Appalachian Community
Bank, F.S.B.
McCaysville, GA
|
SA
|
2,639
|
$68,201
|
$76,360 |
$68,552
|
$25,876
|
12/17/10
|
Peoples Bank of
East Tennessee
Madisonville, TN
|
Chestatee State Bank
Dawsonville, GA
|
NM
|
10,740
|
$244,376
|
$244,476
|
$234,908
|
$75,136
|
12/17/10
|
Bank of the Ozarks
Little Rock, AR
|
Community National Bank
Lino Lakes, MN
|
N
|
2,604
|
$31,569
|
$28,916
|
$27,269
|
$3,717
|
12/17/10
|
Farmers & Merchants
Savings Bank
Manchester, IA
|
First Southern Bank
Batesville, AR
|
NM
|
3,746
|
$191,764
|
$172,514
|
$141,827
|
$22,751
|
12/17/10
|
Southern Bank
Poplar Bluff, MO
|
United Americas Bank, N.A.
Atlanta, GA
|
N
|
3,851
|
$242,339 |
$244,172
|
$198,466
|
$75,294
|
12/17/10
|
State Bank and Trust
Company
Macon, GA
|
The Bank of Miami
Coral Gables, FL
|
N
|
3,595
|
$448,150 |
$374,218
|
$344,755
|
$59,267
|
12/17/10
|
1st United Bank
Boca Raton, FL
|
Insured
Deposit Transfer |
Barnes Banking Company
Kaysville, UT
|
SM |
31,597
|
$709,171
|
$697,109
|
$660,026
|
$207,813
|
01/15/10
|
Deposit Insurance National
Bank
of Kaysville
Kaysville, UT
|
Insured Deposit Payoff |
Centennial Bank
Ogden, UT
|
NM
|
3,809
|
$212,839
|
$205,076 |
$222,567
|
$78,843
|
03/05/10
|
Federal Deposit Insurance
Corporation
|
Advanta Bank Corp.
Draper, UT
|
NM
|
1,920
|
$1,525,931
|
$1,519,471
|
$1,335,574
|
$606,732 |
03/19/10
|
Federal Deposit Insurance
Corporation
|
Lakeside Community Bank
Sterling Heights, MI
|
NM
|
1,920
|
$49,173
|
$52,290
|
$58,990
|
$21,471
|
04/16/10 |
Federal Deposit Insurance
Corporation
|
Arcola Homestead Savings
Bank
Arcola, IL
|
SI
|
613
|
$17,028
|
$18,092
|
$17,115 |
$10,829
|
06/04/10
|
Federal Deposit Insurance
Corporation |
Ideal Federal Savings Bank
Baltimore, MD
|
SB
|
807
|
$6,177 |
$5,803
|
$5,378
|
$5,370
|
07/09/10
|
Federal Deposit Insurance
Corporation
|
| First Arizona Savings, FSB
Scottsdale, AZ |
SA |
11,574 |
$255,920 |
$190,615 |
$265,711 |
$32,316 |
10/22/10 |
Federal Deposit Insurance
Corporation |
Insured
Deposit
Transfer/Purchase
&
Assumption |
| Waterfield Bank
Germantown, MD |
SB |
5,987 |
$155,566 |
$156,188 |
$562,273 |
$41,733 |
03/05/10 |
Federal Deposit Insurance
Corporation |
Codes for Bank Class:
NM = State-chartered bank
that is not a member of the Federal Reserve
System
N = National Bank
SB = Savings Bank
SI = Stock and Mutual Savings
Bank
SM = State-chartered bank that is a member of the Federal Reserve
System
SA = Savings Association
- Total Assets and Total Deposits data is based
upon the last Call Report
filed by the institution prior to failure. Estimated losses are as of
12/31/10. back
- Estimated losses are routinely
adjusted with updated information from new appraisals and asset sales,
which
ultimately affect the asset values and projected recoveries. Represents
the estimated loss to the DIF from deposit insurance obligations. This
amount does not include the estimated loss allocable to the Transaction
Account Guarantee claim. back
Recoveries and Losses by the Deposit Insurance Fund on
Disbursements for the Protection of Depositors, 1934 – 2010
Dollars in Thousands
Bank and Thrift Failures 1
|
| Year 2 |
Number
of
Banks/
Thrifts |
Total
Assets
3 |
Total
Deposits
3 |
Insured
Deposit
Funding
and Other
Disbursements |
Recoveries |
Estimated
Additional
Recoveries |
Estimated
Losses |
|
2,417 |
$879,080,555
|
$653,997,204
|
$529,207,216
|
$381,767,253
|
$31,024,200
|
$116,415,763
|
20104
20094
20084
20074
20064
20054 |
157
140
25
3
0
0 |
92,084,987 169,709,160
371,945,480 2,614,928
0
0 |
79,548,141 137,067,132
234,321,715 2,424,187
0
0 |
82,015,397
135,769,886
205,407,426
1,914,177
0
0 |
45,848,906 82,055,693
181,587,856 1,364,131
0
0 |
11,342,867 14,902,675
4,199,157 365,827
0
0 |
24,823,624
38,811,518
19,620,413
184,219
0
0 |
2004
2003
2002
2001
2000 |
4
3
11
4
7 |
170,099
947,317
2,872,720
1,821,760
410,160 |
156,733
901,978
2,512,834
1,661,214
342,584 |
138,895
883,772
2,126,922
1,605,147
297,313 |
134,978
812,933
1,689,034
1,128,577
265,175 |
0
8,192
14,415
166,110
0 |
3,917
62,647
423,473
310,460
32,138 |
1999
1998
1997
1996
1995 |
8
3
1
6
6 |
1,592,189
290,238
27,923
232,634
802,124 |
1,320,573
260,675
27,511
230,390
776,387 |
1,307,045
292,678
25,546
201,533
609,043 |
685,154
58,248
20,520
140,918
524,571 |
7,557
11,600
0
0
0 |
614,334
222,830
5,026
60,615
84,472 |
1994
1993
1992
1991
1990 |
13
41
120
124
168 |
1,463,874
3,828,939
45,357,237
64,556,512 16,923,462 |
1,397,018
3,509,341
39,921,310
52,972,034
15,124,454 |
1,224,769
3,841,658
14,540,771
21,499,236
10,812,484 |
1,045,718
3,209,012
10,866,745
15,500,130
8,040,995 |
0
0
14
5,786
0 |
179,051
632,646
3,674,012
5,993,320
2,771,489 |
1989
1988
1987
1986
1985 |
206
200
184
138
116 |
28,930,572
38,402,475
6,928,889
7,356,544
3,090,897 |
24,152,468
26,524,014
6,599,180
6,638,903
2,889,801 |
11,443,281
10,432,655
4,876,994
4,632,121
2,154,955 |
5,247,995
5,055,158
3,014,502
2,949,583
1,506,776 |
0
0
0
0
0 |
6,195,286
5,377,497
1,862,492
1,682,538
648,179 |
1984
1983
1982
1981
1980 |
78
44
32
7
10 |
2,962,179
3,580,132
1,213,316
108,749
239,316 |
2,665,797
2,832,184
1,056,483
100,154
219,890 |
2,165,036
3,042,392
545,612
114,944
152,355 |
1,641,157
1,973,037
419,825
105,956
121,675 |
0
0
0
0
0 |
523,879
1,069,355
125,787
8,988
30,680 |
| 1934-1979
|
558 |
8,615,743 |
5,842,119 |
5,133,173 |
4,752,295 |
0 |
380,878 |
| Assistance
Transactions |
| Year 2 |
Number
of
Banks/
Thrifts |
Total
Assets 3 |
Total
Deposits 3 |
Insured
Deposit
Funding
and Other
Disbursements |
Recoveries |
Estimated
Additional
Recoveries |
Estimated
Losses |
|
154 |
$3,317,099,253 |
$1,442,173,417 |
$11,630,356 |
$6,199,875 |
$0 |
$5,430,481 |
2010 5
2009 5
2008 5
2007
2006
2005 |
0
8
5
0
0
0 |
0
1,917,482,183
1,306,041,994
0
0
0 |
0
1,090,318,282
280,806,966
0
0
0 |
0
0
0
0
0
0 |
0
0
0
0
0
0 |
0
0
0
0
0
0 |
0
0
0
0
0
0 |
2004
2003
2002
2001
2000 |
0
0
0
0
0 |
0
0
0
0
0 |
0
0
0
0
0 |
0
0
0
0
0 |
0
0
0
0
0 |
0
0
0
0
0 |
0
0
0
0
0 |
1999
1998
1997
1996
1995 |
0
0
0
0
0 |
0
0
0
0
0 |
0
0
0
0
0 |
0
0
0
0
0 |
0
0
0
0
0 |
0
0
0
0
0 |
0
0
0
0
0 |
1994
1993
1992
1991
1990 |
0
0
2
3
1 |
0
0
33,831
78,524
14,206 |
0
0
33,117
75,720
14,628 |
0
0
1,486
6,117
4,935 |
0
0
1,236
3,093
2,597 |
0
0
0
0
0 |
0
0
250
3,024
2,338 |
1989
1988
1987
1986
1985 |
1
80
19
7
4 |
4,438
15,493,939
2,478,124
712,558
5,886,381 |
6,396
11,793,702
2,275,642
585,248
5,580,359 |
2,548
1,730,351
160,877
158,848
765,732 |
252
189,709
713
65,669
406,676 |
0
0
0
0
0 |
2,296
1,540,642
160,164
93,179
359,056 |
1984
1983
1982
1981
1980 |
2
4
10
3
1 |
40,470,332
3,611,549
10,509,286
4,838,612
7,953,042 |
29,088,247
3,011,406
9,118,382
3,914,268
5,001,755 |
5,531,179
764,690
1,729,538
774,055
0 |
4,414,904
427,007
686,754
1,265
0 |
0
0
0
0
0 |
1,116,275
337,683
1,042,784
772,790
0 |
| 1934-1979 |
4 |
1,490,254 |
549,299 |
0 |
0 |
0 |
0 |
- Institutions closed
by
the
FDIC,
including
deposit
payoff,
insured
deposit
transfer,
and
deposit
assumption
cases.
- For 1990
through
2005,
amounts
represent
the
sum
of
BIF
and
SAIF failures (excluding those
handled by the RTC); prior to 1990, figures are
only for the BIF. After 1995, all thrift closings became the
responsibility of the FDIC and amounts are reflected in the SAIF. For
2006 to 2010,
figures are for the DIF.
- Assets and
deposit
data
are
based
on
the
last
Call
Report
or TFR filed before failure.
- Includes amounts
related
to
transaction
account
coverage
under
the
Transaction
Account
Guarantee
Program (TAG). The estimated losses as of
12/31/10 for TAG accounts in 2010, 2009, and 2008 are $643 million,
$1,689 million, and $16 million, respectively.
- Includes institutions
where
assistance
was
provided
under
a
systemic
risk
determination.
Any
costs
that
exceed
the
amounts
estimated
under
the
least
cost
resolution
requirement
would
be
recovered
through
a
special assessment on all FDIC-insured institutions.
FDIC Actions on Financial Institutions Applications 2008 –
2010
|
2010
|
2009
|
2008
|
| Deposit Insurance
|
16 |
19 |
123
|
| Approved
1 |
16 |
19 |
123 |
| Denied |
0 |
0 |
0 |
| New Branches |
461 |
521 |
1,012 |
| Approved |
459 |
521 |
1,012 |
| Denied |
2 |
0 |
0 |
| Mergers |
182 |
190 |
275 |
| Approved |
182 |
190 |
275 |
| Denied |
0 |
0 |
0 |
| Requests
for Consent to Serve2 |
840 |
503 |
283 |
| Approved |
840 |
503 |
283 |
| Section 19 |
10 |
20 |
8 |
| Section 32 |
830 |
483 |
275 |
| Denied |
0 |
0 |
0 |
| Section 19 |
0 |
0 |
0 |
| Section 32 |
0 |
0 |
0 |
| Notices of
Change in Control |
33 |
18 |
28 |
| Letters of Intent Not to Disapprove |
33 |
18 |
28 |
| Disapproved |
0 |
0 |
0 |
| Brokered Deposit Waivers |
67 |
35 |
38 |
| Approved |
66 |
34 |
38 |
| Denied |
1 |
1 |
0 |
| Savings Association Activities
3 |
31 |
39 |
45 |
| Approved |
31 |
39 |
45 |
| Denied |
0 |
0 |
0 |
| State Bank Activities/Investments 4 |
3 |
2 |
11 |
| Approved |
3 |
2 |
11 |
| Denied |
0 |
0 |
0 |
| Conversion of Mutual Institutions |
2 |
6 |
10 |
| Non-Objection
Objection |
2 |
6 |
10 |
| Objection |
0 |
0 |
0 |
- Includes deposit insurance applications
filed on behalf of: (1) newly
organized institutions, (2) existing uninsured
financial services companies seeking establishment as an insured
institution, and (3) interim institutions established to
facilitate merger or conversion transactions, and applications to
facilitate the establishment of thrift holding companies. back
- Under Section 19 of the
Federal Deposit Insurance (FDI) Act, an insured institution must
receive FDIC approval
before employing a person convicted of dishonesty or breach of trust.
Under Section 32, the FDIC must approve
any change of directors or senior executive officers at a state
non-member bank that is not in compliance with capital
requirements or is otherwise in troubled condition. back
- Amendments to Part 303
of the FDIC Rules and Regulations changed FDIC oversight responsibility
in October 1998.
In 1998, Part 303 changed the Delegations of Authority to act upon
applications. back
- Section 24 of the FDI
Act, in general, precludes a federally-insured state bank from engaging
in an activity not
permissible for a national bank and requires notices to be filed with
the FDIC. back
Compliance, Enforcement, and Other Related Legal Actions 2008
– 2010
|
|
2010
|
2009
|
2008
|
Total Number of Actions
Initiated by the FDIC
|
758
|
551
|
758
|
| Termination of Insurance |
|
|
|
| Involuntary Termination |
|
|
|
| Sec. 8a For Violations, Unsafe/Unsound
Practices or Conditions |
0 |
0 |
0 |
| Voluntary Termination |
|
|
|
| Sec. 8a By Order Upon Request |
0 |
0 |
1 |
| Sec. 8p No Deposits |
4 |
4 |
2 |
| Sec. 8q Deposits
Assumed |
1 |
2 |
1 |
| Sec. 8b Cease-and-Desist Actions |
|
|
|
| Notices of Charges Issued 1,2 |
372 |
302 |
97 |
| Consent Orders |
10 |
2 |
4 |
| Sec. 8e Removal/Prohibition of Director or Officer |
|
|
|
| Notices of Intention to Remove/Prohibit |
111 |
64 |
62 |
| Consent Orders |
0 |
0 |
0 |
| Sec. 8g
Suspension/Removal When Charged With Crime |
|
|
|
| Civil Money Penalties Issued |
|
|
|
| Sec. 7a Call Report Penalties |
0 |
1 |
0 |
| Sec. 8i Civil Money Penalties |
212 |
154 |
98 |
| Sec. 8i
Civil Money Penalty Notices of Assessment |
8 |
0 |
0 |
| Sec. 10c Orders of
Investigation |
15 |
10 |
2 |
| Sec. 19 Waiver Orders |
|
|
|
| Approved Section 19 Waiver Orders |
24 |
12 |
2 |
| Denied Section 19 Waiver Orders |
0 |
0 |
0 |
| Sec.
32 Notices Disapproving Officer/Director’s Request for Review |
0 |
0 |
0 |
| Truth-in-Lending Act Reimbursement Actions |
|
|
|
| Denials of Requests for
Relief |
0 |
0 |
1 |
| Grants of Relief |
0 |
0 |
0 |
| Banks Making
Reimbursement 1 |
64 |
94 |
94 |
| Suspicious Activity Reports (Open and closed
institutions) 1 |
126,098 |
128,973 |
133,153 |
| Other Actions Not Listed |
1 |
0 |
3 |
- These actions do not constitute the
initiation of a formal enforcement
action and, therefore, are not included in the total number of actions
initiated.
- Correction for 2008.
|


