2005 Annual Report
II. Financial Highlights
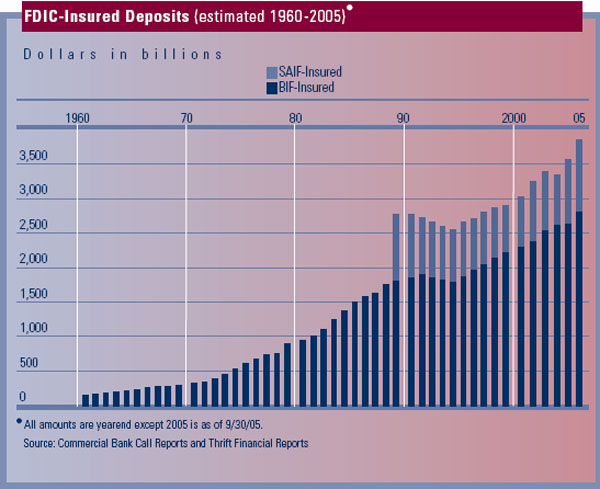
Deposit Insurance Fund Performance
The FDIC administers two deposit insurance funds – the Bank Insurance
Fund (BIF) and the Savings Association Insurance Fund (SAIF) – and manages
the FSLIC Resolution Fund (FRF), which fulfills the obligations of the former
Federal Savings and Loan Insurance Corporation (FSLIC) and the former Resolution
Trust Corporation (RTC). The following summarizes the condition of the FDIC's
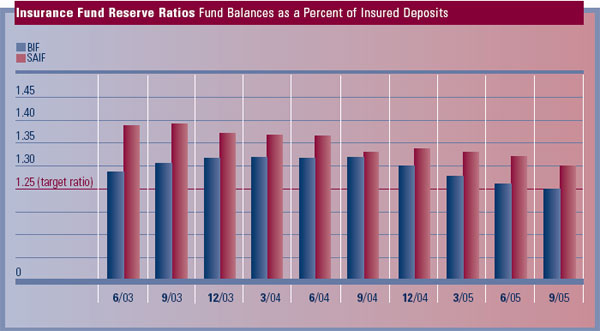
insurance funds. (See the accompanying tables on FDIC-Insured Deposits, Insurance
Fund Reserve Ratios and Risk-Related Premiums on the following pages.)
The BIF reported comprehensive
income (net income plus current period unrealized gains/losses on available-for-sale
(AFS) securities) of
$680 million in 2005
compared to $1.004 billion in 2004. This reduction of $324 million was primarily
due to an increase in unrealized losses on AFS securities of $279 million,
lower recoveries of prior years' provisions for insurance losses of $143
million, an increase in operating expenses of $25 million, and a decrease in
assessment revenues of $43 million, offset by an increase of $161 million in
interest revenue on U.S. Treasury obligations. As of December 31, 2005, the
fund balance was $35.5 billion, up from $34.8 billion at year-end 2004.
The SAIF reported comprehensive
income of $409 million in 2005, compared to $480 million in 2004. This reduction
of $71 million was primarily
due to an
increase in unrealized losses on AFS securities of $93 million and lower recoveries
of prior years' provisions for insurance losses of $50 million, offset
by a $73 million increase in interest revenue on U.S. Treasury obligations.
As of December 31, 2005, the fund balance was $13.1 billion, up from $12.7
billion at year-end 2004.
For both BIF and SAIF, higher interest revenue on U.S. Treasury obligations
stemmed from higher overnight and short-term Treasury yields as well as higher
inflation compensation on Treasury Inflation Protected Securities. However,
the higher interest revenue was more than offset by an increase in unrealized
losses that resulted from a rise in Treasury market yields on short- to intermediate-maturity
AFS securities during 2005.
 d
d
 d
d
Operating Expenses
Corporate Operating Budget expenses totaled $990 million in 2005, including
$979 million in ongoing operations and $11 million for receivership funding.
This represented approximately 95 percent of the approved budget for ongoing
operations and 15 percent of the approved budget for receivership funding.
In December 2005, the Board of Directors approved a 2006 Corporate Operating
Budget of approximately $1.05 billion, including $975 million for ongoing
operations. The level of approved Corporate Operating Budget for 2006 is
more than 5 percent lower than the Corporate Operating Budget for 2005 due
to savings achieved through continued staffing reductions and the realization
of other efficiencies. The Corporate Operating Budget includes funding for
a number of major new initiatives, including increased funding for consumer
protection activities; continued implementation of the Corporate Employee
Program; several new learning initiatives consistent with the Corporation's
commitment to an environment of continuous employee growth and development;
and several projects to explore increased automation of the bank examination
process.
Investment Spending
The
FDIC has a disciplined process for reviewing proposed new investment projects
and managing the implementation
of approved projects.
Most of the projects
in the current investment portfolio are major IT system initiatives. Proposed
IT projects are carefully reviewed to ensure that they are consistent with
the Corporation's enterprise architecture and include an appropriate
return on investment for the insurance funds. The process also enables the
FDIC to be aware of risks to the major capital investment projects and facilitates
appropriate, timely intervention to address these risks throughout the development
process. An investment portfolio performance review of the major capital investments
is provided to the FDIC's Board of Directors quarterly.
During 2005, the Corporation completed and implemented three projects in its
investment portfolio. Spending for investment projects in 2005 totaled approximately
$62 million, but is expected to drop significantly in 2006. The Board of Directors
did not approve any new investment projects in 2005.
Risk-Related Premiums
The following tables show the number and percentage of institutions insured
by the Bank Insurance Fund (BIF) and the Savings Association Insurance Fund
(SAIF), according to risk classifications effective for the first semiannual
assessment period of 2005. Each institution is categorized based on its capital
group (1, 2, or 3) and supervisory subgroup (A, B, or C), which is generally
determined by on-site examinations. Assessment rates are basis points, cents
per $100 of assessable deposits, per year.
| BIF Supervisory Subgroups1 |
| Capital Group |
A |
B |
C |
| 1. Well Capitalized: |
| Assessment Rate |
0 |
3 |
17 |
| Number of Institutions |
7,307 (94.2%) |
344 (4.4%) |
47 (0.6%) |
| 2. Adequately Capitalized: |
| Assessment Rate |
3 |
10 |
24 |
| Number of Institutions |
49 (0.6%) |
5 (0.1%) |
7 (0.1%) |
| 3. Undercapitalized: |
| Assessment Rate |
10 |
24 |
27 |
| Number of Institutions |
0 (0.0%) |
0 (0.0%) |
2 (0.0%) |
| SAIF Supervisory Subgroups2 |
| Capital Group |
A |
B |
C |
| 1. Well Capitalized: |
| Assessment Rate |
0 |
3 |
17 |
| Number of Institutions |
1,034 (93.5%) |
58 (5.2%) |
11 (1.0%) |
| 2. Adequately Capitalized: |
| Assessment Rate |
3 |
10 |
24 |
| Number of Institutions |
3 (0.3%) |
0 (0.0%) |
0 (0.0%) |
| 3. Undercapitalized: |
| Assessment Rate |
10 |
24 |
27 |
| Number of Institutions |
0 (0.0%) |
0 (0.0%) |
0 (0.0%) |
1 BIF data exclude SAIF-member "Oakar" institutions that hold BIF-insured deposits. The assessment rates reflect the rates for BIF-assessable deposits, which remained the same throughout 2005.
2 SAIF data exclude BIF-member "Oakar" institutions that hold SAIF-insured deposits. The assessment rates reflect the rates for SAIF-assessable deposits, which remained the same throughout 2005.


