
|
2005 Annual Report
VI. Appendix B – More About the FDIC
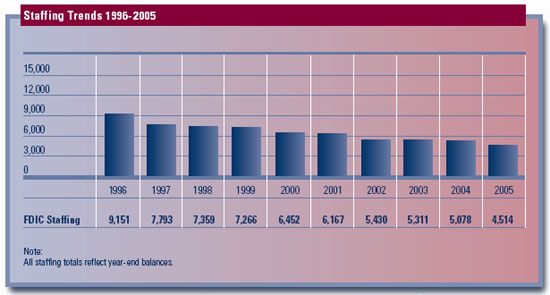
Corporate Staffing
| Year |
1996 |
1997 |
1998 |
1999 |
2000 |
2001 |
2002 |
2003 |
2004 |
2005 |
FDIC |
9,151 |
7,793 |
7,359 |
7,266 |
6,452 |
6,167 |
5,430 |
5,311 |
5,078 |
4,514 |
Note:
All staffing totals reflect year-end balances.
|
| Number of Officials and Employees of the FDIC 2004-2005 (year-end) |
| |
Total |
Washington |
Regional/Field |
| |
2005 |
2004 |
2005 |
2004 |
2005 |
2004 |
| Executive Offices1 |
37 |
42 |
37 |
42 |
0 |
0 |
| Division of Supervision and Consumer Protection |
2,541 |
2,604 |
198 |
179 |
2,343 |
2,425 |
| Division of Resolutions and Receiverships |
235 |
504 |
61 |
99 |
174 |
405 |
| Legal Division |
433 |
488 |
274 |
303 |
159 |
185 |
| Division of Finance |
175 |
195 |
175 |
195 |
0 |
0 |
| Division of Information Technology2 |
270 |
386 |
209 |
324 |
61 |
62 |
| Division of Insurance and Research |
178 |
191 |
146 |
157 |
32 |
34 |
| Division of Administration |
349 |
415 |
232 |
274 |
117 |
141 |
| Office of Inspector General |
127 |
157 |
95 |
111 |
32 |
46 |
| Office of Diversity and Economic Opportunity |
31 |
34 |
31 |
34 |
0 |
0 |
| Office of the Ombudsman |
11 |
18 |
10 |
15 |
2 |
3 |
| Office of Enterprise Risk Management3 |
11 |
12 |
11 |
12 |
0 |
0 |
| Corporate University |
115 |
32 |
37 |
32 |
78 |
0 |
| Total |
4,514 |
5,078 |
1,516 |
1,777 |
2,998 |
3,301 |
| 1
Includes the Offices of the Chairman, Vice Chairman, Director (Appointive), Chief Operating Officer, Chief Financial Officer, Chief Information Officer, Legislative Affairs and Public Affairs.
2 Division of Information Resources Management was renamed to the Division of Information Technology on September 4, 2005
3 Office of Internal Control Management was renamed to Office of Enterprise Risk Management on April 2, 2004.
|
|


