|
Home > About FDIC > Financial Reports > 2004 Annual Report |
|||
|
2004 Annual Report
II. Financial Highlights Deposit Insurance Fund Performance
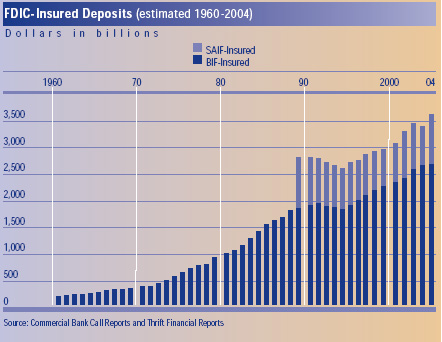
The BIF reported comprehensive income (net income plus current period unrealized gains /losses on available-for-sale securities) of $1 billion for the twelve months ending December 31, 2004, compared to $1.7 billion for the same period in the prior year. This reduction was primarily due to an increase in unrealized losses on available-for-sale securities of $102 million and a reduction in net income of $625 million. The decline in net income primarily resulted from a smaller negative adjustment of $269 million to the provision for losses at December 31, 2004, compared to a negative $931 million adjustment for the same period last year. BIF’s provision for losses negative adjustments were mostly attributable to the reduction of estimated losses for future and actual failures. As of December 31, 2004, the fund balance was $34.8 billion, up from $33.8 billion at year-end 2003. The SAIF reported comprehensive income of $480 million for the twelve months ending December 31, 2004, compared to $493 million for the same period in the prior year. This reduction of $13 million was primarily due to slightly lower earnings on U.S.Treasury obligations whereby a $30 million increase in unrealized losses was partially offset by a $23 million increase in interest revenue. As of December 31, 2004, the fund balance was $12.7 billion, up from $12.2 billion at year-end 2003. Operating Expenses In December 2004, the Board of Directors approved a 2005 Corporate Operating Budget of approximately $1.1 billion, including just over $1.0 billion for ongoing operations. The level of approved spending in the 2005 budget remains virtually the same as that in 2004 due to continuing efforts to identify operational efficiencies and control costs. The Corporate Operating Budget includes funding for a number of major new initiatives, including funding for a Hispanic financial literacy program, and hiring additional financial analysts and risk modeling specialists to prepare for implementation of the Basel Capital Accord. The 2005 budget includes estimated funding requirements ($35 million) for litigation expenses projected to be incurred on behalf of the FDIC by the U.S. Department of Justice. Investment Spending
Proposed projects are carefully reviewed to ensure that they are consistent with the Corporation’s enterprise architecture and include an appropriate return on investment for the insurance funds. The process also enables the FDIC to be aware of risks to the major capital investment projects and facilitates appropriate, timely intervention to address these risks throughout the development process. An investment portfolio performance review of the major capital investments is provided to the FDIC’s Board of Directors quarterly. During 2004, the Board of Directors approved only one new investment project, a new Web-based time and attendance reporting system. Additional spending was also approved for three existing investment projects: (1) Legal Integrated Management System increased by $1.4 million to $5.06 million, (2) New Financial Environment increased $17 million to $51.8 million, and (3) ViSION increased $6.2 million to $12.7 million. Funding for FDIC staff assigned to investment projects was transferred to the Corporate Operating Budget, at year-end 2004, in order to more accurately account for and provide year-to-year comparisons of salary and compensation expenses included in those operating budgets. However, all other project spending continues to be provided through separate investment budget authorizations. Risk-Related Premiums
1 BIF data exclude SAIF-member “Oakar” institutions that hold BIF-insured deposits. The assessment rate reflects the rate for BIF-assessable deposits, which remained the same throughout 2004. 2 SAIF data exclude BIF-member “Oakar” institutions that hold SAIF-insured deposits. The assessment rate reflects the rate for SAIF-assessable deposits, which remained the same throughout 2004.
|
|||||||||||||||||||||||||||||||||||||||||||||||||||||||||||||||||||||||||||||||||||||||||||
| Last Updated 03/11/2005 | communications@fdic.gov | ||||||||||||||||||||||||||||||||||||||||||||||||||||||||||||||||||||||||||||||||||||||||||