
|
|
Deposit
Insurance Fund Portfolio
Summary - Fourth Quarter 2007
Deposit
Insurance Fund Portfolio
Summary
($ in Millions) |
| |
12/31/07 |
12/31/06 |
Change |
| Par Value |
$47,562 |
$46,483 |
$1,079 |
| Amortized Cost |
$50,469 |
$48,858 |
$1,611 |
| Market Value |
$52,378 |
$49,038 |
$3,340 |
| Primary Reserve 1 |
$14,317 |
$13,911 |
$406 |
| Primary Reserve Target Floor 2 |
$15,000 |
$10,000 |
$5,000 |
| Primary Reserve % of Total Portfolio |
26.9% |
28.0% |
(1.1%) |
| Year-to-Date Total Return (Portfolio) |
8.629% |
4.056% |
not applicable |
| Year-to-Date Total Return (Benchmark)3 |
8.861% |
3.571% |
not applicable |
| Total Return Variance (in basis points) |
(23.2) |
48.5 |
not applicable |
| Yield-to-Maturity 4 |
4.72% |
4.89% |
(0.17%) |
| Weighted Average Maturity (in years) |
4.06 |
3.57 |
0.49 |
| Effective Duration (in years) 5 |
| Total Portfolio |
3.19 |
2.82 |
0.37 |
| Available-for-Sale Securities |
1.29 |
1.80 |
(0.51) |
| Held-to-Maturity Securities |
3.94 |
3.29 |
0.65 |
1Prime Reserve is the total
market value (including accrued interest) of overnight investments, available-for-sale
securities,
and held-to-maturity
securities maturing within three months.
2This
primary reserve target floor was increased from the third quarter's $10 billion
target, although when adopted it was understood that the target floor would
not be reached until at least the first quarter of 2008.
3The
benchmark is the total return of the Merrill Lynch 1-10 Year U.S. Treasury
Index.
4The yield-to-maturity includes the potential
yield of Treasury Inflation-Protected Securities (TIPS), which assumes
an average 2.2% annual increase in the CPI over the remaining life of
each TIPS.
5For each TIPS, an estimated 80% "yield
beta" factor is applied to its real yield duration to arrive
at an estimated effective
duration.
National Liquidation Fund (NLF) Investment Portfolio Summary
($ in Millions) |
| |
12/31/07 |
12/31/06 |
Change |
| Book Value 6 |
$393 |
$381 |
($12) |
| Yield-to-Maturity |
4.22% |
5.37% |
(1.15%) |
| Weighted Average Maturity (in days) |
19 |
13 |
6 |
6 Due to the short-term nature of the NLF, the portfolio's Book and Market Values are identical for reporting purposes.
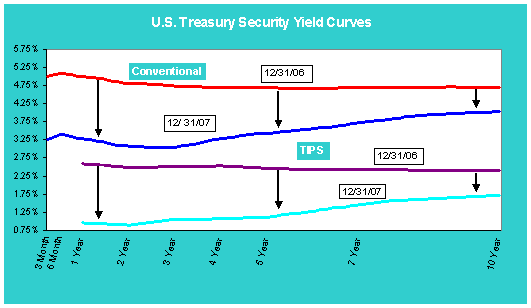
| U.S.
Treasury Security Yield Curves |
| Conventional |
| 12/31/2007 |
3 Month |
3.25% |
| 12/31/2007 |
6 Month |
3.40% |
| 12/31/2007 |
1 Year |
3.29% |
| 12/31/2007 |
2 Year |
3.06% |
| 12/31/2007 |
3 Year |
3.03% |
| 12/31/2007 |
4 Year |
3.30% |
| 12/31/2007 |
5 Year |
3.44% |
| 12/31/2007 |
7 Year |
3.72% |
| 12/31/2007 |
10 Year |
4.03% |
| |
|
|
| 12/31/2006 |
3 Month |
5.02% |
| 12/31/2006 |
6 Month |
5.09% |
| 12/31/2006 |
1 Year |
5.01% |
| 12/31/2006 |
2 Year |
4.82% |
| 12/31/2006 |
3 Year |
4.74% |
| 12/31/2006 |
4 Year |
4.69% |
| 12/31/2006 |
5 Year |
4.70% |
| 12/31/2006 |
7 Year |
4.70% |
| 12/31/2006 |
10 Year |
4.71% |
| |
|
|
| TIPS |
| 12/31/2007 |
3 Month |
|
| 12/31/2007 |
6 Month |
|
| 12/31/2007 |
1 Year |
0.96% |
| 12/31/2007 |
2 Year |
0.90% |
| 12/31/2007 |
3 Year |
1.05% |
| 12/31/2007 |
4 Year |
1.08% |
| 12/31/2007 |
5 Year |
1.11% |
| 12/31/2007 |
7 Year |
1.46% |
| 12/31/2007 |
10 Year |
1.71% |
| |
|
|
| 12/31/2005 |
3 Month |
|
| 12/31/2005 |
6 Month |
|
| 12/31/2006 |
1 Year |
2.58% |
| 12/31/2006 |
2 Year |
2.49% |
| 12/31/2006 |
3 Year |
2.51% |
| 12/31/2006 |
4 Year |
2.53% |
| 12/31/2006 |
5 Year |
2.47% |
| 12/31/2006 |
7 Year |
2.43% |
| 12/31/2006 |
10 Year |
2.41% |
|


