
|
 |
DIF
Income Statement -
Third Quarter 2008
| Fund Financial Results |
($
in millions) |
| Income
Statement |
| |
Sep-08 |
Jun-08 |
Quarterly Change |
Sep-07 |
Year-Over-Year Change |
| Assessments earned |
$1,969 |
$1,088 |
$881 |
$404 |
$1,565 |
| Interest earned on investment securities |
1,795 |
1,269 |
526 |
1,955 |
(160) |
| Other revenue |
18 |
2 |
16 |
11 |
7 |
| Realized gain on sale of investments |
473 |
0 |
473 |
0 |
473 |
| Total Revenue |
$4,255 |
$2,359 |
$1,896 |
$2,370 |
$1,885 |
| Operating expenses (includes depreciation expense) |
743 |
494 |
249 |
730 |
13 |
| Provision for insurance losses |
22,676 |
10,746 |
11,930 |
56 |
22,620 |
| Other expenses |
1 |
1 |
0 |
2 |
(1) |
| Total
Expenses & Losses |
$23,420 |
$11,241 |
$12,179 |
$788 |
$22,632 |
| Net (Loss)/Income |
($19,165) |
($8,882) |
($10,283) |
$1,582 |
($20,747) |
| Unrealized gain/(loss) on available-for-sale securities, net |
1,340 |
1,686 |
(346) |
(13) |
1,353 |
| Unrealized postretirement benefit gain/(loss) |
0 |
0 |
0 |
20 |
(20) |
| YTD Comprehensive (Loss)/Income |
($17,825) |
($7,196) |
($10,629) |
$1,589 |
($19,414) |

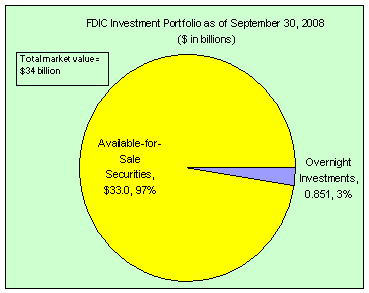
| FDIC
Investment Portfolio as of September 30, 2008 |
| |
$ in billions |
Percentage |
Overnight
investments |
0.851 |
3 |
Available-for-Sale
Securities |
33.0 |
97 |
Total
market value = $34 billion |

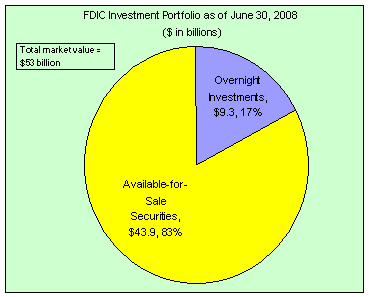
| FDIC
Investment Portfolio as of June 30, 2008 |
| |
$
in billions |
Percentage |
Overnight Investments |
9.3 |
17 |
Available-for-Sale
Securities
|
43.9 |
83 |
Total market
value = $53 billion |
|