|
Chief
Financial Officer's (CFO) Report to the Board
301 Moved Permanently
301 Moved Permanently
openresty
 |
DIF
Balance Sheet -
Second Quarter 2011
| Fund Financial Results |
($
in millions) |
Balance
Sheet |
|
Unaudited
Jun-11 |
Unaudited
Mar-11 |
Quarterly
Change |
Unaudited
Jun-10 |
Year-Over-Year
Change |
| Cash and cash equivalents |
$16,631 |
$23,496 |
($6,865) |
$18,824 |
($2,193) |
| Cash and investments - restricted - systemic risk |
7,363 |
6,996 |
367 |
5,786 |
1,577 |
| Investment in U.S. Treasury obligations, net |
20,820 |
14,894 |
5,926 |
19,264 |
1,556 |
| Trust preferred securities |
2,346 |
2,345 |
1 |
2,130 |
216 |
| Assessments receivable, net |
205 |
206 |
(1) |
313 |
(108) |
| Receivables and other assets - systemic risk |
1,901 |
2,243 |
(342) |
3,486 |
(1,585) |
| Interest receivable on investments and other assets, net |
279 |
264 |
15 |
165 |
114 |
| Receivables from resolutions, net |
29,126 |
29,748 |
(622) |
50,451 |
(21,325) |
| Property and equipment, net |
405 |
407 |
(2) |
391 |
14 |
| Total Assets |
$79,076 |
$80,599 |
($1,523) |
$100,810 |
($21,734) |
| Accounts payable and other liabilities |
382 |
480 |
(98) |
327 |
55 |
| Unearned revenue - prepaid assessments |
23,787 |
26,766 |
(2,979) |
36,785 |
(12,998) |
| Liabilities due to resolutions |
30,912 |
30,883 |
29 |
41,863 |
(10,951) |
| Deferred revenue - systemic risk |
9,131 |
9,088 |
43 |
8,321 |
810 |
| Postretirement benefit liability |
166 |
166 |
- |
145 |
21 |
| Contingent liability for anticipated failures |
10,349 |
13,788 |
(3,439) |
27,534 |
(17,185) |
| Contingent liabillty for systemic risk |
133 |
151 |
(18) |
782 |
(649) |
| Contingent liability for litigation losses |
300 |
300 |
- |
300 |
- |
| Total Liabilities |
$75,160 |
$81,622 |
($6,462) |
$116,057 |
($40,897) |
| FYI: Unrealized gain (loss) on U.S. Treasury investments, net |
62 |
37 |
25 |
62 |
- |
| FYI: Unrealized gain (loss) on trust preferred securities |
385 |
383 |
2 |
168 |
217 |
| FYI: Unrealized postretirement benefit gain (loss) |
(19) |
(19) |
- |
(3) |
(16) |
| Fund Balance |
$3,916 |
($1,023) |
$4,939 |
($15,247) |
$19,163 |
|

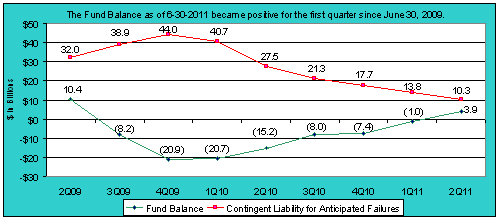
| The Fund Balance as of 6-30-2011 became positive for the first quarter since June 30, 2009 ($ in billions) |
Quarter
End |
Fund Balance |
Contingent Liability for Anticipated Failures |
2nd
Qtr. 2009
|
10.4 |
32.0 |
3rd
Qtr. 2009
|
(8.2) |
38.9 |
4th
Qtr. 2009
|
(20.9) |
44.0 |
1st
Qtr. 2010
|
(20.7) |
40.7
|
2nd
Qtr. 2010
|
(15.2) |
27.5 |
3rd Qtr.
2010 |
(8.0) |
21.3 |
4th Qtr.
2010 |
(7.4) |
17.7 |
1st Qtr.
2011 |
(1.0) |
13.8 |
2nd Qtr.
2011 |
3.9 |
10.3 |
|
|
|