
|
 |
DIF
Income Statement -
Second Quarter 2008
| Fund Financial Results |
($
in millions) |
| Income
Statement |
| |
Jun-08 |
Mar-08 |
Quarterly Change |
Jun-07 |
Year-Over-Year Change |
| Assessments earned |
$1,088 |
$448 |
$640 |
$234 |
$854 |
| Interest earned on investment securities |
1,269 |
618 |
651 |
1,315 |
(46) |
| Other revenue |
2 |
1 |
1 |
6 |
(4) |
| Total Revenue |
$2,359 |
$1,067 |
$1,292 |
$1,555 |
$804 |
| Operating expenses (includes depreciation expense) |
494 |
238 |
256 |
487 |
7 |
| Provision for insurance losses |
10,746 |
525 |
10,221 |
(76) |
10,822 |
| Other expenses |
1 |
1 |
0 |
1 |
0 |
| Total
Expenses & Losses |
$11,241 |
$764 |
$10,477 |
$412 |
$10,829 |
| Net (Loss)/Income |
$(8,882) |
$303 |
$(9,185) |
$1,143 |
$(10,025) |
| Unrealized gain/(loss) on available-for-sale securities, net |
1,686 |
127 |
1,559 |
(81) |
1,767 |
| Unrealized postretirement benefit gain/(loss) |
0 |
0 |
0 |
0 |
0 |
| YTD Comprehensive (Loss)/Income |
$(7,196) |
$430 |
$(7,626) |
$1,062 |
$(8,258) |

| FDIC
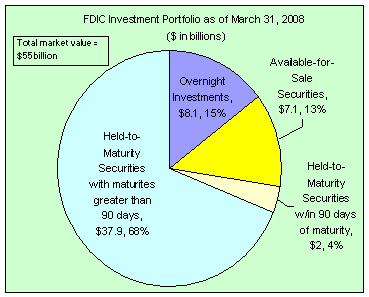
Investment Portfolio as of March 31, 2008 |
| |
$ in billions |
Percentage |
Overnight
investments |
8.1 |
15 |
Available-for-Sale
Securities |
7.1 |
13 |
Held-to-Maturity
Securities within 90 days of maturity |
2 |
4 |
Held-to-Maturity
Securities with maturities greater than 90 days
|
37.9 |
68 |
Total
market value = $55 billion |

| FDIC
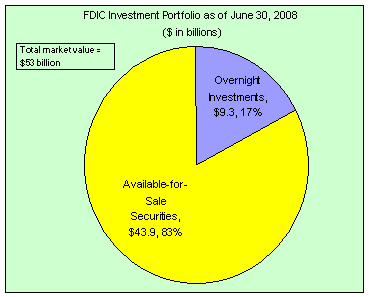
Investment Portfolio as of June 30, 2008 |
| |
$
in billions |
Percentage |
Overnight Investments |
9.3 |
17 |
Available-for-Sale
Securities
|
43.9 |
83 |
Total market
value = $53 billion |
|