301 Moved Permanently
301 Moved Permanently
openresty
 |
Selected
Financial Data - Third Quarter
2012
| Fund Financial Results |
($
in millions) |
| FSLIC
Resolution Fund |
| |
Sep-12 |
Jun-12 |
Quarterly Change |
Sep-11 |
Year-Over-Year Change |
Cash and cash equivalents |
$3,594 |
$3,596 |
($2) |
$3,528 |
$66 |
| Accumulated deficit |
(124,460) |
(124,461) |
1 |
(124,275) |
(185) |
| Total resolution equity |
3,596 |
3,595 |
1 |
3,551 |
45 |
| Total revenue |
4 |
2 |
|
6 |
(2) |
| Operating expenses |
4 |
3 |
|
3 |
1 |
| Goodwill litigation expenses |
181 |
181 |
|
33 |
148 |
| Payment/Recovery of tax benefits |
- |
- |
|
26 |
(26) |
| Net Income (Loss) |
($180) |
($180) |
|
($51) |
($129) |
| Receivership
Selected Statistics September 2012 vs. September 2011 |
| $ in millions |
DIF |
FRF |
ALL FUNDS |
| |
Sep-12 |
Sep-11 |
Change |
Sep-12 |
Sep-11 |
Change |
Sep-12 |
Sep-11 |
Change |
Total Receiverships |
462 |
410 |
52 |
4 |
8 |
(4) |
466 |
418 |
48 |
| Assets in Liquidation |
$18,158 |
$22,379 |
($4,221) |
$7 |
$22 |
($15) |
$18,165 |
$22,401 |
($4,236) |
| YTD Collections |
$6,337 |
$9,885 |
($3,548) |
$18 |
$8 |
$10 |
$6,355 |
$9,893 |
($3,538) |
| YTD Dividend/ Other Pymts - Cash |
$3,917 |
$7,389 |
($3,472) |
$- |
$- |
$- |
$3,917 |
$7,389 |
($3,472) |
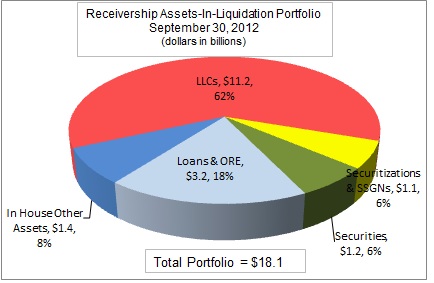
DIF Receivership Assets-In-Liquidation Portfolio September 30, 2012 (dollars in billions) |
| |
Amount |
Percentage |
LLCs |
$11.2 |
62% |
Securitizations & SSGNs |
$1.1 |
6% |
Loans & ORE |
$3.2 |
18% |
Securities |
$1.2 |
6% |
In House Other Assets |
$1.4 |
8% |
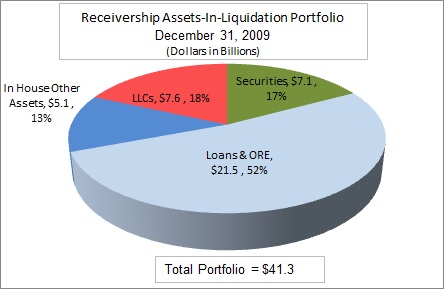
DIF Receivership Assets-In-Liquidation Portfolio December 31, 2009 (dollars in billions) |
| |
Amount |
Percentage |
LLCs |
$7.6 |
18% |
Securities |
$7.1 |
17% |
Loans & ORE |
$21.5 |
52% |
In House Other Assets |
$5.1 |
13% |
|


