301 Moved Permanently
301 Moved Permanently
openresty
 |
II.
Investments Results - Third Quarter 2012
Total DIF Portfolio Liquidity
- The total liquidity available to the DIF is the sum of the DIF investment portfolio ($37.5 billion) and the DGP investment portfolio ($1.1 billion). Consequently, the total liquidity (total market value including accrued interest) of both DIF-related investment portfolios stood at $38.6 billion on September 30, 2012, down $3.8 billion from $42.4 billion on December 31, 2011.
DIF Investment Portfolio
- On September 30, 2012, the DIF investment portfolio stood at $37.5 billion (total market value), substantially similar to its December 31, 2011, balance of $37.6 billion. Outflows for funding initial resolution payments, operating expenses, and other payments related to receivership activities were largely offset by receivership dividends, net transfers from the DGP investment portfolio, assessments, and other inflows.
- On September 30, 2012, the DIF investment portfolio’s yield was 0.44 percent, up three basis points from its December 31, 2011, yield of 0.41 percent. During the first three quarters of 2012, newly purchased Treasury securities, including some higher yielding Treasury Inflation-Protected Securities (TIPS) and overnight investments, had higher yields than maturing securities, hence the rise in portfolio yield.
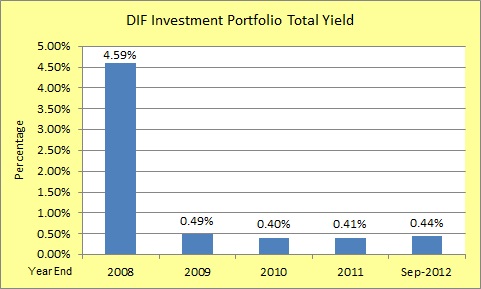
DIF Investment Portfolio Total Yield (in percentage) |
Year-end |
Percentage |
| 2008 |
4.59% |
| 2009 |
0.49% |
| 2010 |
0.40% |
| 2011 |
0.41% |
| Sept - 2012 |
0.44% |
- In accordance with the approved third quarter 2012 DIF portfolio investment strategy, staff purchased a total of eight short-maturity conventional Treasury securities on three occasions. The eight securities had a total par value of $8.6 billion, a weighted average yield of 0.24 percent, and a weighted average maturity (WAM) of 1.00 year.
DGP Investment Portfolio
- On September 30, 2012, the DGP investment portfolio stood at $1.1 billion (total market value), down substantially from its December 31, 2011, balance of $4.8 billion, primarily due to the June 2012 transfer of DGP funds into the DIF investment portfolio reported last quarter. In accordance with the approved third quarter 2012 DGP portfolio investment strategy, staff purchased one Treasury bill with a par value of $400 million, a yield of 0.12 percent, and a maturity date of December 27, 2012 (equating to a maturity of 0.36 years).
|


