301 Moved Permanently
301 Moved Permanently
openresty
 |
DIF
Balance Sheet -
Third Quarter 2012
| Fund Financial Results |
($
in millions) |
Balance
Sheet |
|
Sep-12 |
Jun-12 |
Quarterly
Change |
Sep -11 |
Year-Over-Year
Change |
| Cash and cash equivalents |
$1,587 |
$4,137 |
($2,550) |
$9,929 |
($8,342) |
| Cash and investments - restricted - systemic risk |
1,115 |
945 |
170 |
7,393 |
(6,278) |
| Investment in U.S. Treasury obligations, net |
35,460 |
33,314 |
2,146 |
25,370 |
10,090 |
| Trust preferred securities |
2,255 |
2,314 |
(59) |
2,179 |
76 |
| Assessments receivable, net |
660 |
454 |
206 |
231 |
429 |
| Receivables and other assets - systemic risk |
1,568 |
1,723 |
(155) |
1,834 |
(266) |
| Interest receivable on investments and other assets, net |
462 |
449 |
13 |
320 |
142 |
| Receivables from resolutions, net |
18,948 |
21,855 |
(2,907) |
29,316 |
(10,368) |
| Property and equipment, net |
379 |
386 |
(7) |
401 |
(22) |
| Total Assets |
$62,434 |
$65,577 |
($3,143) |
$76,973 |
($14,539) |
| Accounts payable and other liabilities |
346 |
348 |
(2) |
369 |
(23) |
| Unearned revenue - prepaid assessments |
9,219 |
11,474 |
(2,255) |
20,360 |
(11,141) |
| Liabilities due to resolutions |
21,215 |
24,185 |
(2,970) |
31,492 |
(10,277) |
| Debt Guarantee Program liabilities - systemic risk |
- |
- |
- |
110 |
(110) |
| Deferred revenue - systemic risk |
2,682 |
2,668 |
14 |
9,101 |
(6,419) |
| Postretirement benefit liability |
188 |
188 |
- |
166 |
22 |
| Contingent liability for anticipated failures |
3,556 |
4,017 |
(461) |
7,247 |
(3,691) |
| Contingent liability for systemic risk |
- |
- |
- |
15 |
(15) |
| Contingent liability for litigation losses |
4 |
4 |
- |
300 |
(296) |
| Total Liabilities |
$37,210 |
$42,884 |
($5,674) |
$69,160 |
($31,950) |
| FYI: Unrealized gain (loss) on U.S. Treasury investments, net |
65 |
(1) |
66 |
41 |
24 |
| FYI: Unrealized gain (loss) on trust preferred securities |
293 |
352 |
(59) |
218 |
75 |
| FYI: Unrealized postretirement benefit (loss) gain |
(34) |
(34) |
- |
(19) |
(15) |
| Fund Balance |
$25,224 |
$22,693 |
$2,531 |
$7,813 |
$17,411 |
|
|
|
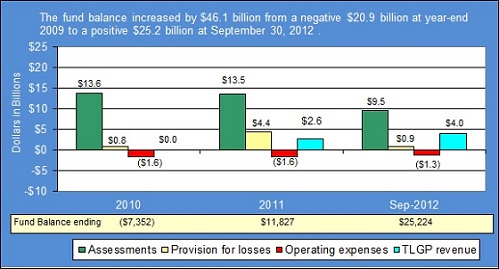
| Fund Balance ($ in billion) |
| |
Assessments |
Provision for Losses |
Operating Expenses |
TLGP Revenue |
Fund Balance |
2010 |
$13.6 |
$0.8 |
($1.6) |
$0.0 |
($7,352) |
| 2011 |
$13.5 |
$4.4 |
($1.6) |
$2.6 |
$11,827 |
| Sep-2012 |
$9.5 |
$0.9 |
($1.3) |
$4.0 |
$25,224 |
|
Of the total $46.1 billion increase in the fund balance, the primary contributors were $36.6 billion in assessments, $6.1 billion in negative provision for insurance losses, and $6.6 billion in TLGP revenue, offset by $4.5 billion in operating expenses. |


