
|
 |
DIF
Balance Sheet -
Third Quarter 2008
| Fund Financial Results |
($
in millions) |
Balance
Sheet |
|
Sep-08 |
Jun-08 |
Quarterly
Change |
Sep-07 |
Year-Over-Year
Change |
| Cash & cash equivalents |
$854 |
$9,257 |
($8,403) |
$2,854 |
($2,000) |
| Investment in U.S. Treasury obligations, net |
32,559 |
43,218 |
(10,659) |
47,933 |
(15,374) |
| Assessments receivable, net |
890 |
627 |
263 |
173 |
717 |
| Interest receivable on investments and other assets, net |
472 |
695 |
(223) |
706 |
(234) |
| Receivables from resolutions, net |
14,414 |
2,179 |
12,235 |
2,057 |
12,357 |
| Property, buildings and other capitalized assets, net |
364 |
355 |
9 |
357 |
7 |
| Total Assets |
$49,553 |
$56,331 |
($6,778) |
$54,080 |
($4,527) |
| Accounts payable and other liabilities |
2,923 |
208 |
2,715 |
1,942 |
981 |
| Postretirement benefit liability |
116 |
116 |
0 |
114 |
2 |
| Contingent Liabilities: future failures |
11,726 |
10,590 |
1,136 |
70 |
11,656 |
| Contingent Liabilities: litigation losses & other |
200 |
200 |
0 |
200 |
0 |
| Total Liabilities |
$14,965 |
$11,114 |
$3,851 |
$2,326 |
$12,639 |
| FYI: Unrealized gain on available-for-sale securities, net |
1,699 |
2,045 |
(346) |
221 |
1,478 |
| FYI: Unrealized postretirement benefit gain |
19 |
19 |
0 |
22 |
(3) |
| FUND BALANCE |
$34,588 |
$45,217 |
($10,629) |
$51,754 |
($17,166) |

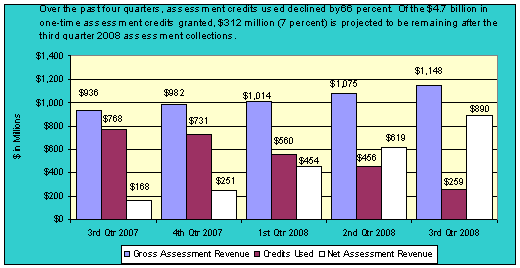
| Quarter |
Gross
Assessment Revenue |
Credits
Used |
Net
Assessment Revenue |
3rd
Qtr 2007
|
936 |
768 |
168 |
4th
Qtr 2007
|
982 |
731 |
251 |
1st
Qtr 2008
|
1,014 |
560 |
454 |
2nd
Qtr 2008
|
1,075 |
456 |
619 |
3rd Qtr 2008 |
1,148 |
259 |
890 |
|
|