
|
|
Deposit
Insurance Fund Portfolio
Summary - Second Quarter 2007
Deposit
Insurance Fund Portfolio
Summary
(Dollar Values in Millions) |
| |
| |
06/30/07 |
12/31/06 |
Change |
| Par Value |
$46,861 |
$46,483 |
$378 |
| Amortized Cost |
$49,942 |
$48,858 |
$1,084 |
| Market Value |
$49,736 |
$49,038 |
$698 |
| Primary Reserve1 |
$11,974 |
$13,911 |
($1,937) |
| Prime Reserve Target Floor |
$10,000 |
$10,000 |
$0 |
| Prime Reserve % of Total Portfolio |
23.7% |
28.0% |
(4.3%) |
| Year-to-Date Total Return (Portfolio) |
1.866% |
4.056% |
NA |
| Year-to-Date Total Return (Benchmark)2 |
1.554% |
3.571% |
NA |
| Total Return Variance (in basis points) |
31.2 |
48.5 |
NA |
| Yield-to-Maturity3 |
4.97% |
4.89% |
0.08% |
| Weighted Average Maturity (in years) |
4.39 |
3.57 |
0.82 |
| Effective Duration (in years)4 |
| Total Portfolio |
3.39 |
2.82 |
0.57 |
| Available-for-Sale Securities |
1.52 |
1.80 |
(0.28%) |
| Held-to-Maturity Securities |
3.91 |
3.29 |
0.62 |
1Prime Reserve is the total
market value (including accrued interest) of overnight investments, available-for-sale
securities,
and held-to-maturity
securities maturing within three months.
2The benchmark is the total return of the Merrill Lynch 1-10 Year U.S. Treasury Index.
3The yield-to-maturity includes the potential
yield of Treasury Inflation-Protected Securities (TIPS), which assumes
an average 2.2% annual increase in the CPI over the remaining life of each
TIPS.
4For each TIPS, an estimated 80% " yield
beta" factor is applied to its real yield duration to arrive at an estimated
effective
duration.
National Liquidation Fund (NLF) Investment Portfolio Summary
(Dollar Values in Millions) |
| |
06/30/07
|
12/31/06 |
Change
|
| Book Value 5 |
$168 |
$381 |
($213)6 |
| Yield-to-Maturity |
5.39% |
5.37% |
0.02% |
| Weighted Average Maturity (in days) |
15 |
13 |
2 |
5 Due to the short-term nature of the NLF, the portfolio's Book and Market Values are identical for reporting purposes.
6 Much of the significant decline
occurred at the end of the second quarter of 2007 as a result of a large
receivership dividend payment.
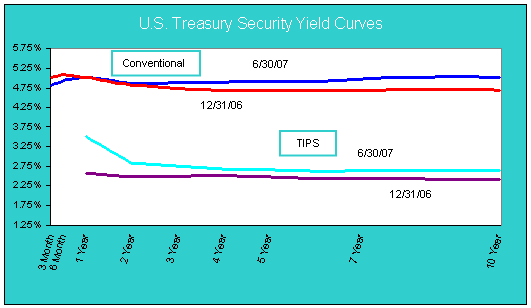
| U.S.
Treasury Security Yield Curves |
| Conventional |
| 06/30/2007 |
3 Month |
4.81% |
| 06/30/2007 |
6 Month |
4.95% |
| 06/30/2007 |
1 Year |
5.01% |
| 06/30/2007 |
2 Year |
4.87% |
| 06/30/2007 |
3 Year |
4.89% |
| 06/30/2007 |
4 Year |
4.90% |
| 06/30/2007 |
5 Year |
4.93% |
| 06/30/2007 |
7 Year |
4.97% |
| 06/30/2007 |
10 Year |
5.03% |
| |
|
|
| 12/31/2006 |
3 Month |
5.02% |
| 12/31/2006 |
6 Month |
5.09% |
| 12/31/2006 |
1 Year |
5.01% |
| 12/31/2006 |
2 Year |
4.82% |
| 12/31/2006 |
3 Year |
4.74% |
| 12/31/2006 |
4 Year |
4.69% |
| 12/31/2006 |
5 Year |
4.70% |
| 12/31/2006 |
7 Year |
4.70% |
| 12/31/2006 |
10 Year |
4.71% |
| |
|
|
| TIPS |
| 06/30/2007 |
3 Month |
|
| 06/30/2007 |
6 Month |
|
| 06/30/2007 |
1 Year |
3.50% |
| 06/30/2007 |
2 Year |
2.82% |
| 06/30/2007 |
3 Year |
2.75% |
| 06/30/2007 |
4 Year |
2.69% |
| 06/30/2007 |
5 Year |
2.67% |
| 06/30/2007 |
7 Year |
2.63% |
| 06/30/2007 |
10 Year |
2.66% |
| |
|
|
| 12/31/2005 |
3 Month |
|
| 12/31/2005 |
6 Month |
|
| 12/31/2006 |
1 Year |
2.58% |
| 12/31/2006 |
2 Year |
2.49% |
| 12/31/2006 |
3 Year |
2.51% |
| 12/31/2006 |
4 Year |
2.53% |
| 12/31/2006 |
5 Year |
2.47% |
| 12/31/2006 |
7 Year |
2.43% |
| 12/31/2006 |
10 Year |
2.41% |
|


