
Analysis of Diversity Self- Assessments for 2019

Executive Summary: 2019 Diversity Self-Assessment
The FDIC’s commitment to diversity, equity, inclusion and accessibility (DEIA) remains strong. We engage with our regulated financial institutions to learn about their diversity programs and unique challenges so we are in a better position to provide technical assistance. Annually, we invite our institutions to complete a self-assessment, encouraging them to gather and analyze data concerning their diversity policies and practices. We encourage our financial institutions to share their assessment results with the FDIC.
The FDIC developed the diversity self-assessment framework based on the Joint Standards for Assessing our Regulated Entities' Diversity Policies and Practices that we established with five other federal agencies. The Standards provide institutions with data that support the adoption of leading diversity practices into their workforce, workplace, and supplier diversity. The data also can help institutions to build better relationships with their customers and communities served.
The self-assessment covers the previous calendar year (the reporting period) and is due by June 30th after the close of the calendar year. For the 2019 reporting period, the FDIC invited 787 supervised financial institutions with 100 or more employees to participate in the diversity self-assessment. More than 150 financial institutions submitted self-assessments, representing a 19 percent submission rate, an increase of 14 percent over the 2018 reporting period.
Outreach to Increase Participation
The FDIC’s Office of Minority and Women Inclusion (OMWI) expanded outreach to learn about the challenges and support our financial institutions through the diversity self-assessment process. OMWI analyzed assessments received for diversity trends and exemplary practices. And in 2019, OMWI continued efforts to maximize the use of technology, streamlining the data collection process. For the first time, our financial institutions could submit their diversity self-assessment electronically, reducing the burden and providing financial institutions with access to their data year-round.
During the reporting period, OMWI also presented at banking conferences, preparing resistive resource materials, and co-hosting the annual Summit with the other OMWI agencies. Also, we encouraged our regulated entities’ participation providing financial institutions with technical assistance on their diversity self-assessment.
Aggregated Results
The 2019 assessment results were consistent with the previous 2018 reporting period, with slight decreases and no notable improvements. For detailed analysis results see Appendix 1 – Aggregated Assessment Results and Appendix 2 – Trend Analysis of Self-Assessment Results: Reporting Periods 2016-2019.
Financial institutions should direct questions about the diversity self-assessment to OMWI at BankDiversity@FDIC.gov.
2019 Reporting Period: Self-Assessment Results
Our regulated institutions provide employment, banking products, and services that have a broad impact on their communities’ economic well-being. To promote transparency and accountability about diversity, Section 342 of the Dode-Frank Wall Street Reform and Consumer Protection Act established the Office of Minority and Women Inclusion (OMWI) with responsibility for diversity in management, employment, and business activities. The FDIC’s OMWI, in collaboration with the other federal financial regulators, developed Standards for assessing the diversity policies and practices of our regulated institutions. The Standards are outlined in the Inter agency Joint Standards for Assessing the Diversity Policies and Practices issued in 2015.
The OMWI’s Financial Institution Diversity Program (FID) manages the annual assessment process. The program provides tools and resources to our regulated financial institutions conducting the annual assessment. We are learning from our institutions to better position the program to provide technical assistance that supports maturing their diversity programs.
Encouraging Self-Assessment Participation
Each year, we encourage our financial institutions’ voluntary participation in the diversity self-assessment to create momentum for sustainable culture change in the banking industry. In January 2020, the Director of the FDIC’s OMWI issued letters to Presidents and Chief Executive Officers, Human Resources Managers, Diversity and Inclusion Officers, and Supplier Diversity Officers of 787 FDIC-regulated financial institutions that were identified as having 100 or more employees in calendar year 2019. The letter informed these institutions about conducting and voluntarily submitting their diversity information to the FDIC. In March 2020, the Deputy to the Chairman and Chief Operating Officer issued a reminder letter.
Also, in March 2020, the FDIC issued Financial Institution Letter (FIL) 23-2020 to our regulated financial institutions to encourage participation and announce a new automated application, the Financial Institution Diversity Self-Assessment (FID-SA). The FIL also announced an extension of the submission deadline to accommodate institutions dealing with the pandemic crisis.
Following receipt of the self-assessment submissions, the FDIC completed its analysis of the financial industry’s diversity policies and practices for the 2019 reporting period (See Appendix 1 – Aggregated Assessment Results). The FDIC also performed a comparative analysis against the previous reporting years for monitoring progress and trends in diversity employment and contracting activities (See Appendix 2 – Trend Analysis of Self-Assessment Results: Reporting Periods 2016-2019). Even with the pandemic crisis, OMWI observed an increase in submissions over the previous reporting periods.
For the 2019 reporting period, more than 150 of the invited FDIC-regulated financial institutions submitted self-assessments, representing a 19 percent submission rate. These institutions employ 38 percent of all employees and hold 42 percent of the assets held by FDIC-regulated financial institutions. The 19 percent response rate for diversity self-assessments received for the 2019 reporting period represents a 14 percent increase over the 16.9 percent response rate for the 2018 reporting period.
Partnering with Financial Institutions
Financial institution participation is important for assessing trends, progress, and exemplary practices across the financial services industry. For this reason, we strongly encourage our financial institutions to consider participating in the annual assessment. The more institutions that are transparent about their diversity policies and practices creates momentum around building a safer, fairer, and more inclusive financial system.
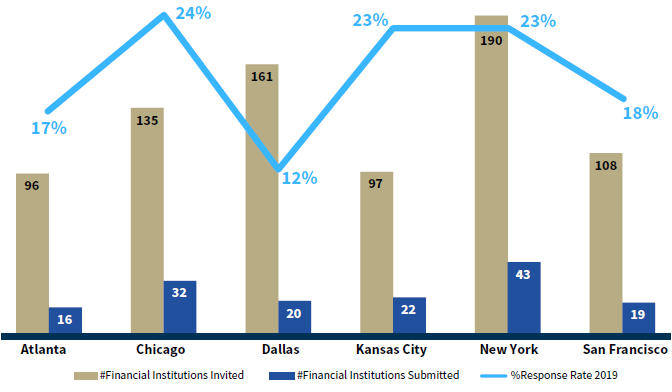
We appreciate our regulated financial institutions that partner with us in promoting diversity and inclusion in the banking industry through participation in the diversity self-assessment. Below we illustrate the number of responses received by FDIC region. The response rate was highest in the Chicago region, at 24 percent, and lowest in the Dallas region at 12 percent.
| Financial Institutions by FDIC Regions (2019) | |||
|---|---|---|---|
| FDIC Regional Office Location | Number of Financial Institutions Invited | Number of Financial Institutions Submitted | Response Rate 2019 |
| Atlanta | 96 | 16 | 17% |
| Chicago | 135 | 32 | 24% |
| Dallas | 161 | 20 | 12% |
| Kansas City | 97 | 22 | 23% |
| New York | 190 | 43 | 23% |
| San Francisco | 108 | 19 | 18% |
In the fall of 2020, the FDIC began repositioning the FID Program to increase technical assistance to our regulated entities that addresses identified challenges. Our goal is to ensure that the resources provide clear and effective guidance about how financial institutions can develop and implement impaction diversity programs.
Expanding Outreach to Financial Institutions
We continue to increase voluntary participation by expanding our outreach efforts. For the 2019 reporting period, we realized some success from enhanced outreach efforts despite the pandemic. As mentioned, the response rate for the 2019 reporting period was 14 percent higher than the response rate for the 2018 reporting period. Outreach enables the FDIC to explain to our supervised institutions the benefits of increasing transparency about their diversity policies and practices to help build a more inclusive banking system. Each of our outreach efforts focused on the value of conducting voluntary self-assessments, as well as making diversity information available to the public. Such transparency advances the visibility and adoption of diversity and inclusion practices in the financial industry.
OMWI successfully completed the following outreach initiatives for the 2019 reporting period:
- Co-hosted the Federal Regulatory Agencies Diversity and Inclusion Summit in Chicago with the other OMWI agencies.
- Conducted American Bankers Association webbing: “What Bankers Need to Know About the Diversity Self-Assessment.”
- Created a dedicated Resources page for Financial Institution Diversity.
- Provided technical assistance to financial institutions on the diversity self-assessment and registering for access to the Financial Institution Diversity Self-Assessment application.
- Prepared guidance documents to provide guidance and informative resources for financial
institutions to develop or strengthen their diversity and inclusion practices and policies:
- Guidance relating to Workforce Profile and Employment Practices; and
- Guidance relating to Procurement and Business Practices for Supplier Diversity.
Maximizing Technology for Increase Efficiency
The FDIC diversity commitment extends to supporting our financial institutions in conducting an annual assessment. We developed the FID-SA electronic application to automate the process for the FDIC’s regulated financial institutions to complete and submit their annual Diversity Self-Assessment of FDIC Regulated Financial Institutions instrument. This tool streamlines the experience and is accessible through the secured FDIC-connect portal.
The FID-SA electronic application was designed to improve the financial institutions’ experience by reducing the estimated reporting burden associated with the Paperwork Reduction Act and offering a secure, easy and efficient electronic interface for submitting the diversity self-assessment. The FID-SA application permits multiple authorized users to complete a self-assessment view previous submissions attach supporting material and print and save in .pdf format.
Promoting Diversity and Inclusion in the Banking System
To make meaningful culture change, our regulated institutions must have data on their existing workforce and supplier diversity practices. The diversity self-assessment provides a framework for our financial institutions to assess their workforce, workplace, and supplier diversity practices. The framework leverages leading practices of a successful diversity program that is built around five Standards.
For the 2019 reporting period, responses to the five Standards were consistent with the previous reporting period, with slight decreases and no notable improvements. The average affirmative response percentage for each Standard is included below. For detailed self-assessment analysis results, see Appendix 1 – Aggregated Assessment Results and Appendix 2 – Trend Analysis for Reporting Periods 2016 - 2019.
- Standard 1- Organizational Commitment to Diversity and Inclusion: 84 percent
- Standard 2- Workforce Profile and Employment Practices: 81 percent
- Standard 3- Procurement and Business Practices for Supplier Diversity: 21 percent
- Standard 4- Practice to Promote Transparency of Organizational Diversity and Inclusion: 55 percent
- Standard 5- Financial Institutions’ Self-Assessment: 65 percent
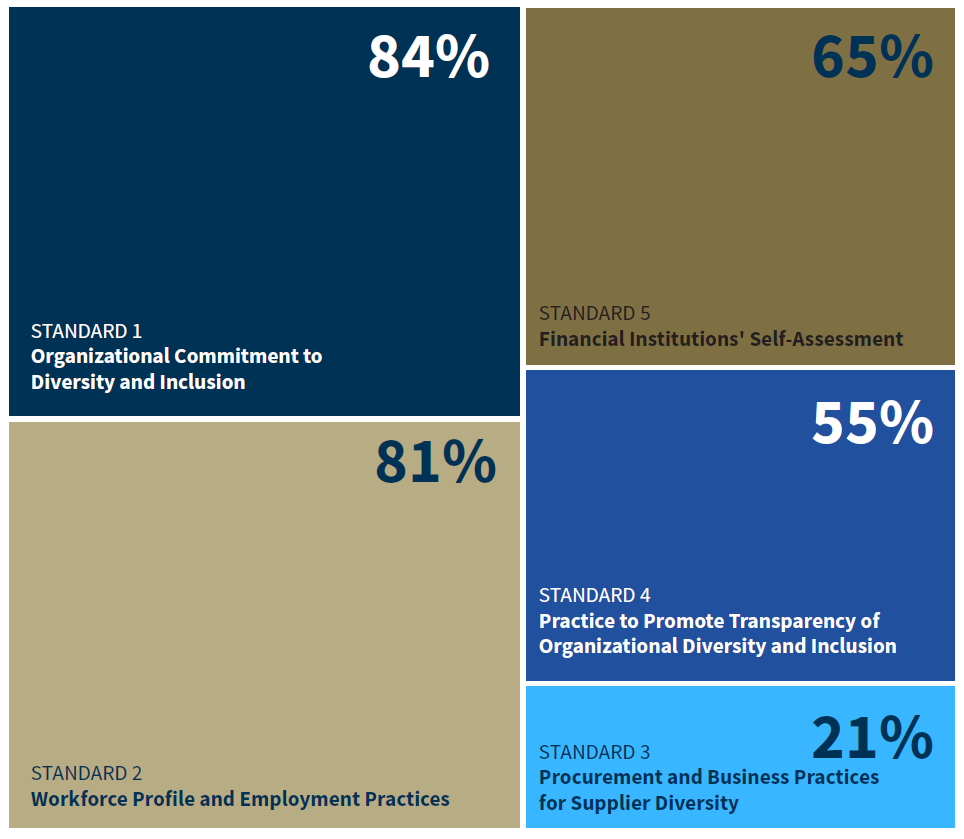
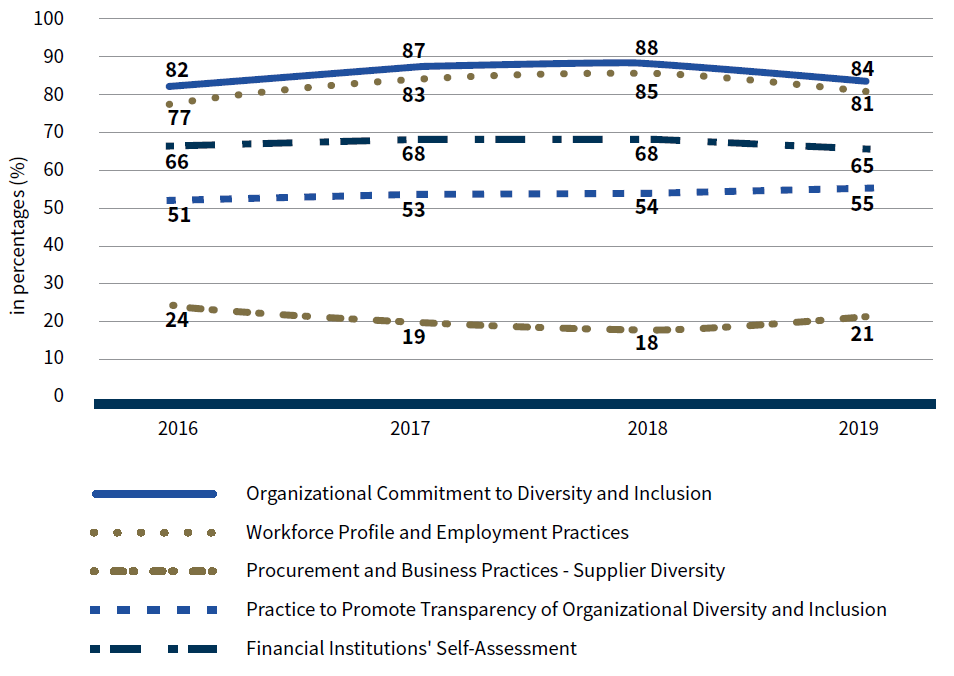
We aggregate the financial institutions’ affirmative responses for each Standard as a measure of support for the individual assessment Standards. A higher percent of financial institutions that respond “Yes” to the Standard leading practices indicate strong support across the responding institutions. The percent of affirmative responses for each Standard has remained consistent across reporting periods (2016-2019), even though the universe of financial institutions that submit a diversity self-assessment varies from year to year.
For the 2019 assessment, responding institutions continue to show strong support for Standards 1 and 2. Adoption of supplier diversity policies and practices among the same institutions remains low in comparison.
| Diversity Self Assessment 2016-2019 Reporting Periods | |||||
|---|---|---|---|---|---|
| Reporting Periods | Organizational Commitment to Diversity and Inclusion | Workforce Profile and Employment Practices | Procurement and Business Practices - Supplier Diversity | Practice to Promote Transparency of Organizational Diversity and Inclusion | Financial Institutions' Self-Assessment |
| 2016 | 82 | 77 | 66 | 51 | 24 |
| 2017 | 87 | 83 | 68 | 53 | 19 |
| 2018 | 88 | 85 | 68 | 54 | 18 |
| 2019 | 84 | 81 | 65 | 55 | 21 |
In addition, some responding institutions also provide narrative information about their diversity practices that addressed each Standard. We have made it a practice to highlight these exemplary practices for possible adoption by other financial institutions.
Increasing Transparency on Challenges
Our financial institutions have shared with us in the diversity self-assessment some challenges in maturing their diversity programs. We appreciate their willingness to be open so we may learn and provide assistance in the future. Our financial institutions identify challenges in their diversity and inclusion practices:
- Location and size are factors that may challenge small community banks’ ability to grow their diversity and inclusion program that may extend to their ability to recruit, hire, retain, and promote a diverse workforce. Diversity and inclusion programs are not one-size-fits-all. For example, institutions in rural areas may have limited access to the types of diverse talent pools available in urban communities.
- A key challenge that these institutions have identified is limited opportunities for advancement due to lean staffing strategies. However, institutions that struggle to recruit a diverse pool of candidates have increased their efforts to participate in diversity job fairs, and they continue to encourage their employees to become actively involved by volunteering in causes and events to interact with a more diverse community. Employee interaction helps build relationships to understand the banking needs of diverse communities better and share information about employment opportunities in the banking industry.
- Although the area of supplier diversity remains a challenge, the 2019 assessment results indicated a slight increase in the percent of affirmative responses over the 2018 reporting period. Overall, responses indicated financial institutions have not widely adopted supplier diversity policies and practices. A diversity leading practice is that companies increasingly understand the competitive advantage of having a broad selection of available suppliers to choose from with respect to factors such as price, quality, attention to detail, and future relationship building.
Despite the challenges, adopting one or more of the exemplary practices discussed below may help financial institutions to successfully increase the diversity of their workforce and suppliers.
Exemplary Practices for 2019
Exemplary practices demonstrate our financial institutions’ commitment to advancing diversity and inclusion, not only in their organization but across the banking industry. Sharing these practices provides useful insights to financial institutions looking to enhance their diversity efforts. Information about exemplary practices may be especially useful to smaller financial institutions that lack resources to engage a diversity consultant or hire staff focused on diversity and inclusion.
Review of financial institutions’ 2019 self-assessments demonstrated the following exemplary diversity practices under the Standards:
Organizational Commitment to Diversity and Inclusion
Senior leadership and board commitment to diversity and inclusion creates a culture that values the contribution of all employees and consultancy to assist in developing a robust diversity strategy. Some examples follow.
- Conducting engagement surveys to gauge workforce’s attitudes, perceptions, and views on diversity.
- Developing a Diversity Committee or formal diversity and inclusion program that is approved by the board to oversee the organizations’ diversity policies and practices.
- Involving senior leadership and board members in developing the diversity strategy to create opportunities, provide corporate training, and hold managers accountable for progress.
Workforce Profile and Employment Practices
The workforce profile provide candidates with information on who you attract as an employer. Exemplary employment practices reflect a culture that welcomes all segments of society in your organization, in recruitment, hiring, and retention.
Recruitment:
- Using minority and women-owned recruitment firms, or notifying recruitment firms of the organization’s commitment to hire a diverse workforce.
- Conducting outreach and recruitment activities at diverse professional organizations, campus job fairs located in the surrounding community, such as community colleges and universities, to help ensure the talent pool includes candidates from various ethnic and socioeconomic backgrounds.
- Building relationships with minority groups and community outreach programs to help job seekers with resume writing techniques, mock interviewing skills, and business etiquette.
Hiring:
- Selecting board members and senior leadership positions from diverse candidate slates and having diverse interview panels.
- Developing an onboarding program for new managers that focuses on the diversity of their team, and the strengths that those team members bring to the department and organization.
- Creating a formal summer internship and development program that is marketed to area colleges and universities (feeder program).
Retention:
- Hosting mentoring events throughout the year where students and employees have the opportunity to learn about the organization’s diversity programs, and build relationships with HR and hiring managers.
- Conducting exit interviews with departing employees and developing strategies for professional growth, focusing on career development and personal skill development.
- Implementing formal development programs for key management positions creating a succession pipeline for future promotional opportunities by developing knowledge, skills, and abilities of diverse employees.
Procurement and Business Practices - Supplier Diversity
Reporting results in the area of supplier diversity continues to remain a challenge across the industry. Most of the reporting financial institutions do not have procedures in place to adequately track the diversity in their procurement spending practices. However, despite the challenge noted, there were some exemplary practices identified.
- Having a published Supplier Diversity Policy Statement signed by executive management.
- Establishing supplier diversity goals to ensure the inclusion of diverse suppliers for opportunities.
- Promoting a diverse supplier pool by partnering with supplier advocacy groups, and marketing with their local affiliates to identify and invite diverse businesses to participate in sourcing projects.
- Soliciting diverse businesses to become potential vendor partners through a dedicated supplier diversity webpage.
Monitoring, Tracking and Reporting on Diversity Practices
A key benefit of using the FDIC diversity self-assessment analysis results is to conduct an external benchmark exercise against peers to identify underutilization of women and minorities in employment practices, determine how to improve diversity and inclusion initiatives, and identify areas of strength and diversity gaps to support a more inclusive workplace and diverse workforce. Other benefits of participating in the FDIC diversity self-assessment include:
- Using quantitative and qualitative measures to assess diversity and inclusion efforts internally (workforce) and externally (outreach).
- Tracking supplier diversity metrics in quarterly, annually, and year-over-year procurement spend (dollars and percentage) with ethnically and racially diverse, women, veteran, people with disabilities, LGBTQ+ owned, and small businesses.
- Practicing transparency by making a public commitment to diversity and inclusion that includes the metrics it uses to measure success in both workplace and supplier diversity, and by posting diversity policies, practices, strategies and assessments on social media, corporate website, and careers page.
Conclusion
As we continue to build relationships with our financial institutions and learn their programs, we are in a better position to provide technical assistance. Our financial institutions are invaluable partners in promoting a safer, fairer, more inclusive banking system for all Americans. Since 2016, the FDIC has been encouraging its regulated financial institutions to share their diversity and inclusion policies and practices by voluntarily completing and submitting their FID-SA.
Each year the response rate of financial institutions with 100 or more employees has averaged around 19 percent. Greater participation would enhance the financial services industry as a whole. A diverse workforce and inclusive culture help financial institutions to connect with the local community and an increasingly diverse customer base. To meet the evolving banking needs of customers, it is important for the diverse perspectives from all the communities to be represented at the table.
The 2019 analysis found that the financial institutions continue to employ a variety of methods and approaches to identify, attract, recruit, retain and train a diverse workforce. And, while smaller banks have noted their limited resources, methods were nonetheless improvised to implement diversity into their workforce diversity practices. The self–assessment data also identifies areas where additional diversity guidance could be useful and beneficial to the industry. Based on supplemental information included in assessment data, OMWI has prepared informational resources to provide guidance to strengthen diversity programs. FID Program resources are available at https://www.fdic.gov/about/diversity/fidr.html.
For the 2020 reporting period, OMWI will continue to conduct outreach to promote more voluntary participation in the assessment. This outreach will provide education about the program, encourage submission through the electronic FID-SA application, and promote the benefits of sharing diversity data.
Appendix 1
Aggregated Assessment Results
Results by FDIC Region
Financial Institutions by FDIC Region
The chart shows the number of responses received by FDIC region. The bar graph representing the response rate by region shows the aggregated number of self-assessments received (blue) against the number of financial institutions that were invited to conduct a diversity self-assessment for 2019 (gold). Although the New York region had the highest number of submissions (43), the Chicago region had the highest response rate, at 24 percent. Atlanta had the lowest number of submissions; however the Dallas region had the lowest response rate, at 12 percent.
| Financial Institutions by FDIC Regions (2019) | |||
|---|---|---|---|
| FDIC Regional Office Location | Number of Financial Institutions Invited | Number of Financial Institutions Submitted | Response Rate 2019 |
| Atlanta | 96 | 16 | 17% |
| Chicago | 135 | 32 | 24% |
| Dallas | 161 | 20 | 12% |
| Kansas City | 97 | 22 | 23% |
| New York | 190 | 43 | 23% |
| San Francisco | 108 | 19 | 18% |
Overall Breakdown by Each Standard
Section I - Financial Institution Information
Ninety-one percent of the 152 financial institutions reported having a designated Diversity and Inclusion Officer. Thirty-five percent of the financial institutions have an individual designated as the Supplier Diversity Officer.
| Section I. Financial Institution Information | ||
|---|---|---|
| Diversity and Inclusion Officers | Yes Responses |
Percentage |
| 1. Does your organization have a Diversity and Inclusion Officer or Equivalent? | 139 | 91% |
| 2. Does your organization have a Supplier Diversity Officer or Equivalent? | 53 | 35% |
Section II - Assessment of the Financial Institution's Diversity Policies and Practices
This section summarizes the aggregated results of the 2019 diversity self-assessments by standard.
Standard 1: Organizational Commitment to Diversity and Inclusion
Responses to this Standard reflect how the leadership of an organization with successful diversity policies and practices demonstrates its commitment to diversity and inclusion. This is important because leadership comes from the governing body, such as a board of directors, as well as senior officials and those managing the organization on a day-to-day basis. Demonstrated leadership commitment fosters a corporate culture that embraces diversity and inclusion.
A high percentage of respondents reported having an organizational commitment to Diversity and Inclusion within their financial institutions, from the governing body to senior officials and managers. On average, 84 percent of the 152 financial institutions indicated that they practice the Standards outlined in this subsection. Ninety–three percent of responding financial institutions take proactive steps to promote a diverse pool of candidates in their hiring, recruiting, retention, and promotion, as well as in their selection of board members, senior management, and other senior leadership positions.
The lowest affirmative responses are to Questions 1.2 and 1. 3. The affirmative response rate to Question 1.2 The financial Institution has a diversity and inclusion policy that is approved and supported by senior leadership, including senior management and the board of directors, is 78 percent. The affirmative response rate to Question 1.3, The financial institution provides regular progress reports to the board and senior management, is 71 percent.
| 1. Organizational Commitment to Diversity and Inclusion | Yes Responses |
Percentage |
|---|---|---|
| 1.1 The financial institution includes diversity and inclusion considerations in both employment and contracting as an important part of its strategic plan for recruiting, hiring, retention, and promotion. | 137 | 90% |
| 1.2 The financial institution has a diversity and inclusion policy that is approved and supported by senior leadership, including senior management and the board of directors. | 119 | 78% |
| 1.3 The financial institution provides regular progress reports to the board and senior management. | 108 | 71% |
| 1.4 The financial institution regularly conducts training and provides educational opportunities on equal employment opportunity and on diversity and inclusion. | 128 | 84% |
| 1.5 The financial institution has a senior level official, preferably with knowledge of and experience in diversity and inclusion policies and practices, who oversees and directs the financial institution’s diversity and inclusion efforts. | 136 | 89% |
| 1.6 The financial institution takes proactive steps to promote a diverse pool of candidates, including women and minorities, in its hiring, recruiting, retention, and promotion, as well as in its selection of board members, senior management, and other senior leadership positions. | 142 | 93% |
| Averages: | 128 | 84% |
Standard 2: Workforce Profile and Employment Practices
Responses to this Standard reflect how financial institutions promote the fair inclusion of minorities and women in their workforce by publicizing employment opportunities, creating relationships with minority and women professional organizations and educational institutions, creating a culture that values the contribution of all employees, and encouraging a focus on these objectives when evaluating the performance of managers. Financial institutions with successful diversity and inclusion programs also regularly evaluate their programs and identify areas to be improved.
The highest affirmative response rate, 95 percent, related to Question 2.2, the financial institution ensures equal employment opportunities for all employees and applicants for employment and does not engage in unlawful employment discrimination based on gender, race or ethnicity. The lowest affirmative response rates were to the questions under Question 2.3, The financial institutions has policies and practices that create diverse applicant pools for both internal and external opportunities. The affirmative response rate for each of the three sub-questions ranged between 68 to 74 percent. Overall, an average of 81 percent responded that they practice the Standards outlined in this subsection.
| 2. Workforce Profile and Employment Practices | Yes Responses |
Percentage |
|---|---|---|
| 2.1 The financial institution implements policies and practices related to workforce diversity and inclusion in a manner that complies with all applicable laws. | 143 | 94% |
| 2.2 The financial institution ensures equal employment opportunities for all employees and applicants for employment and does not engage in unlawful employment discrimination based on gender, race, or ethnicity. | 145 | 95% |
| 2.3 The financial institution has policies and practices that create diverse
applicant pools for both internal and external opportunities that may
include: 2.3(a) Outreach to minority and women organizations. |
112 | 74% |
| 2.3(b) Outreach to educational institutions serving significant minority and women student populations. | 107 | 70% |
| 2.3(c) Participation in conferences, workshops, and other events to attract minorities and women and to inform them of employment and promotion opportunities. | 103 | 68% |
| 2.4 The financial institution utilizes both quantitative and qualitative measurements to assess its workforce diversity and inclusion efforts. These efforts may be reflected, for example, in applicant tracking, hiring, promotions, separations (voluntary and involuntary), career development, and retention across all levels and occupations of the financial institution, including the executive and managerial ranks. | 130 | 86% |
| 2.5 The financial institution holds management at all levels accountable for diversity and inclusion efforts, for example, by ensuring that such efforts align with business strategies and individual performance plans. | 122 | 80% |
| Averages: | 123 | 81% |
Standard 3: Procurement and Business Practices - Supplier Diversity
Responses to this Standard reflects how organizations increasingly understand the competitive advantage of having a broad selection of available suppliers to choose from with respect to factors such as price, quality, attention to detail, and future relationship building. A number of financial institutions have achieved success at expanding available business options by increasing outreach to minority-owned and women-owned businesses. Financial institutions often use metrics to identify the baseline of how much they spend contracting for goods and services, how much they spend with minority-owned and women-owned businesses, and the availability of relevant minority-owned and women-owned businesses, as well as changes over time. Similarly, financial institutions may use outreach to inform minority-owned and women-owned businesses (and affinity groups representing these constituencies) of these opportunities and of the procurement process. In addition, financial institutions’ prime contractors often use subcontractors to fulfill the obligations of various contracts. The use of minority-owned and women-owned businesses as subcontractors provides valuable opportunities for both the minority-owned and women-owned businesses and the prime contractor. Financial institutions may encourage the use of minority-owned and women-owned subcontractors by incorporating this objective in their business contracts.
The overall affirmative responses related to Procurement and Business Practices for Supplier Diversity averaged 21 percent. The average affirmative response rate to the seven questions ranged from 16 to 30 percent. The highest affirmative response rate (30 percent) related to the financial institution having a supplier diversity policy that provides for a fair opportunity for minority-owned and women-owned businesses to compete for procurement of business goods and services. The lowest affirmative response rate (16 percent) related to contracts with minority-owned and women-owned business subcontractors.
| 3. Procurement and Business Practices - Supplier Diversity | Yes Responses |
Percentage |
|---|---|---|
| 3.1 The financial institution has a supplier diversity policy that provides for a fair opportunity for minority-owned and women-owned businesses to compete for procurement of business goods and services. This includes contracts of all types, including contracts for the issuance or guarantee of any debt, equity, or security, the sale of assets, the management of the financial institution’s assets, and the development of the financial institution’s equity investments. | 45 | 30% |
| 3.2 The financial institution has methods to evaluate its supplier diversity,
which may include metrics and analytics related to: 3.2(a) Annual procurement spending. |
36 | 24% |
| 3.2(b) Percentage of contract dollars awarded to minority-owned and women-owned businesses by race, ethnicity, and gender. | 27 | 18% |
| 3.2(c) Percentage of contracts with minority-owned and women-owned business subcontractors. | 24 | 16% |
| 3.3 The financial institution has practices to promote a diverse supplier pool,
which may include: 3.3(a) Outreach to minority-owned and women-owned contractors and representative organizations. |
32 | 21% |
| 3.3(b) Participation in conferences, workshops, and other events to attract minority-owned and women-owned firms and inform them of contracting opportunities. | 28 | 18% |
| 3.3(c) An ongoing process to publicize its procurement opportunities. | 27 | 18% |
| Averages: | 31 | 21% |
Standard 4: Practice to Promote Transparency of Organizational Diversity and Inclusion
Responses to this Standard reflect how financial institutions’ transparency and publicity are important aspects of assessing diversity policies and practices. This is important because greater awareness and transparency give the public information to assess those policies and practices. Financial institutions publicize information about diversity and inclusion efforts through normal business methods, which include displaying information on their websites, in their promotional materials, and in their annual reports to shareholders, if applicable. By publishing a financial institution’s commitment to diversity and inclusion, its plans for achieving diversity and inclusion, and the metrics it uses to measure success in both workplace and supplier diversity, a financial institution informs a broad constituency of investors, employees, potential employees, suppliers, customers, and the general community about its efforts. The publication of this information can make new markets accessible for minorities and women and illustrate the progress made toward an important business goal.
The affirmative response rate for the questions about financial institutions practices that promote diversity and inclusion transparency ranged from 28 percent to 78 percent, averaging 55 percent. Seventy-eight percent of respondents publicize their current employment and procurement opportunities, whereas 28 percent forecast their potential employment and procurement opportunities.
| 4. Practice to Promote Transparency of Organizational Diversity and Inclusion | Yes Responses |
Percentage |
|---|---|---|
| 4.1 The financial institution publicizes its diversity and inclusion strategic plan. | 56 | 37% |
| 4.2 The financial institution publicizes its policy on its commitment to diversity and inclusion. | 108 | 71% |
| 4.3 The financial institution is transparent about its progress toward achieving diversity and inclusion in its workforce and procurement activities, which may include the financial institution's current workforce and supplier demographic profiles. | 88 | 58% |
| 4.4 The financial institution publicizes its opportunities to promote diversity, which may include: 4.4(a) Current employment and procurement opportunities. |
119 | 78% |
| 4.4(b) Forecasts of potential employment and procurement opportunities. | 43 | 28% |
| 4.4(c) The availability and use of mentorship and developmental programs for employees and contractors | 87 | 57% |
| Averages: | 84 | 55% |
Standard 5: Financial Institutions' Self-Assessment
Responses to this Standard reflects how financial institutions that have successful diversity policies and practices allocate time and resources to monitoring and evaluating performance under their diversity policies and practices on an ongoing basis. Financial institutions are encouraged to disclose their diversity policies and practices, as well as information related to their assessments, to the FDIC and the public. Disclosure includes but is not limited to producing a diversity progress report on website about workforce and supplier diversity as well as highlighting partnership success between the financial institution and organization(s).
The average affirmative response rate for questions about this standard was 65 percent. In response to Question 5.3, about publishing information pertaining to their assessment of diversity policies and practices, 30 percent of financial institutions answered yes. In response to Questions 5.1 and 5.2, about conducting an annual assessment of diversity policies and practices, and monitoring and evaluating performance under diversity policies and practices on an ongoing basis, 84 percent and 80 percent of financial institutions, respectively, responded yes.
| 5. Financial Institutions' Self-Assessment | Yes Responses |
Percentage |
|---|---|---|
| 5.1 The financial institution conducts an assessment of its diversity policies and practices annually | 127 | 84% |
| 5.2 The financial institution monitors and evaluates its performance under its diversity policies and practices on an ongoing basis. | 122 | 80% |
| 5.3 The financial institution publishes information pertaining to its assessment of its diversity policies and practices. | 46 | 30% |
| Averages: | 98 | 65% |
Section III - Financial Institution Information
Subsection 1: Workforce Profile
The Standards encourage financial institutions to promote the fair inclusion of minorities and women in their workforce. Financial institutions reported on the diversity in their workforce, management, and Board members. The aggregated numbers are provided below. Workforce diversity is greatest in the total workforce, lower in management and even lower in Board membership. In the aggregate, responding financial institutions reported representation of women as follows: 63 percent of the workforce; 37 percent of management, and 16 percent of Board members. Again in the aggregate, responding financial institutions reported representation of minorities as follows: 32 percent in the workforce, 12 percent of management, and 6 percent of Board members.
| Diversity Data | Total | Women (#) |
Women (%) |
Men (#) |
Men (%) |
Minorities (#) |
Minorities (%) |
Non- Minorities (#) |
Non- Minorities (%) |
|---|---|---|---|---|---|---|---|---|---|
| Workforce | 157,601 | 99,446 | 63% | 58,155 | 37% | 51,216 | 32% | 106,385 | 68% |
| Management | 11,049 | 4,065 | 37% | 6,984 | 63% | 1,363 | 12% | 9,686 | 88% |
| Board Members | 1,667 | 270 | 16% | 1,397 | 84% | 107 | 6% | 1,560 | 94% |
Subsection 2: Procurement-Supplier Diversity
Similarly, the Standards promote active outreach to minority and women-owned businesses in the procurement process. However, the responses indicate most of the financial institutions do not have procedures in place to adequately track the diversity in their procurement spending practices. The metrics reported for supplier diversity spending are not sufficient to draw any conclusions or trends for this reporting period.
Appendix 2
Trend Analysis of Self-Assessment Results: Reporting Periods 2016-2019
The 2016 reporting period provided the baseline for the trend analysis, since that was the year the FDIC began collecting diversity assessment information.
The unprecedented crises created by a worldwide pandemic of historic proportions has had an understandable impact on all segments of society, including the financial industry. Recognizing the severity of the current environment, the FDIC shifted its priorities and made adjustments to best meet the immediate needs of its regulated financial institutions to ensure their focus and priorities were on the wellbeing of their employees and public consumers. Despite the crisis, responses for the 2019 reporting period have increased over the last three reporting period years, reaching a 19 percent response rate. The FDIC received 152 diversity self-assessments from its regulated financial institutions having 100 or more employees, a 60 percent increase over the first 2016 reporting period submissions.
The chart below illustrates a comparison of responding FDIC-regulated financial institutions for each reporting period, from 2016 to 2019.
| Reporting Period | # Financial Institutions (Invited) |
# Self- Assessments Received |
% Self- Assessments Received |
# Acknowledged Non- Respondents |
#MDIs |
|---|---|---|---|---|---|
| 2016 | 805 | 95 | 11.81% | 2 | 10 |
| 2017 | 820 | 137 | 16.71% | 3 | 8 |
| 2018 | 784 | 133 | 16.96% | 3 | 7 |
| 2019 | 787 | 152 | 19.31% | 16 | 6 |
Out of the 152 responding institutions, the FDIC has received repeat submissions from 33 institutions for all four reporting periods. Eighty financial institutions previously submitted responses for 2016, 2017 or 2018, but not all three reporting periods. FDIC received 39 first-time submissions from financial institutions for the 2019 reporting period.
Overall Breakdown by FDIC Region for Reporting Period 2016 to 2019
Financial Institutions by FDIC Region
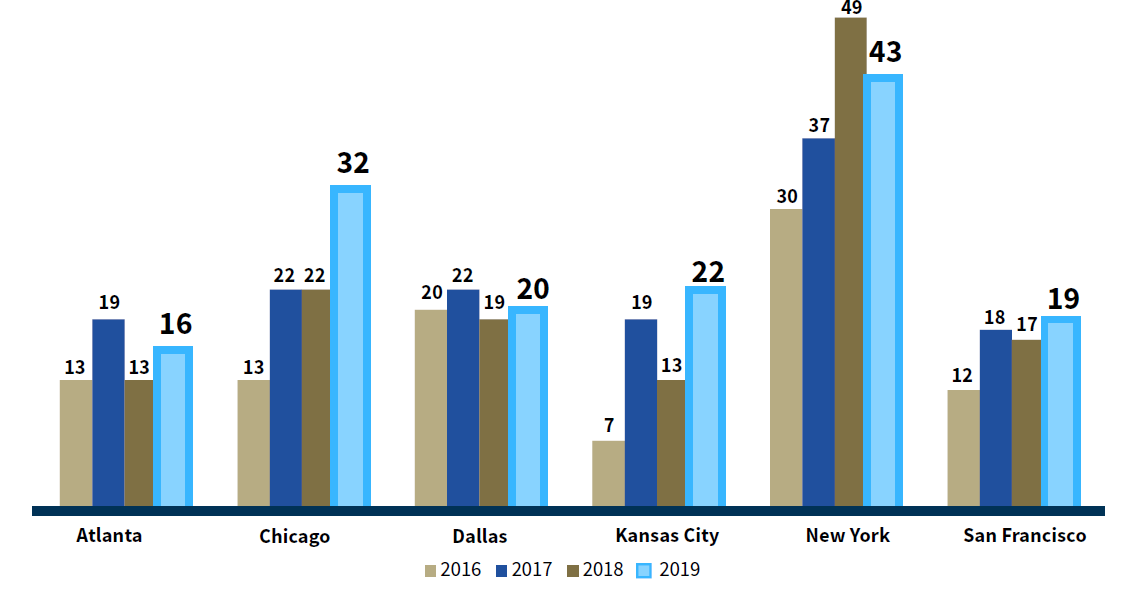
For the 2019 reporting period, the response rate increased in five regions, with Kansas City having the highest increase in response rate (69 percent) over the 2018 reporting period, followed by Chicago (45 percent) and Atlanta (23 percent). For the last three reporting periods, the response rate for the Chicago region has been the second highest among the FDIC’s six regions (22 percent in 2017, 22 percent in 2018, and 32 percent in 2019, respectively). However, the Chicago region had the highest response rate (24 percent) for the 2019 reporting period.
| Atlanta | Chicago | Dallas | Kansas City |
New York |
San Francisco |
|
|---|---|---|---|---|---|---|
| 2016 | 13 | 13 | 20 | 7 | 30 | 12 |
| 2017 | 19 | 22 | 22 | 19 | 37 | 18 |
| 2018 | 13 | 22 | 19 | 13 | 49 | 17 |
| 2019 | 16 | 32 | 20 | 22 | 43 | 19 |
| Reporting Period | Atlanta | Chicago | Dallas | Kansas City |
New York |
San Francisco |
|---|---|---|---|---|---|---|
| 2016 | 12% | 9% | 13% | 8% | 14% | 11% |
| 2017 | 18% | 15% | 14% | 21% | 18% | 17% |
| 2018 | 13% | 16% | 12% | 14% | 24% | 17% |
| 2019 | 17% | 24% | 12% | 23% | 23% | 18% |
Aggregated Assessment Results for Reporting Period 2016 to 2019: Comparative Breakdown by Each Standard
Section I - Financial Institution Information
The data from the 2016 to the 2019 reporting period showed a steady and consistent increase of financial institutions having a designated Diversity and Inclusion Officer. There was a 16 percent increase from 2018 to 2019 (from 120 to 139 financial institutions). Similarly, the data reflect an increase in the percentage of institutions that have a designated Supplier Diversity Officer from 2016 to 2019, although the percentage was lower in 2019 (53 percent) than in 2018 (58 percent). The universe of reporters changes from year to year, so the data do not necessarily indicate that some reporters eliminated a Supplier Diversity Officer position.
| Diversity and Inclusion Officers | 2016 | 2017 | 2018 | 2019 |
|---|---|---|---|---|
| 1. Does your organization have a Diversity and Inclusion Officer of Equivalent? |
81 | 82 | 120 | 139 |
| 2. Does your organization have a Supplier Diversity Officer of Equivalent? |
44 | 41 | 58 | 53 |
Section II - Assessment of the Financial Institution's Diversity Policies and Practices
The table below represents the submission results across the five Standards for each consecutive reporting period (2016 through 2019). A breakdown for each of the five Standards is reported on the following pages.
| 2016 95 Institutions |
2017 137 Institutions |
2018 133 Institutions |
2019 152 Institutions |
|
|---|---|---|---|---|
| 1. Organizational Commitment to Diversity and Inclusion | 82% | 87% | 88% | 84% |
| 2. Workforce Profile and Employment Practices | 77% | 83% | 85% | 81% |
| 3. Procurement and Business Practices - Supplier Diversity | 24% | 19% | 18% | 21% |
| 4. Practice to Promote Transparency of Organizational Diversity and Inclusion | 51% | 53% | 54% | 55% |
| 5. Financial Institutions’ Self- Assessment | 66% | 68% | 68% | 65% |
Subsection 1: Organizational Commitment to Diversity and Inclusion
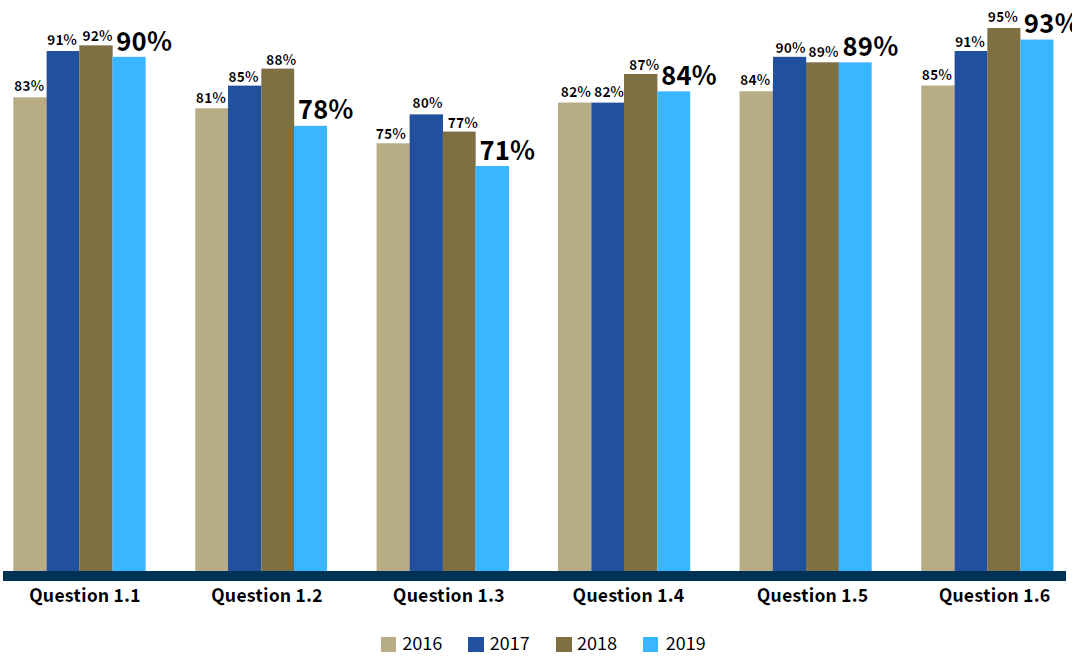
Based on the 2016 to 2019 data, the responding financial institutions demonstrate their organizational commitment to diversity and inclusion, with an overall average of 85 percent across the four reporting periods. Affirmative responses to questions in this subsection decreased by four percentage point from 2018 to 2019 (from 88 percent to 84 percent). Responses for the 2019 reporting period reflect an overall decline across all questions relating to organizational commitment to diversity and inclusion from the 2018 reporting period, with the exception of responses to Question 1.5, which did not change. The largest decrease (10 percent) was in reference to Question 1.2, about financial institutions having a diversity and inclusion policy that is approved and supported by senior leadership, including senior management and the board of directors (88 percent in 2018 to 78 percent in 2019).
| 1. Organizational Commitment to Diversity and Inclusion | 2016 | 2017 | 2018 | 2019 |
|---|---|---|---|---|
| 1.1 The financial institution includes diversity and inclusion considerations in both employment and contracting as an important part of its strategic plan for recruiting, hiring, retention, and promotion. | 83% | 91% | 92% | 90% |
| 1.2 The financial institution has diversity and inclusion policy that is approved and supported by senior leadership, including senior management and the board of directors. | 81% | 85% | 88% | 78% |
| 1.3 The financial institution provides regular progress reports to the board and senior management. | 75% | 80% | 77% | 71% |
| 1.4 The financial institution regularly conducts training and provides educational opportunities on equal employment opportunity and on diversity and inclusion. | 82% | 82% | 87% | 84% |
| 1.5 The financial institution has a senior level official, preferably with knowledge of and experience in diversity and inclusion policies and practices, who oversees and directs the financial institution's diversity and inclusion efforts. | 84% | 90% | 89% | 89% |
| 1.6 The financial institution takes proactive steps to promote a diverse pool of candidates, including women and minorities, in its hiring, recruiting, retention, and promotion, as well as in its selection of board members, senior management, and other senior leadership positions. | 85% | 91% | 95% | 93% |
| Average: | 82% | 88% | 92% | 84% |
Subsection 2: Workforce Profile and Employment Practices
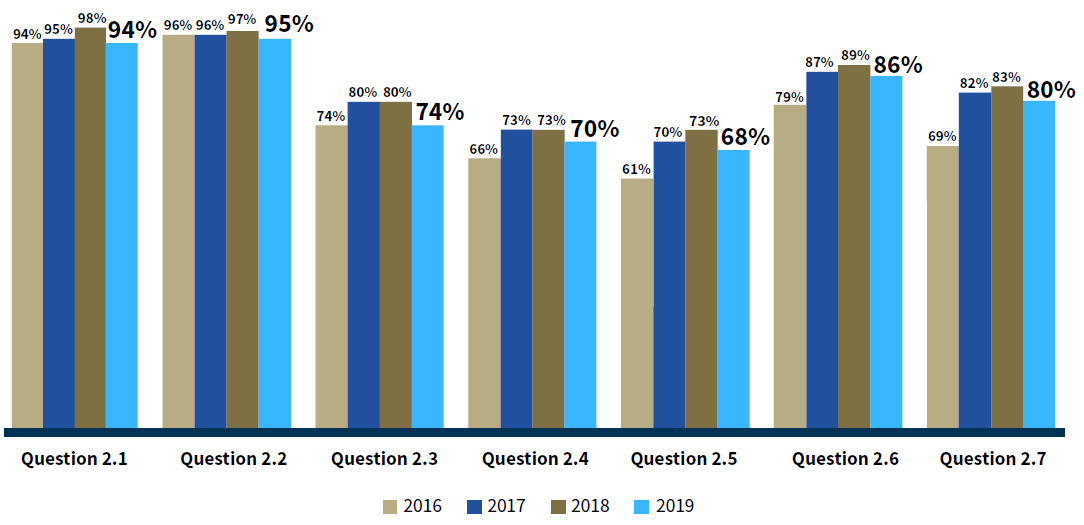
Responding financial institutions reported positively to their workforce profile and employment practices, with an overall average of 81 percent across the four reporting periods, 2016 through 2019. Responses for the 2019 reporting period reflected an overall decline across all questions.
This section resulted in a four percentage point decrease in 2019 (81 percent) since the 2018 reporting period (85 percent). The largest decrease (6 percent) was in response to Question 2.3(a), The financial institution has policies and practices that create diverse applicant pools for both internal and external opportunities that may include outreach to minority and women organizations (80 percent in 2018 to 74 percent in 2019).
| 2. Workforce Profile and Employment Practices | 2016 | 2017 | 2018 | 2019 |
|---|---|---|---|---|
| 2.1 The financial institution implements policies and practices related to workforce diversity and inclusion in a manner that complies with all applicable laws. | 94% | 95% | 98% | 94% |
| 2.2 The financial institution ensures equal employment opportunities for all employees and applicants for employment and does not engage in unlawful employment discrimination based on gender, race, or ethnicity. | 96% | 96% | 97% | 95% |
| 2.3 The financial institution has policies and practices that create diverse applicant pools for both internal and external opportunities that may include: 2.3(a) Outreach to minority and women organizations. |
74% | 80% | 80% | 74% |
| 2.3(b) Outreach to educational institutions serving significant minority and women student populations. | 66% | 73% | 73% | 70% |
| 2.3(c) Participation in conferences, workshops, and other events to attract minorities and women and to inform them of employment and promotion opportunities. | 61% | 70% | 73% | 68% |
| 2.4 The financial institution utilizes both quantitative and qualitative measurements to assess its workforce diversity and inclusion efforts. These efforts may be reflected, for example, in applicant tracking, hiring, promotions, separations (voluntary and involuntary), career development, and retention across all levels and occupations of the financial institution, including the executive and managerial ranks. | 79% | 87% | 89% | 86% |
| 2.5 The financial institution holds management at all levels accountable for diversity and inclusion efforts, for example, by ensuring that such efforts align with business strategies and individual performance plans. | 69% | 82% | 83% | 80% |
| Average | 77% | 83% | 85% | 81% |
Subsection 3: Procurement and Business Practices - Supplier Diversity
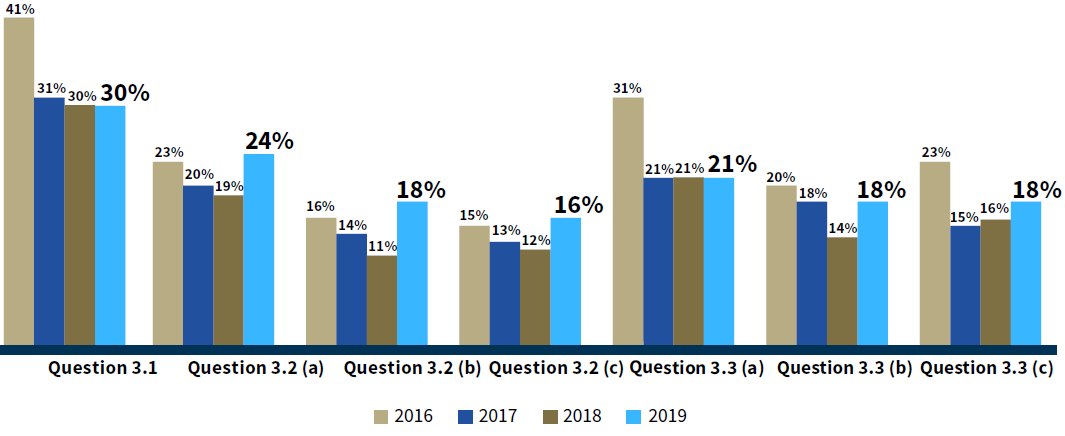
Responses to Subsection 3, Procurement and Business Practices, consistently have demonstrated that supplier diversity is an area of challenge. The percentage of affirmative responses has averaged 20 percent across the four reporting periods, 2016 through 2019.
Despite Supplier Diversity being an area of challenge, results for the 2019 responses trended slightly upward (3 percent) over the 2018 reporting period (21 percent and 18 percent, respectively). The largest increase in affirmative responses (7 percentage points) over the 2018 results was associated with Question 3.2(b), Percentage of contract dollars awarded to minority-owned and women-owned businesses by race, ethnicity, and gender (18 percent in 2019 and 11 percent in 2018).
| 3. Procurement and Business Practices – Supplier Diversity | 2016 | 2017 | 2018 | 2019 |
|---|---|---|---|---|
| 3.1 The financial institution has supplier diversity policy that provides for a fair opportunity for minority-owned and women-owned businesses to compete for procurement of business goods and services. This includes contracts of all types, including contracts for the issuance or guarantee of any debt, equity, or security, the sale of assets, the management of the financial institution's assets, and the development of the financial institution's equity investments. | 41% | 31% | 30% | 30% |
| 3.2 The financial institution has methods to evaluate its supplier diversity, which may include metrics and analytics related to 3.2(a) Annual procurement spending. |
23% | 20% | 19% | 24% |
| 3.2(b) Percentage of contract dollars awarded to minority-owned and women-owned businesses by race, ethnicity, and gender. | 16% | 14% | 11% | 18% |
| 3.2(c) Percentage of contracts with minority-owned and women-owned business subcontractors. | 15% | 13% | 12% | 16% |
| 3.3 The financial institution has practices to promote a diverse supplier pool, which may include: 3.3(a) Outreach to minority-owned and women-owned contractors and representative organizations. |
31% | 21% | 21% | 21% |
| 3.3(b) Participation in conferences, workshops, and other events to attract minority-owned and women-owned firms and inform them of contracting opportunities. | 20% | 18% | 14% | 18% |
| 3.3(c) An ongoing process to publicize its procurement opportunities. | 23% | 15% | 16% | 18% |
| Average: | 24% | 19% | 18% | 21% |
Subsection 4: Practice to Promote Transparency of Organizational Diversity and Inclusion
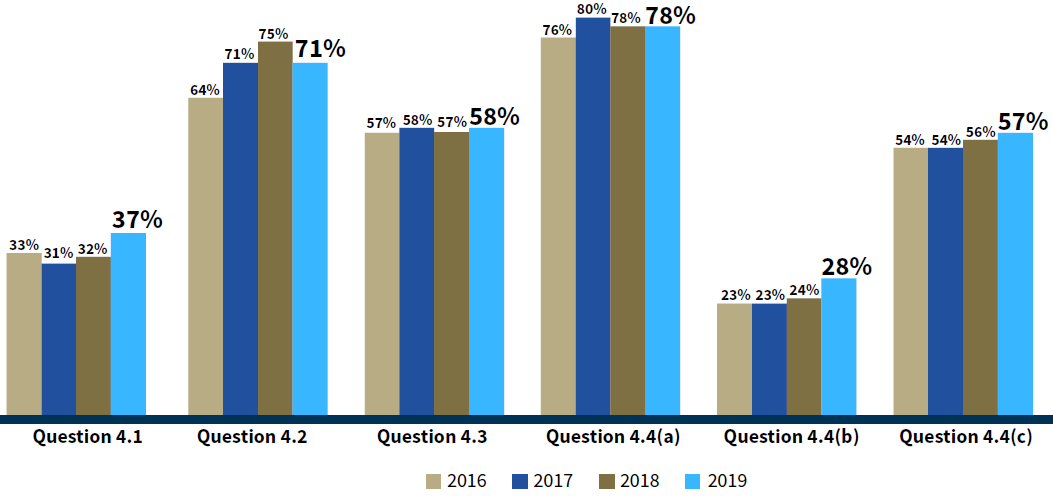
Affirmative responses to questions about promoting transparency with respect to organizational diversity and inclusion averaged 53 percent across all reporting periods. The rate of affirmative responses was one percentage point higher in 2019 (55 percent) than in the previous reporting period (54 percent). The greatest increase (five percentage points) related to Question 4.1, The financial institution publicizes its diversity and inclusion strategic plan (37 percent in 2019 and 32 percent in 2018). The largest decrease in affirmative responses (4 percentage points) was related to Question 4.2., The financial institution publicizes its policy on its commitment to diversity and inclusion (71 percent in 2019 and 75 percent in 2018).
| 4. Practice to Promote Transparency of Organizational Diversity and Inclusion | 2016 | 2017 | 2018 | 2019 |
|---|---|---|---|---|
| 4.1 The financial institution publicizes its diversity and inclusion strategic plan. | 33% | 31% | 32% | 37% |
| 4.2 The financial institution publicizes its policy on its commitment to diversity and inclusion. | 64% | 71% | 75% | 71% |
| 4.3 The financial institution is transparent about its progress toward achieving diversity and inclusion in its workforce and procurement activities, which may include the financial institution's current workforce and supplier demographic profiles. | 57% | 58% | 57% | 58% |
| 4.4 The financial institution publicizes its opportunities to promote diversity, which may include: 4.4(a) Current employment and procurement opportunities. |
76% | 80% | 78% | 78% |
| 4.4(b) Forecasts of potential employment and procurement opportunities. | 23% | 23% | 24% | 28% |
| 4.4(c) The availability and use of mentorship and developmental programs for employees and contractors. | 54% | 54% | 56% | 57% |
| Average: | 51% | 53% | 54% | 55% |
Subsection 5: Financial Institutions' Self-Assessment
Affirmative responses to questions about the assessment of financial institution’s diversity policies and practices averaged 66 percent across all four reporting periods. There was an average four percentage point reduction reported for the 2019 financial institutions’ self-assessment compared with the 2018 reporting period (65 percent and 68 percent, respectively). The largest decrease (7 percentage points) was associated with Question 5.1, The financial institution conducts a self-assessment of its diversity policies and practices annually (84 percent in 2019 and 91 percent in 2018).
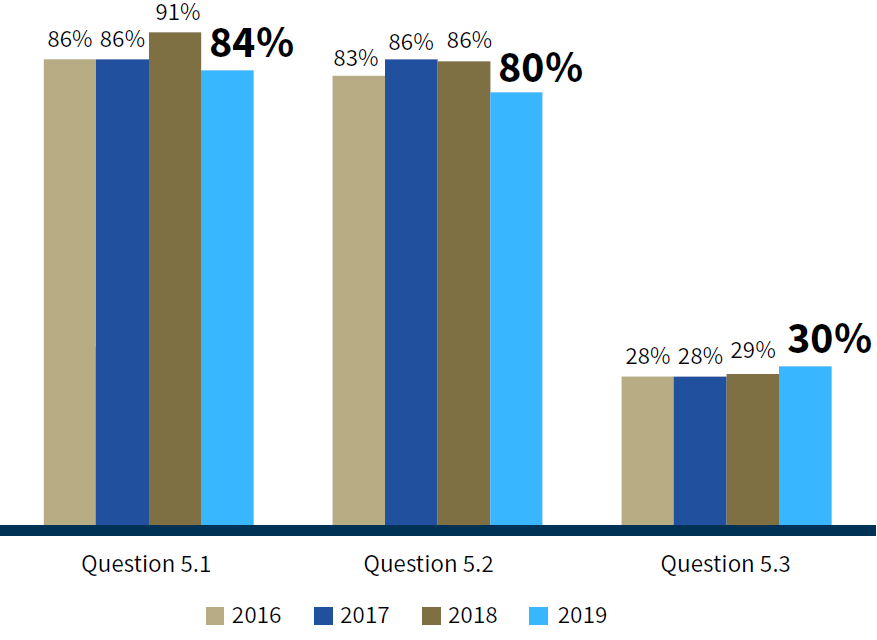
| 5. Financial Institutions' Self-Assessment | 2016 | 2017 | 2018 | 2019 |
|---|---|---|---|---|
| 5.1 The financial institution conducts an assessment of its diversity policies and practices annually. | 86% | 87% | 91% | 84% |
| 5.2 The financial institution monitors and evaluates its performance under its diversity policies and practices on an ongoing basis. | 83% | 87% | 86% | 80% |
| 5.3 The financial institution publishes information pertaining to its assessment of its diversity policies and practices. | 28% | 29% | 29% | 30% |
| Average: | 66% | 68% | 68% | 65% |
Section III - Diversity Data
Subsection 1: Workforce Profile
For the 2019 reporting period, 93 percent of responding institutions shared the diversity data on their workforce. Consistent with previous years, diversity in the workforce remains high overall but notably lower at the management and Board member levels.
The FDIC has developed informational guides for its regulated financial institutions to develop or improve diversity policies and practices relating to Workforce Profile and Employment Practices, highlighting the importance of diversity in the workplace and to assist its regulated financial institutions through best practices observed in the industry. This informational guide is available at https://www.fdic.gov/about/diversity/guidance-diversity-workforce.html.
Subsection 2: Procurement-Supplier Diversity
Supplier diversity as a whole is challenging to the regulated financial institutions. For the reporting period 2016 through 2019, 17 percent of institutions report that they are able to track spend data. Consistently, there has not been enough data to analyze or to determine trends for the procurement supplier diversity subsection to establish an accurate portrayal of industry practices.
The FDIC has developed guidance for its regulated financial institutions to develop or improve diversity policies and practices relating to Procurement and Business Practices for Supplier Diversity, highlighting the importance of supplier diversity and to assist its regulated financial institutions through best practices observed in the industry. This informational guide is posted at https://www.fdic.gov/about/diversity/guidance-supplier-diversity.html.