
Analysis of Diversity Self- Assessments for 2018

Executive Summary
Section 342 of the Dodd-Frank Wall Street Reform and Consumer Protection Act of 2010 (Dodd-Frank Act) requires OMWI agencies to report on the diversity self-assessment data received from their respective regulated institutions annually to Congress.
OMWI agencies have, independently, collected the important data they receive to report on diversity progress and trends to raise awareness of diversity policies and practices in an effort to benefit the financial services industry as a whole. Participation from FDIC's regulated financial institutions having 100 or more employees has increased slightly every reporting year.
During the 2018 reporting year, the FDIC invited 784 of its regulated institutions to participate in conducting their annual diversity self-assessment. From the 784 institutions, 133 (16.9 percent) responded with their voluntary submissions. The compiled results are aggregated and shared anonymously to provide opportunities for the financial community to develop or enhance their diversity and inclusion policies to help them achieve their strategic goals. The self-assessments received have also enabled OMWI to identify exemplary practices that financial institutions have implemented as part of their workforce recruitment, supplier diversity procurement, and training practices.
About the FDIC's Financial Institution Diversity Program
Section 342 of the Dodd-Frank Act required federal financial regulatory agencies to establish an Office of Minority and Women Inclusion (OMWI), and instructed the OMWI director at each agency to develop standards for assessing the diversity policies and practices of the institutions they regulate. The Standards are intended to promote transparency and awareness of diversity policies and practices within the financial industry. "The Interagency Policy Statement Establishing Joint Standards for Assessing the Diversity Policies and Practices of Entities Regulated by the Agencies," became effective on June 10, 2015.
The FDIC worked closely with the OMWIs of the Board of Governors of the Federal Reserve System (FRB) and the Office of the Comptroller of the Currency (OCC) to collectively develop a framework to promote transparency and awareness of diversity policies and practices within the financial industry. In early 2017, the FDIC obtained approval from the Office of Management and Budget (OMB) to collect assessment information from regulated entities to assist and strengthen diversity programs in financial institutions through a self-assessment instrument, FDIC Form 2710/05, Diversity Self-Assessment of FDIC Regulated Financial Institutions (OMB 3064-0200, Expiration Date 02/29/2020). The instrument provides the framework for regulated financial institutions to assess and strengthen diversity policies and practices, and covers the following areas derived from the Policy Statement:
- Organizational Commitment to Diversity and Inclusion
- Workforce Profile and Employment Practices
- Procurement and Business Practices – Supplier Diversity
- Practices to Promote Transparency of Organizational Diversity and Inclusion
- Entity's Self-Assessment
FDIC-regulated financial institutions began using and voluntarily submitting diversity self-assessments to the FDIC's OMWI for the 2016 reporting period. Results of the FDIC's 2016 analysis established the baseline for subsequent reporting periods. All completed analyses are posted internally and on the external web site, https://www.fdic.gov/about/diversity/analysisdsa.html.
2018 Reporting Period Analysis
Introduction
In January 2019, the FDIC's OMWI Director distributed a letter to the Presidents and Chief Executive Officers of 784 FDIC-regulated financial institutions identified as having 100 or more employees. The letter informed these institutions about the process for conducting and voluntarily submitting their diversity information to the FDIC. In March 2019, a reminder letter from the Director was distributed to financial institutions to encourage participation, and extended the submission deadline to April 2019. The FDIC received diversity self-assessments from 133 (16.9 percent) of its regulated financial institutions.
The FDIC completed an analysis of the financial industry's diversity policies and practices for the 2018 reporting period and a comparative analysis against the 2016 and 2017 reporting periods, for the purpose of monitoring progress and trends of diversity and inclusion in employment and contracting activities. The analysis further provided the opportunity to identify exemplary diversity policies and practices.
OMWI has observed that the reporting results have remained consistent over the last two reporting periods, for 2017 and 2018. The FDIC is looking to increase its outreach efforts to further encourage and guide its regulated financial institutions to implement policies and practices, and share their completed self-assessments to further raise awareness aiming to improve levels of diversity and inclusion throughout the financial industry as a whole.
Any questions about the diversity self-assessment should be directed to OMWI at BankDiversity@FDIC.gov.
Overall Breakdown by FDIC Region and Asset Size
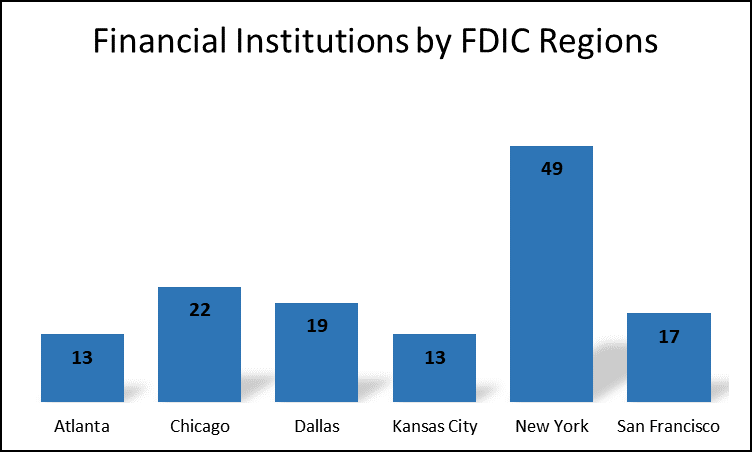
Financial Institutions by FDIC Regional Offices
The self-assessments were aggregated by FDIC region, with the New York region having the most financial institutions (49) reporting; and the Chicago region following, with 22 reported financial institutions. Both, the Atlanta and Kansas City regions had the lowest reporting financial institutions, with 13 each.
| Financial Institutions by FDIC Regions (2018) | |
|---|---|
| FDIC Regional Office Location | Number of Institutions |
| Atlanta | 13 |
| Chicago | 22 |
| Dallas | 19 |
| Kansas City | 13 |
| New York | 49 |
| San Francisco | 17 |
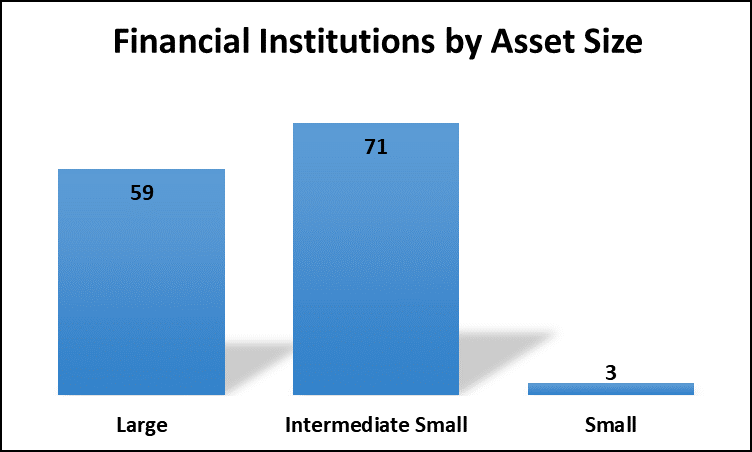
Financial Institutions by Asset Size
Financial institutions were further aggregated by asset size, which are divided by Small, Intermediate Small, and Large1. Most of the FDIC's regulated financial institutions that completed a self-assessment fall in the Intermediate Small category (71 financial institutions). Fifty-nine were Large institutions and three were Small.
| Financial Institutions by Asset Size (2017) | |
|---|---|
| Financial Institutions | Total |
| Large | 59 |
| Intermediate Small | 71 |
| Small | 3 |
1 Reference FFIEC's Community Reinvestment Act (CRA) https://www.ffiec.gov/CRA/pdf/AssetThreshold2017.pdf
Financial Institutions by Asset Size and FDIC Regional Offices
An analysis between the asset sizes, in relation to the FDIC Regional Offices to which they report, revealed that the largest number of self-assessments was submitted by financial institutions in the New York region (49). Of the 49 institutions, 25 were categorized as Large institutions; 24 were Intermediate Small institutions; and there were no Small institutions reporting. The second largest number of self-assessments was submitted by financial institutions in the Chicago region (22). Of the 22 financial institutions reporting from the Chicago region, 12 were categorized as Large; 8 were Intermediate Small; and there were two Small institutions. Atlanta and Kansas City had the lowest reporting financial institutions, with 13 from each region. Of the 13 financial institutions reporting from Atlanta, seven were Large institutions; six were Intermediate Small; and there were no Small institutions. Of the 13 financial institutions reporting from Kansas City, four were Large, nine were Intermediate Small, and there were no Small institutions.
| Small Institution | |
|---|---|
| FDIC Regional Office Location | Number of Institutions |
| Atlanta | 0 |
| Chicago | 2 |
| Dallas | 1 |
| Kansas City | 0 |
| New York | 0 |
| San Francisco | 0 |
| Total | 3 |
| Intermediate Small Institution | |
|---|---|
| FDIC Regional Office Location | Number of Institutions |
| Atlanta | 6 |
| Chicago | 8 |
| Dallas | 15 |
| Kansas City | 9 |
| New York | 24 |
| San Francisco | 9 |
| Total | 71 |
| Large Institution | |
|---|---|
| FDIC Regional Office Location | Number of Institutions |
| Atlanta | 7 |
| Chicago | 12 |
| Dallas | 3 |
| Kansas City | 4 |
| New York | 25 |
| San Francisco | 8 |
| Total | 59 |
Self-Assessment Summary Results for the 2018 Reporting Period
The percentage of responses received for the 2018 reporting period increased slightly over the last 2017 reporting period.
Although, financial institutions that responded to the five Standards, were fairly consistent with their 2017 reporting year responses, notable improvements were observed in designations of diversity officer roles:
- 90 percent reported having a Diversity & Inclusion Officer, or equivalent, designated; an increase of 46 percent over 2017 submission responses.
- 44 percent reported having a Supplier Diversity Officer, or equivalent, designated; an increase of 41 percent over 2017 submission responses.
The diversity self-assessment results remained consistently low with previous years in the area of supplier diversity in procurement and business practices, where only 30 percent of responding financial institutions reported having a supplier diversity policy. However, given the 41 percent increase in Supplier Diversity Officer designations over the 2017 reporting period, it appears that there is a demonstrable increase in financial institutions' awareness of the importance of implementing this Standard into their diversity policies and practices, which should translate into an increase in future supplier diversity reporting results.
Aggregated Assessment Results: Overall Breakdown by Each Standard
Section I – Financial Institution Information
Ninety percent of the 133 financial institutions reported having a designated Diversity and Inclusion Officer; while 44 percent of the financial institutions have an individual designated as the Supplier Diversity Officer.
| Section I. Financial Institution Information | ||
|---|---|---|
| Diversity and Inclusion Officers | Yes Responses |
Percentage |
| 1. Does your organization have a Diversity and Inclusion Officer or Equivalent? | 120 | 90% |
| 2. Does your organization have a Supplier Diversity Officer or Equivalent? | 58 | 44% |
The breakdown of Diversity and Inclusion Officers by financial institution asset size is reflected in the table, with Intermediate Small Institutions having more designations of Diversity Inclusion Officers. Large institutions have more Supplier Diversity Officers designated; these institutions, however, have a greater capability to implement supplier diversity practices.
| Financial Institutions Reporting by Asset Size | Diversity Inclusion Officers |
Supplier Diversity Officers |
|
|---|---|---|---|
| Large Institution | 59 | 55 | 30 |
| Intermediate Small Institution | 71 | 62 | 27 |
| Small Institution | 3 | 3 | 1 |
| Totals: | 133 | 120 | 58 |
Section II – Assessment of the Financial Institution's Diversity Policies and Practices
Subsection 1: Organizational Commitment to Diversity and Inclusion
A high percentage of respondents reported having an organizational commitment to Diversity and Inclusion within their financial institutions, from the governing body to senior officials and managers. On average, 88 percent of the 133 financial institutions indicated that they practice the Standards outlined in this subsection. An overwhelming 95 percent of responding financial institutions take proactive steps to promote a diverse pool of candidates in their hiring, recruiting, retention, and promotion, as well as in their selection of board members, senior management, and other senior leadership positions.
| Section II. Assessment of the Financial Institution's Diversity Policies and Practices | ||
|---|---|---|
| 1. Organizational Commitment to Diversity and Inclusion | Yes Responses |
Percentage |
| 1.1 The financial institution includes diversity and inclusion considerations in both employment and contracting as an important part of its strategic plan for recruiting, hiring, retention, and promotion. | 123 | 92% |
| 1.2 The financial institution has a diversity and inclusion policy that is approved and supported by senior leadership, including senior management and the board of directors. | 117 | 88% |
| 1.3 The financial institution provides regular progress reports to the board and senior management. | 102 | 77% |
| 1.4 The financial institution regularly conducts training and provides educational opportunities on equal employment opportunity and on diversity and inclusion. | 116 | 87% |
| 1.5 The financial institution has a senior level official, preferably with knowledge of and experience in diversity and inclusion policies and practices, who oversees and directs the financial institution's diversity and inclusion efforts. | 118 | 89% |
| 1.6 The financial institution takes proactive steps to promote a diverse pool of candidates, including women and minorities, in its hiring, recruiting, retention, and promotion, as well as in its selection of board members, senior management, and other senior leadership positions. | 126 | 95% |
| Section II.1 Averages: | 117 | 88% |
Subsection 2: Workforce Profile and Employment Practices
Although there is a range of participation in the financial institutions' promotion of fair inclusion of minorities and women in their workforce by publicizing employment opportunities, creating relationships with minority and women professional organizations and educational institutions, creating a culture that values the contribution of all employees, and encouraging a focus on these objectives when evaluating the performance of managers, the responses were high. The highest percentage, 98 percent, report that their institution implements policies and practices related to workforce diversity and inclusion in a manner that complies with all applicable laws. Seventy-three percent reported that they conduct outreach to educational institutions serving significant minority and women student populations; or, that they participate in outreach to educational institutions serving significant minority and female student populations. Overall, an average of 85 percent responded that they practice the Standards outlined in this subsection.
| Section II. Assessment of the Financial Institution's Diversity Policies and Practices | ||
|---|---|---|
| 2. Workforce Profile and Employment Practices | Yes Responses |
Percentage |
| 2.1 The financial institution implements policies and practices related to workforce diversity and inclusion in a manner that complies with all applicable laws. | 130 | 98% |
| 2.2 The financial institution ensures equal employment opportunities for all employees and applicants for employment and does not engage in unlawful employment discrimination based on gender, race, or ethnicity. | 129 | 97% |
| 2.3 The financial institution has policies and practices that create diverse applicant pools for both internal and external opportunities that may include: 2.3(a) Outreach to minority and women organizations. |
106 | 80% |
| 2.3(b) Outreach to educational institutions serving significant minority and women student populations. | 97 | 73% |
| 2.3(c) Participation in conferences, workshops, and other events to attract minorities and women and to inform them of employment and promotion opportunities. | 97 | 73% |
| 2.4 The financial institution utilizes both quantitative and qualitative measurements to assess its workforce diversity and inclusion efforts. These efforts may be reflected, for example, in applicant tracking, hiring, promotions, separations (voluntary and involuntary), career development, and retention across all levels and occupations of the financial institution, including the executive and managerial ranks. | 118 | 89% |
| 2.5 The financial institution holds management at all levels accountable for diversity and inclusion efforts, for example, by ensuring that such efforts align with business strategies and individual performance plans. | 111 | 83% |
| Section II.2 Averages: | 113 | 85% |
Subsection 3: Procurement and Business Practices - Supplier Diversity
Overall, a low percentage of respondents reported that they have metrics and analytics to monitor how much they spend to procure and contract for goods and services; how much they spend with minority-owned and women-owned businesses; and that they are knowledgeable about the availability of relevant minority-owned and women-owned businesses. On average, 18 percent responded that they practice the Standards outlined in this subsection. The lowest percentage, 11 percent, reported having methods to evaluate its supplier diversity metrics and analytics related to contract dollars awarded to minority- and women-owned businesses by race, ethnicity, and gender; and the highest, 30 percent reported having a supplier diversity policy.
| Section II. Assessment of the Financial Institution's Diversity Policies and Practices | ||
|---|---|---|
| 3. Procurement and Business Practices - Supplier Diversity | Yes Responses |
Percentage |
| 3.1 The financial institution has a supplier diversity policy that provides for a fair opportunity for minority-owned and women-owned businesses to compete for procurement of business goods and services. This includes contracts of all types, including contracts for the issuance or guarantee of any debt, equity, or security, the sale of assets, the management of the financial institution's assets, and the development of the financial institution's equity investments. | 40 | 30% |
| 3.2 The financial institution has methods to evaluate its supplier diversity, which may include metrics and analytics related to: 3.2(a) Annual procurement spending. |
25 | 19% |
| 3.2(b) Percentage of contract dollars awarded to minority-owned and women-owned businesses by race, ethnicity, and gender. | 15 | 11% |
| 3.2(c) Percentage of contracts with minority-owned and women-owned business subcontractors. | 16 | 12% |
| 3.3 The financial institution has practices to promote a diverse supplier pool, which may include: 3.3(a) Outreach to minority-owned and women-owned contractors and representative organizations. |
28 | 21% |
| 3.3(b) Participation in conferences, workshops, and other events to attract minority-owned and women-owned firms and inform them of contracting opportunities. | 18 | 14% |
| 3.3(c) An ongoing process to publicize its procurement opportunities. | 21 | 16% |
| Section II.3 Averages: | 23 | 18% |
Subsection 4: Practice to Promote Transparency of Organizational Diversity and Inclusion
The self-assessments show a wide range in how financial institutions engage in practices that provide greater information, awareness and transparency to the public regarding their diversity and inclusion policies and practices. Seventy-eight percent publicize their current employment and procurement opportunities; whereas, 24 percent forecasts their potential employment and procurement opportunities. On average, 54 percent incorporated practices to promote transparency of their organizational diversity and inclusion.
| Section II. Assessment of the Financial Institution's Diversity Policies and Practices | ||
|---|---|---|
| 4. Practice to Promote Transparency of Organizational Diversity and Inclusion | Yes Responses |
Percentage |
| 4.1 The financial institution publicizes its diversity and inclusion strategic plan. | 43 | 32% |
| 4.2 The financial institution publicizes its policy on its commitment to diversity and inclusion. | 100 | 75% |
| 4.3 The financial institution is transparent about its progress toward achieving diversity and inclusion in its workforce and procurement activities, which may include the financial institution's current workforce and supplier demographic profiles. | 76 | 57% |
| 4.4 The financial institution publicizes its opportunities to promote diversity, which may include: 4.4(a) Current employment and procurement opportunities. |
104 | 78% |
| 4.4(b) Forecasts of potential employment and procurement opportunities. | 32 | 24% |
| 4.4(c) The availability and use of mentorship and developmental programs for employees and contractors | 74 | 56% |
| Section II.4 Averages: | 72 | 54% |
Subsection 5: Financial Institutions' Self-Assessment
A high percentage (91 percent) of financial institutions responded positively to having successful diversity policies and practices, and allocating time and resources to monitor and evaluate performance under their diversity policies and practices on an ongoing basis. However, only 29 percent publish information pertaining to their assessment of diversity policies and practices.
| Section II. Assessment of the Financial Institution's Diversity Policies and Practices | ||
|---|---|---|
| 5. Financial Institutions' Self-Assessment | Yes Responses |
Percentage |
| 5.1 The financial institution conducts an assessment of its diversity policies and practices annually | 121 | 91% |
| 5.2 The financial institution monitors and evaluates its performance under its diversity policies and practices on an ongoing basis. | 114 | 86% |
| 5.3 The financial institution publishes information pertaining to its assessment of its diversity policies and practices. | 38 | 29% |
| Section II5 Averages: | 91 | 68% |
Section III – Diversity Data
Subsection 1: Workforce Profile
The Standards encourage organizations to promote the fair inclusion of minorities and women in their workforce. Financial institutions reported on the diversity in their workforce, management, and board members. The aggregated numbers are provided below. Workforce diversity is greatest in the total workforce, less diverse in management and even less in Board members. For example, financial institutions reported having 68 percent of women in their workforce; however, only 14 percent of women are board members.
| Section III. Diversity Data | |||||||||
|---|---|---|---|---|---|---|---|---|---|
| 4. Workforce | |||||||||
| Diversity Data | Total | Women (#) |
Women (%) |
Men (#) |
Men (%) |
Minorities (#) |
Minorities (%) |
Non- Minorities (#) |
Non- Minorities (%) |
| Workforce | 416,995 | 245,751 | 68% | 170,772 | 28% | 153,119 | 18% | 225,342 | 74% |
| Management | 20,056 | 9,098 | 41% | 10,904 | 53% | 6,075 | 11% | 13,737 | 80% |
| Board Members | 1,367 | 228 | 14% | 2,964 | 74% | 299 | 8% | 1,173 | 80% |
Subsection 2: Procurement-Supplier Diversity
Similarly, the Standards promote active outreach to minority and women-owned businesses in the procurement process. However, it is evident that the majority of financial institutions do not have procedures in place to adequately track the diversity in their procurement spending practices. The metrics reported for the procurement supplier diversity spending are not sufficient to draw any conclusions or trends for the third reporting period. The aggregated results of the diversity data for procurement correlate to the low percentages reported under Section II.3, Procurement and Business Practices - Supplier Diversity.
Exemplary Practices for 2018
The FDIC has identified exemplary practices that financial institutions implemented as part of their workforce diversity and inclusion practices. These practices could be considered by other financial institutions. For example, the 2018 self-assessments demonstrated that financial institutions are:
- Creating programs targeting women and minorities in their financial institutions for promotion and increased leadership skills. These programs have demonstrated an increase in the institutions' hiring of women and minorities due to the increase of their women and minority representation in management positions.
- Creating requirements within their procurement practices to ensure a percentage of minorities and women are included on solicitations.
- Incorporating diversity and inclusion scorecards to the management's dashboard.
- Embedding diversity and inclusion modules into the institutions' leadership and management training.
- Creating programs for the employees to provide hands-on training to students providing opportunities of part-time and full-time employment.
- Adding information about supplier diversity approach to minority and women in corporate manuals for vendor management.
- Incorporating diversity and inclusion goals into annual corporate goals.
- Adding diversity and inclusion evaluations for employees and management to performance management systems.
TREND ANALYSIS OF SELF-ASSESSMENT RESULTS - REPORTING PERIOD 2016 TO 2018
There was an increase from the 2016 reporting period (95 financial institutions) to the 2017 reporting period (137 financial institutions). There was a slight decrease for the 2018 reporting period to 133 from 137 financial institution submissions; however, the percentage of self-assessments received increased in 2018.
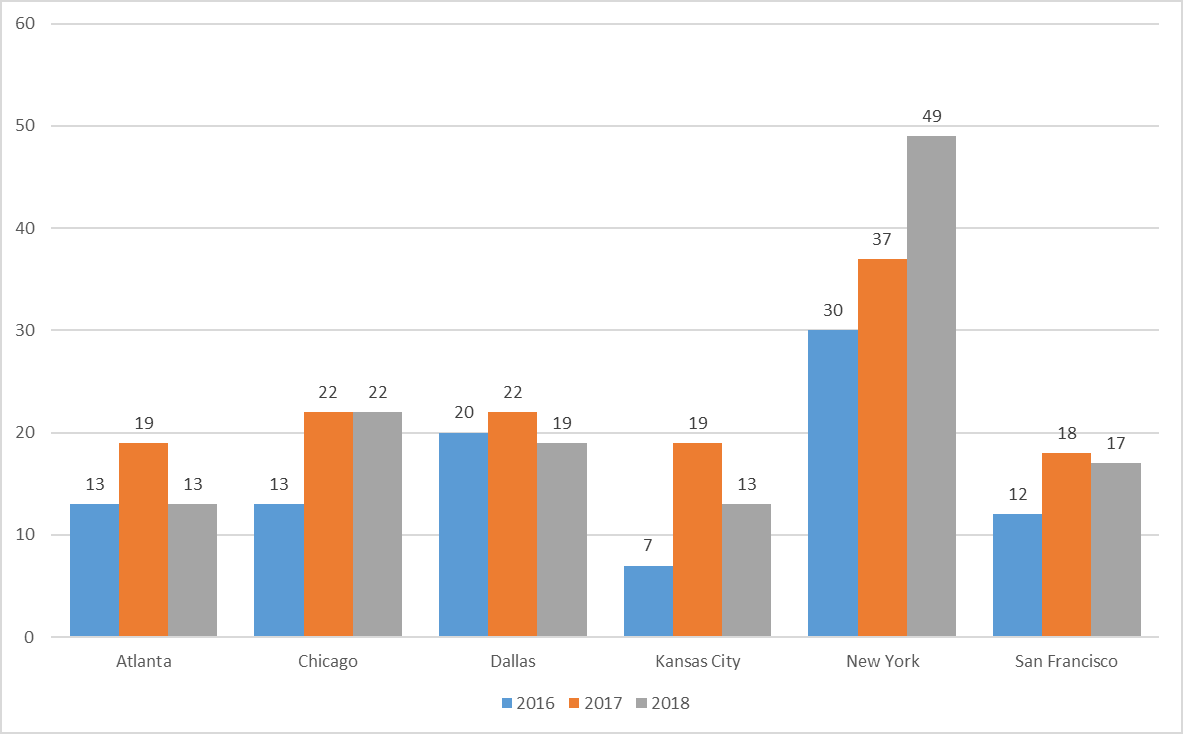
The chart below illustrates a comparison of responding FDIC-regulated financial institutions for the 2016 to 2018 reporting periods.
| Reporting Period | # Financial Institutions (Universe) |
# Self- Assessments Received |
% Self- Assessments Received |
# Acknowledged Non- Respondents |
#MDIs |
|---|---|---|---|---|---|
| 2016 | 805 | 95 | 11.81% | 2 | 10 |
| 2017 | 820 | 137 | 16.71% | 3 | 8 |
| 2018 | 784 | 133 | 16.96% | 3 | 7 |
While the FDIC is pleased with the participation of financial institutions in 2018, it will continue to take steps to increase voluntary participation by augmenting outreach at banking conferences, enhancing financial institution diversity marketing materials, and making improvements to the program website, and developing a strategic roadmap to promote the value of voluntary annual self-assessment submissions.
Overall Breakdown by FDIC Region and Asset Size for Reporting Period 2016 to 2018
Financial Institutions by FDIC Regional Offices
In the 2018 reporting period, four regions showed a decrease in responses. The New York region had the highest percentage of financial institutions reporting– (30 in 2016, 37 in 2017, and 49 in 2018) and then the Chicago region from 16 in 2016, 22 in 2017 and 22 in 2018. Even though the Chicago region had a positive change over time the percent both 2017 and 2018 remained the same, with 22 respondents both years. In 2017, the Atlanta and Kansas City regions both reported had decline of -32 percent of submission from the financial institutions.
| Atlanta | Chicago | Dallas | Kansas City |
New York |
San Francisco |
|
|---|---|---|---|---|---|---|
| 2016 | 13 | 13 | 20 | 7 | 30 | 12 |
| 2017 | 19 | 22 | 22 | 19 | 37 | 18 |
| 2018 | 13 | 22 | 19 | 13 | 49 | 17 |
| 2016-2017 % of change | 46% | 69% | 10% | 171% | 23% | 50% |
| 2017-2018 % of change | -32% | 0% | -14% | -32% | 32% | -6% |
Financial Institutions by Asset Size
Given the increase in the responses received for 2018 over the last 2017 reporting period, the submissions by asset size reflects this. There was an increase in responses from small institutions from two to three (50 percent for 2017-2018) and an increase in large institutions from 54 to 59 (9 percent). An overall increase of 29 percent was achieved from responding intermediate small institutions for all three reporting periods.
| 2016 -2018 Financial Insitution by Asset Size | |||
|---|---|---|---|
| Small | Intermediate Small |
Large | |
| 2016 | 5 | 55 | 35 |
| 2017 | 2 | 81 | 54 |
| 2018 | 3 | 71 | 59 |
| 2016-2017 % of change | -60% | 47% | 54% |
| 2017-2018 % of change | 50% | -12% | 9% |
Aggregated Assessment Results for Reporting Period 2016 to 2018: Comparative Breakdown by Each Standard
Section I – Financial Institution Information
The data for the 2016 to the 2018 reporting period showed an increase for financial institutions with designated Diversity and Inclusion Officers and Supplier Diversity Officers. From 2016 to 2017 reporting period, Diversity and Inclusion Officers increased by one percent (one financial institution) versus 2017 to 2018 with an increase of 46 percent (82 to 120 financial institutions). From 2016 to 2017 reporting period, Supplier Diversity Officers decreased by seven percent (44 to 41 financial institutions) versus 2017 to 2018 with an increase of 41 percent (41 to 58 financial institutions).
| Section I. Financial Institution Information | |||
|---|---|---|---|
| Diversity and Inclusion Officers | 2016 | 2017 | 2018 |
| 1. Does your organization have a Diversity and Inclusion Officer of Equivalent? |
81 | 82 | 120 |
| 2. Does your organization have a Supplier Diversity Officer of Equivalent? |
44 | 41 | 58 |
Section II – Assessment of the Financial Institution's Diversity Policies and Practices
Subsection 1: Organizational Commitment to Diversity and Inclusion
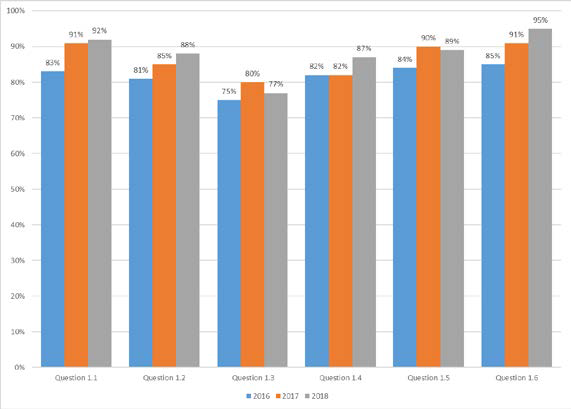
Based on the 2016 to 2018 data, the responding financial institutions continue to demonstrate their commitment to Diversity and Inclusion.
This subsection reflects a one percent increase from 2017 to 2018; but overall, the responses indicated the financial institutions embrace the Standards in this subsection (six percent increase from 2016 to 2018). The highest increase (five percent) was in reference to financial institutions regularly conducts training and provides educational opportunities on equal employment opportunity and on diversity and inclusion.
| Section II. Assessment of the Financial Institution's Diversity Policies and Practices | |||
|---|---|---|---|
| 1. Organizational Commitment to Diversity and Inclusion | 2016 | 2017 | 2018 |
| 1.1 The financial institution includes diversity and inclusion considerations in both employment and contracting as an important part of its strategic plan for recruiting, hiring, retention, and promotion. | 83% | 91% | 92% |
| 1.2 The financial institution has diversity and inclusion policy that is approved and supported by senior leadership, including senior management and the board of directors. | 81% | 85% | 88% |
| 1.3 The financial institution provides regular progress reports to the board and senior management. | 75% | 80% | 77% |
| 1.4 The financial institution regularly conducts training and provides educational opportunities on equal employment opportunity and on diversity and inclusion. | 82% | 82% | 87% |
| 1.5 The financial institution has a senior level official, preferably with knowledge of and experience in diversity and inclusion policies and practices, who oversees and directs the financial institution's diversity and inclusion efforts. | 84% | 90% | 89% |
| 1.6 The financial institution takes proactive steps to promote a diverse pool of candidates, including women and minorities, in its hiring, recruiting, retention, and promotion, as well as in its selection of board members, senior management, and other senior leadership positions. | 85% | 91% | 95% |
| Section II.1 Average: | 82% | 88% | 92% |
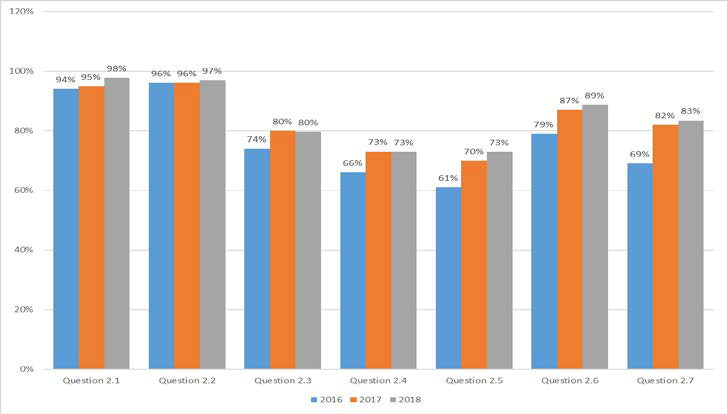
Subsection 2: Workforce Profile and Employment Practices
The workforce profile and employment practice had the highest average change from 2016 to 2018 (eight percent increase). These numbers indicated the financial institutions embraced the Standards in this subsection with continual average increase. Areas of strength are reflected in responses to questions 2.1 and 2.2, which have reported consistently high over the past three reporting years that relate to the implementation of policies and practices that comply with applicable laws, and ensuring equal employment opportunities. The highest overall positive change from 2016 to 2018 (12 percent) referred to participation in conferences, workshops, and other events to attract minorities and inform them of employment and promotion opportunities.
| Section II. Assessment of the Financial Institution's Diversity Policies and Practices | |||
|---|---|---|---|
| 2. Workforce Profile and Employment Practices | 2016 | 2017 | 2018 |
| 2.1 The financial institution implements policies and practices related to workforce diversity and inclusion in a manner that complies with all applicable laws. | 94% | 95% | 98% |
| 2.2 The financial institution ensures equal employment opportunities for all employees and applicants for employment and does not engage in unlawful employment discrimination based on gender, race, or ethnicity. | 96% | 96% | 97% |
| 2.3 The financial institution has policies and practices that create diverse applicant pools for both internal and external opportunities that may include: 2.3(a) Outreach to minority and women organizations. |
74% | 80% | 80% |
| 2.3(b) Outreach to educational institutions serving significant minority and women student populations. | 66% | 73% | 73% |
| 2.3(c) Participation in conferences, workshops, and other events to attract minorities and women and to inform them of employment and promotion opportunities. | 61% | 70% | 73% |
| 2.4 The financial institution utilizes both quantitative and qualitative measurements to assess its workforce diversity and inclusion efforts. These efforts may be reflected, for example, in applicant tracking, hiring, promotions, separations (voluntary and involuntary), career development, and retention across all levels and occupations of the financial institution, including the executive and managerial ranks. | 79% | 87% | 89% |
| 2.5 The financial institution holds management at all levels accountable for diversity and inclusion efforts, for example, by ensuring that such efforts align with business strategies and individual performance plans. | 69% | 82% | 83% |
| Section II.2 Average | 77% | 83% | 85% |
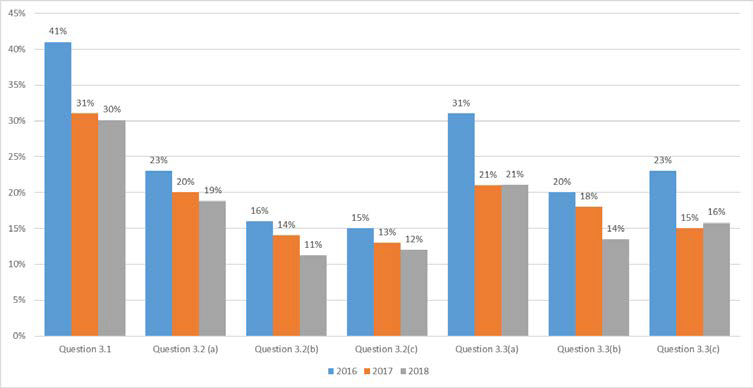
Subsection 3: Procurement and Business Practices - Supplier Diversity
Procurement and Business Practices - Supplier Diversity is on a slightly downward trend, with a decrease of one percent from 2017 to 2018 and a six percent decrease from 2016 to 2018. Over the last three reporting periods, there has been a six percent (2016- 24 to 2018- 19) decrease in response to the supplier diversity data. Overall, responses to Subsection 3, Procurement and Business Practices have consistently demonstrated that supplier diversity is an area of challenge. Responding financial institutions continue to report low levels of supplier diversity engagement, with the lowest percentage awarding to minority or women-owned businesses or subcontractors.
| Section II. Assessment of the Financial Institution's Diversity Policies and Practices | |||
|---|---|---|---|
| 3. Procurement and Business Practices – Supplier Diversity | 2016 | 2017 | 2018 |
| 3.1 The financial institution has supplier diversity policy that provides for a fair opportunity for minority-owned and women-owned businesses to compete for procurement of business goods and services. This includes contracts of all types, including contracts for the issuance or guarantee of any debt, equity, or security, the sale of assets, the management of the financial institution's assets, and the development of the financial institution's equity investments. | 41% | 31% | 30% |
| 3.2 The financial institution has methods to evaluate its supplier diversity, which may include metrics and analytics related to 3.2(a) Annual procurement spending. |
23% | 20% | 19% |
| 3.2(b) Percentage of contract dollars awarded to minority-owned and women-owned businesses by race, ethnicity, and gender. | 16% | 14% | 11% |
| 3.2(c) Percentage of contracts with minority-owned and women-owned business subcontractors. | 15% | 13% | 12% |
| 3.3 The financial institution has practices to promote a diverse supplier pool, which may include: 3.3(a) Outreach to minority-owned and women-owned contractors and representative organizations. |
31% | 21% | 21% |
| 3.3(b) Participation in conferences, workshops, and other events to attract minority-owned and women-owned firms and inform them of contracting opportunities. | 20% | 18% | 14% |
| 3.3(c) An ongoing process to publicize its procurement opportunities. | 23% | 15% | 16% |
| Section II.3 Average: | 24% | 19% | 18% |
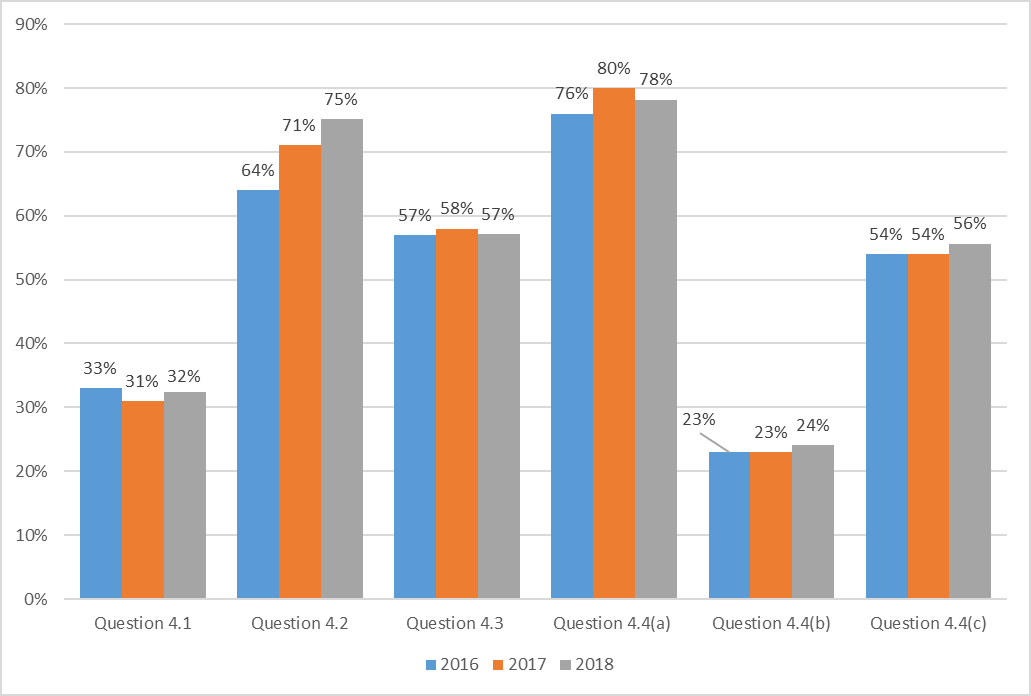
Subsection 4: Practice to Promote Transparency of Organizational Diversity and Inclusion
The practice to promote transparency of organizational diversity and inclusion had slight increase from 2017 to 2018 by one percent in overall average. The highest positive change (four percent) referred to a financial institution publicizing its policy on its commitment to diversity and inclusion. There were slight or no change for other questions regarding transparent of organizational diversity and inclusion.
| Section II. Assessment of the Financial Institution's Diversity Policies and Practices | |||
|---|---|---|---|
| 4. Practice to Promote Transparency of Organizational Diversity and Inclusion | 2016 | 2017 | 2018 |
| 4.1 The financial institution publicizes its diversity and inclusion strategic plan. | 33% | 31% | 32% |
| 4.2 The financial institution publicizes its policy on its commitment to diversity and inclusion. | 64% | 71% | 75% |
| 4.3 The financial institution is transparent about its progress toward achieving diversity and inclusion in its workforce and procurement activities, which may include the financial institution's current workforce and supplier demographic profiles. | 57% | 58% | 57% |
| 4.4 The financial institution publicizes its opportunities to promote diversity, which may include: 4.4(a) Current employment and procurement opportunities. |
76% | 80% | 78% |
| 4.4(b) Forecasts of potential employment and procurement opportunities. | 23% | 23% | 24% |
| 4.4(c) The availability and use of mentorship and developmental programs for employees and contractors. | 54% | 54% | 56% |
| Section II.4 Average: | 51% | 53% | 54% |
Subsection 5: Financial Institutions' Self-Assessment
There were no changes to the subsection, the average for financial institutions performing their annual self-assessment from 2016 to 2018. Financial institutions are still reluctant to publish information pertaining to assessments of their diversity policies and practices, and results remain low at 29 percent. Financial institutions conducting an assessment of its diversity policies and practices annually increased by four percent.
| Section II. Assessment of the Financial Institution's Diversity Policies and Practices | |||
|---|---|---|---|
| 5. Financial Institutions' Self-Assessment | 2016 | 2017 | 2018 |
| 5.1 The financial institution conducts an assessment of its diversity policies and practices annually. | 86% | 87% | 91% |
| 5.2 The financial institution monitors and evaluates its performance under its diversity policies and practices on an ongoing basis. | 83% | 87% | 86% |
| 5.3 The financial institution publishes information pertaining to its assessment of its diversity policies and practices. | 28% | 29% | 29% |
| Section II.5 Average: | Average: 66% | Average: 68% | Average: 68% |
Section III – Diversity Data
Subsection 1: Workforce Profile
In the combined 2016 to 2018 reporting periods, approximately 80 percent of the financial institutions reported diversity data on their workforces, management, and board members.
Subsection 2: Procurement-Supplier Diversity
The data provided from 2016 to 2018 is inconclusive. There simply was not enough data to analyze or to determine trends for the procurement supplier diversity subsection. We hope 2019 responses will provide more data to review and analyze. The information collected in this section could allow FDIC to provide guidance on any data that seems challenges. As for now, it appears that supplier diversity as a whole is challenging to financial institutions.
OMWI OUTREACH
In May of 2019, the FDIC's OMWI prepared a video that was available on the FDIC YouTube Channel. OMWI Director Saul Schwartz described the FDIC's Financial Institution Diversity Program and encourages FDIC-regulated financial institutions having 100 or more employees to conduct annual self-assessments of their diversity policies and practices as outlined in the Policy Statement.
Additionally, the OMWIs from six financial regulatory agencies held the second annual "Financial Regulatory Agencies' Diversity and Inclusion Summit" at the Federal Reserve Bank of Chicago on Thursday, October 24, 2019, that included: the Federal Reserve System Board of Governors (FRB); the Consumer Financial Protection Bureau (CFPB); the Federal Deposit Insurance Corporation (FDIC); the National Credit Union Administration (NCUA); the Office of the Comptroller of the Currency (OCC); and the U.S. Securities and Exchange Commission (SEC). The goal of the Summit was to bring together organizations in the financial industry that included entities regulated by the OMWI agencies in order to highlight industry best practices involving diversity and inclusion in employment and procurement practices. Speakers from various segments of the financial industry discussed practices they have successfully implemented within their organizations to advance diversity and promote inclusion in the workplace, and to increase opportunities for diverse suppliers. The Summit also featured a panel discussion with the OMWI Directors from FDIC, OCC, NCUA, and FRB to share highlights on the results of self-assessments agencies received under Section 342 of the Dodd-Frank Act. The OMWI Directors hope these industry outreach events will encourage participants from financial institutions to complete and submit their diversity self-assessments to their respective regulatory OMWI agency. The completed self-assessments contribute to the reports the agencies prepare, providing trends on diversity and inclusion in the financial industry.
On November 20, 2019, the FDIC's OMWI participated with the Federal Reserve and the OCC in a webinar hosted by the American Bankers Association (ABA) about the joint standards for assessing diversity and inclusion policies and practices, titled "Diversity: What Bankers Need to Know about the Diversity Self-Assessment." The webinar was developed for institutions of all sizes to learn about leading practices and gain a useful understanding about the agencies' collection and reporting of the voluntary submissions of diversity self-assessments received. The webinar, and all relevant material can be accessed from ABA's web page: https://www.aba.com/banking-topics/operations/diversity-equity-inclusion
Each of these outreach efforts focus on the value of conducting voluntary self-assessments and annually submitting assessment results to OMWI Directors as well as making diversity information transparent to the public that will continue to advance the visibility and adoption of diversity and inclusion practices in the financial industry.
CONCLUSION
Since 2016, the FDIC has been encouraging its regulated financial institutions to share their diversity and inclusion policies and practices by voluntarily completing and submitting their Financial Institution Diversity Self-Assessment. Each year the number of participating financial institutions having 100 or more employees that conduct a diversity self-assessment increases slightly, with 2018 submissions totaling 16.9 percent. And, although the FDIC is pleased with the 16.9 percent response rate, greater participation is necessary in order for the data to be meaningful for the financial services industry as a whole.
The FDIC is looking to increase its outreach efforts to further encourage and guide its regulated financial institutions to implement policies and practices, and share their completed self-assessments to further raise awareness aiming to improve levels of diversity and inclusion throughout the financial industry as a whole.
In 2020 the FDIC is working on initiatives that will streamline and improve its Financial Institution Diversity Program by developing a Strategic Roadmap to promote the value of financial institutions conducting diversity self-assessments, and an application that will automate the diversity self-assessment and facilitate financial institutions' electronic submission.
FDIC Chairman Jelena McWilliams appreciates the financial institutions that have repeatedly conducted self-assessments for the previous reporting years, and request that you continue to voluntarily conduct your diversity self-assessment for the 2019 reporting period. However, in order for the FDIC to continue to fulfill the mandates of the Dodd-Frank Act pertaining to Financial Institution Diversity, Chairman McWilliams encourages the participation from all regulated financial institutions, particularly those having 100 or more employees, to voluntarily complete the diversity self-assessment for the 2019 reporting year. As a reminder, all submissions received are safe-guarded and treated as confidential commercial information; and the reported data is aggregated to not identify any institution.