
Analysis of Diversity Self- Assessments for 2017

Section 342 of the Dodd-Frank Act required federal financial regulatory agencies to establish an Office of Minority and Women Inclusion (OMWI), and instructed the OMWI director at each agency to develop standards for assessing the diversity policies and practices of the institutions they regulate. The Standards are intended to promote transparency and awareness of diversity policies and practices within the financial industry. "The Interagency Policy Statement Establishing Joint Standards for Assessing the Diversity Policies and Practices of Entities Regulated by the Agencies," became effective on June 10, 2015.
The FDIC worked closely with the OMWIs of the Board of Governors of the Federal Reserve System (FRB) and the Office of the Comptroller of the Currency (OCC) to collectively develop a framework to promote transparency and awareness of diversity policies and practices within the financial industry. In early 2017, the FDIC obtained approval from the Office of Management and Budget (OMB) to collect assessment information from regulated entities to assist and strengthen diversity programs in financial institutions through a self-assessment instrument, FDIC Form 2710/05, Diversity Self-Assessment of FDIC Regulated Financial Institutions (OMB 3064-0200, Expiration Date 02/29/2020). The instrument provides the framework for regulated financial institutions to assess and strengthen diversity policies and practices, and covers the following areas derived from the Policy Statement:
- Organizational Commitment to Diversity and Inclusion
- Workforce Profile and Employment Practices
- Procurement and Business Practices – Supplier Diversity
- Practices to Promote Transparency of Organizational Diversity and Inclusion
- Entity's Self-Assessment
FDIC-regulated financial institutions began using and voluntarily submitting diversity self-assessments to the FDIC's OMWI for the 2016 reporting period. Results of the FDIC's 2016 analyses established the baseline for subsequent reporting periods. All completed analyses are posted internally and on the external web site, https://www.fdic.gov/about/diversity/rerpt2016.html.
2017 REPORTING BACKGROUND
In November 2017, the FDIC's OMWI Director distributed a letter to the Presidents and Chief Executive Officers of 820 FDIC-regulated financial institutions identified as having 100 or more employees. The letter informed these institutions about the process for conducting and voluntarily submitting their diversity information to the FDIC. In March 2018, a reminder letter from the Director was distributed to financial institutions to encourage participation. The FDIC received diversity self-assessments from 137 (16.71 percent) of its regulated financial institutions. Eight of the diversity self-assessments were identified as Minority Depository Institutions (MDIs).
The FDIC completed an analysis of the financial industry's diversity policies and practices for the 2017 reporting period and a comparative analysis conducted against the 2016 reporting period, for the purpose of monitoring progress and trends of diversity and inclusion in employment and contracting activities. The analysis further provided the opportunity to identify exemplary diversity policies and practices.
Financial Institutions should direct questions about the diversity self-assessment to OMWI at BankDiversity@FDIC.gov.
SELF-ASSESSMENT BENCHMARKING RESULTS FOR 2017 REPORTING PERIOD
AGGREGATED ASSESSMENT RESULTS – OVERALL BREAKDOWN BY FDIC REGION AND ASSET SIZE
Financial Institutions by FDIC Regional Offices
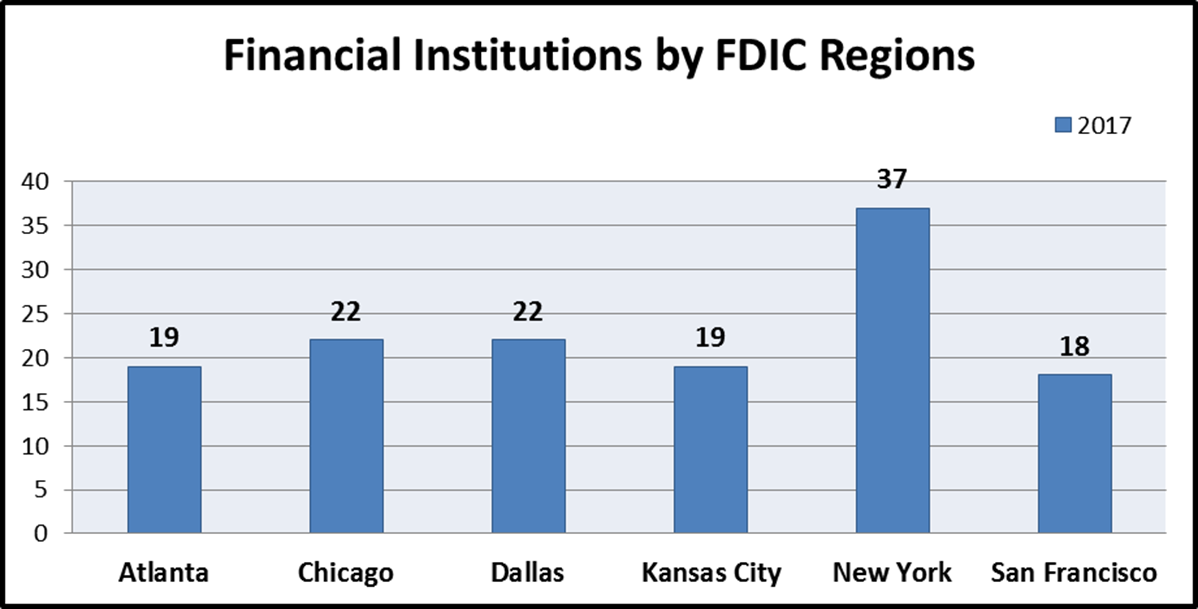
The self-assessments were aggregated by FDIC region, with the New York region having the most financial institutions (37) reporting; and the Dallas and Chicago regions, each following with 22 reported financial institutions. Both, the Atlanta and Kansas City regions had 19 financial institutions reporting. The lowest reporting region was San Francisco with 18 financial institutions.
| Financial Institutions by FDIC Regions (2017) | |
|---|---|
| FDIC Regional Office Location | Number of Institutions |
| Atlanta | 19 |
| Chicago | 22 |
| Dallas | 22 |
| Kansas City | 19 |
| New York | 37 |
| San Francisco | 18 |
Financial Institutions by Asset Size
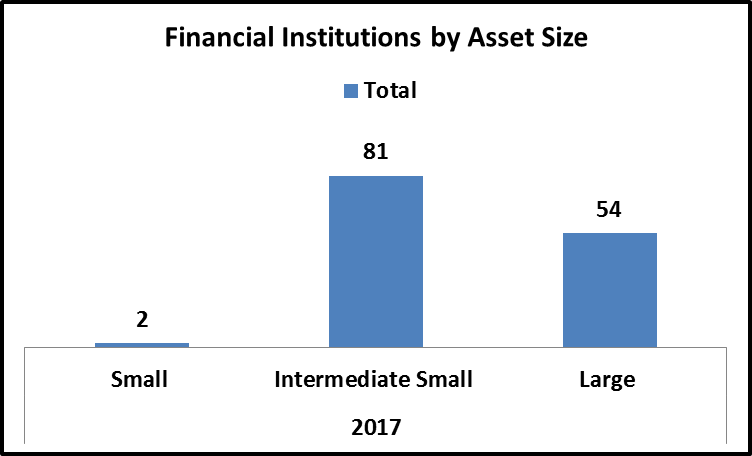
Financial institutions were further aggregated by Asset Size, which are divided by Small, Intermediate Small, and Large1. Most of the FDIC's regulated financial institutions that completed a self-assessment fall in the Intermediate Small category (81 financial institutions). Fifty-four were Large institutions and two were Small.
| Financial Institutions by Asset Size (2017) | |
|---|---|
| Financial Institutions | Total |
| Small | 2 |
| Intermediate Small | 81 |
| Large | 54 |
1 Reference FFIEC's Community Reinvestment Act (CRA) https://www.ffiec.gov/CRA/pdf/AssetThreshold2017.pdf
Financial Institutions by Asset Size and FDIC Regional Offices
A comparative analysis between the asset sizes, in relation to the FDIC Regional Offices to which they report, revealed that the largest number of self-assessments was submitted by financial institutions in the New York region (37). Of the 37 institutions, 15 were categorized as Large institutions; 22 were Intermediate Small institutions; and there were no Small institutions reporting. The second largest number of self-assessments was submitted by financial institutions in the Chicago and Dallas regions (22). Of the 22 financial institutions reporting from the Chicago region, 10 were categorized as Large; 12 were Intermediate Small; and there were no Small institutions. Of the 22 financial institutions reporting from the Dallas region, four were Large institutions; 16 were Intermediate Small; and two were Small institutions. Atlanta and Kansas City had 19 financial institutions reporting from each region. Of the 19 financial institutions reporting from Atlanta, nine were Large institutions; 10 were Intermediate Small; and there were no Small institutions. Of the 19 financial institutions reporting from Kansas City, nine were Large, 10 were Intermediate Small, and there were no Small institutions. San Francisco region had the lowest number of submissions (18). Of these 18 submissions, seven were Large institutions; 11 were Intermediate Small institutions; and there were no Small institutions reporting.
| Small Institution | |
|---|---|
| FDIC Regional Office Location | Number of Institutions |
| Atlanta | 0 |
| Chicago | 0 |
| Dallas | 2 |
| Kansas City | 0 |
| New York | 0 |
| San Francisco | 0 |
| Total | 2 |
| Intermediate Small Institution | |
|---|---|
| FDIC Regional Office Location | Number of Institutions |
| Atlanta | 10 |
| Chicago | 12 |
| Dallas | 16 |
| Kansas City | 10 |
| New York | 22 |
| San Francisco | 11 |
| Total | 81 |
| Large Institution | |
|---|---|
| FDIC Regional Office Location | Number of Institutions |
| Atlanta | 9 |
| Chicago | 10 |
| Dallas | 4 |
| Kansas City | 9 |
| New York | 15 |
| San Francisco | 7 |
| Total | 54 |
AGGREGATED ASSESSMENT RESULTS FOR THE 2017 REPORTING PERIOD - OVERALL BREAKDOWN BY EACH STANDARD:
SECTION I - FINANCIAL INSTITUTION INFORMATION
Sixty percent of the 137 financial institutions reported having a designated Diversity and Inclusion Officer; while 30 percent of the financial institutions have an individual designated as the Supplier Diversity Officer.
| Section I. Financial Institution Information | ||
|---|---|---|
| Diversity and Inclusion Officers | Yes Responses |
Percentage |
| 1. Does your organization have a Diversity and Inclusion Officer or Equivalent? | 82 | 60% |
| 2. Does your organization have a Supplier Diversity Officer or Equivalent? | 41 | 30% |
| Section I Averages: | 62 | 45% |
SECTION II - ASSESSMENT OF THE FINANCIAL INSTITUTION'S DIVERSITY POLICIES AND PRACTICES
Subsection 1: Organizational Commitment to Diversity and Inclusion
A high percentage of respondents reported having an organizational commitment to Diversity and Inclusion within their financial institutions, from the governing body to senior officials and managers. On average, 87 percent of the 137 financial institutions indicated that they practice the Standards outlined in this subsection.
| Section II. Assessment of the Financial Institution's Diversity Policies and Practices | ||
|---|---|---|
| 1. Organizational Commitment to Diversity and Inclusion | Yes Responses |
Percentage |
| 1.1 The financial institution includes diversity and inclusion considerations in both employment and contracting as an important part of its strategic plan for recruiting, hiring, retention, and promotion. | 124 | 91% |
| 1.2 The financial institution has a diversity and inclusion policy that is approved and supported by senior leadership, including senior management and the board of directors. | 117 | 85% |
| 1.3 The financial institution provides regular progress reports to the board and senior management. | 109 | 80% |
| 1.4 The financial institution regularly conducts training and provides educational opportunities on equal employment opportunity and on diversity and inclusion. | 113 | 82% |
| 1.5 The financial institution has a senior level official, preferably with knowledge of and experience in diversity and inclusion policies and practices, who oversees and directs the financial institution's diversity and inclusion efforts. | 123 | 90% |
| 1.6 The financial institution takes proactive steps to promote a diverse pool of candidates, including women and minorities, in its hiring, recruiting, retention, and promotion, as well as in its selection of board members, senior management, and other senior leadership positions. | 125 | 91% |
| Section II.1 Averages: | 119 | 87% |
Subsection 2: Workforce Profile and Employment Practices
Although there is a range of participation in the financial institutions' promotion of fair inclusion of minorities and women in their workforce by publicizing employment opportunities, creating relationships with minority and women professional organizations and educational institutions, creating a culture that values the contribution of all employees, and encouraging a focus on these objectives when evaluating the performance of managers, the responses were high. On average, 83 percent responded that they practice the Standards outlined in this subsection.
| Section II. Assessment of the Financial Institution's Diversity Policies and Practices | ||
|---|---|---|
| 2. Workforce Profile and Employment Practices | Yes Responses |
Percentage |
| 2.1 The financial institution implements policies and practices related to workforce diversity and inclusion in a manner that complies with all applicable laws. | 130 | 95% |
| 2.2 The financial institution ensures equal employment opportunities for all employees and applicants for employment and does not engage in unlawful employment discrimination based on gender, race, or ethnicity. | 132 | 96% |
| 2.3 The financial institution has policies and practices that create diverse applicant pools for both internal and external opportunities that may include: 2.3(a) Outreach to minority and women organizations. |
110 | 80% |
| 2.3(b) Outreach to educational institutions serving significant minority and women student populations. | 100 | 73% |
| 2.3(c) Participation in conferences, workshops, and other events to attract minorities and women and to inform them of employment and promotion opportunities. | 96 | 70% |
| 2.4 The financial institution utilizes both quantitative and qualitative measurements to assess its workforce diversity and inclusion efforts. These efforts may be reflected, for example, in applicant tracking, hiring, promotions, separations (voluntary and involuntary), career development, and retention across all levels and occupations of the financial institution, including the executive and managerial ranks. | 119 | 87% |
| 2.5 The financial institution holds management at all levels accountable for diversity and inclusion efforts, for example, by ensuring that such efforts align with business strategies and individual performance plans. | 112 | 82% |
| Section II.2 Averages: | 114 | 83% |
Subsection 3: Procurement and Business Practices - Supplier Diversity
Overall, a low percentage of respondents reported that they have metrics and analytics to monitor how much they spend to procure and contract for goods and services; how much they spend with minority-owned and women-owned businesses; and that they are knowledgeable about the availability of relevant minority-owned and women-owned businesses. On average, 19 percent responded that they practice the Standards outlined in this subsection; the lowest percentage, 13 percent, reported having contracts with minority-owned and women-owned business subcontractors.
| Section II. Assessment of the Financial Institution's Diversity Policies and Practices | ||
|---|---|---|
| 3. Procurement and Business Practices - Supplier Diversity | Yes Responses |
Percentage |
| 3.1 The financial institution has a supplier diversity policy that provides for a fair opportunity for minority-owned and women-owned businesses to compete for procurement of business goods and services. This includes contracts of all types, including contracts for the issuance or guarantee of any debt, equity, or security, the sale of assets, the management of the financial institution's assets, and the development of the financial institution's equity investments. | 42 | 31% |
| 3.2 The financial institution has methods to evaluate its supplier diversity, which may include metrics and analytics related to: 3.2(a) Annual procurement spending. |
26 | 19% |
| 3.2(b) Percentage of contract dollars awarded to minority-owned and women-owned businesses by race, ethnicity, and gender. | 19 | 14% |
| 3.2(c) Percentage of contracts with minority-owned and women-owned business subcontractors. | 18 | 13% |
| 3.3 The financial institution has practices to promote a diverse supplier pool, which may include: 3.3(a) Outreach to minority-owned and women-owned contractors and representative organizations. |
28 | 20% |
| 3.3(b) Participation in conferences, workshops, and other events to attract minority-owned and women-owned firms and inform them of contracting opportunities. | 24 | 18% |
| 3.3(c) An ongoing process to publicize its procurement opportunities. | 21 | 15% |
| Section II.3 Averages: | 25 | 19% |
Subsection 4: Practice to Promote Transparency of Organizational Diversity and Inclusion
The self-assessments show a wide range in how financial institutions engage in practices that provide greater information, awareness and transparency to the public regarding their diversity and inclusion policies and practices. Eighty percent publicize their current employment and procurement opportunities; whereas, 23 percent promote diversity utilizing forecasts of potential employment and procurement opportunities. On average, 53 percent incorporated practices to promote transparency of their organizational diversity and inclusion.
| Section II. Assessment of the Financial Institution's Diversity Policies and Practices | ||
|---|---|---|
| 4. Practice to Promote Transparency of Organizational Diversity and Inclusion | Yes Responses |
Percentage |
| 4.1 The financial institution publicizes its diversity and inclusion strategic plan. | 43 | 31% |
| 4.2 The financial institution publicizes its policy on its commitment to diversity and inclusion. | 96 | 70% |
| 4.3 The financial institution is transparent about its progress toward achieving diversity and inclusion in its workforce and procurement activities, which may include the financial institution's current workforce and supplier demographic profiles. | 80 | 58% |
| 4.4 The financial institution publicizes its opportunities to promote diversity, which may include: 4.4(a) Current employment and procurement opportunities. |
110 | 80% |
| 4.4(b) Forecasts of potential employment and procurement opportunities. | 32 | 23% |
| 4.4(c) The availability and use of mentorship and developmental programs for employees and contractors | 74 | 54% |
| Section II.4 Averages: | 73 | 53% |
Subsection 5: Financial Institutions' Self-Assessment
A high percentage (86 percent) of financial institutions reported positively to having successful diversity policies and practices, and allocating time and resources to monitor and evaluate performance under their diversity policies and practices on an ongoing basis. However, only 28 percent publish information pertaining to their assessment of diversity policies and practices.
| Section II. Assessment of the Financial Institution's Diversity Policies and Practices | ||
|---|---|---|
| 5. Financial Institutions' Self-Assessment | Yes Responses |
Percentage |
| 5.1 The financial institution conducts an assessment of its diversity policies and practices annually | 118 | 86% |
| 5.2 The financial institution monitors and evaluates its performance under its diversity policies and practices on an ongoing basis. | 118 | 86% |
| 5.3 The financial institution publishes information pertaining to its assessment of its diversity policies and practices. | 39 | 28% |
SECTION III - DIVERSITY DATA
Subsection 1: Workforce Profile
The Standards encourage organizations to promote the fair inclusion of minorities and women in their workforce. A majority of financial institutions (90 percent) reported on the diversity in their workforce, management, and board members. The aggregated numbers are provided below. Workforce diversity is greatest in the total workforce, less diverse in management and even less in Board members.
| Diversity Data | Total | Women (#) |
Women (%) |
Men (#) |
Men (%) |
Minorities (#) |
Minorities (%) |
Non- Minorities (#) |
Non- Minorities (%) |
|---|---|---|---|---|---|---|---|---|---|
| Total Workforce | 99,224 | 60,149 | 61% | 39,075 | 39% | 26,333 | 27% | 72,891 | 73% |
| Total Management | 9,836 | 4,141 | 42% | 5,695 | 58% | 1,482 | 15% | 8,354 | 85% |
| Total Board Members | 1,315 | 195 | 15% | 1,120 | 85% | 109 | 8% | 1,206 | 92% |
Subsection 2: Procurement-Supplier Diversity
Similarly, the Standards promote active outreach to minority and women-owned businesses in the procurement process. The results reported from the financial institutions for their procurement supplier diversity practices were insufficient to draw any conclusions or trends for the second reporting period. Financial institutions, for the most part, do not have the methodology in place to adequately track the diversity in their procurement spending practices. The aggregated results of the diversity data for procurement are reflective of the low percentages reported under Section II.3, Procurement and Business Practices - Supplier Diversity.
COMPARATIVE ANALYSIS OF SELF-ASSESSMENT RESULTS 2016 VERSUS 2017
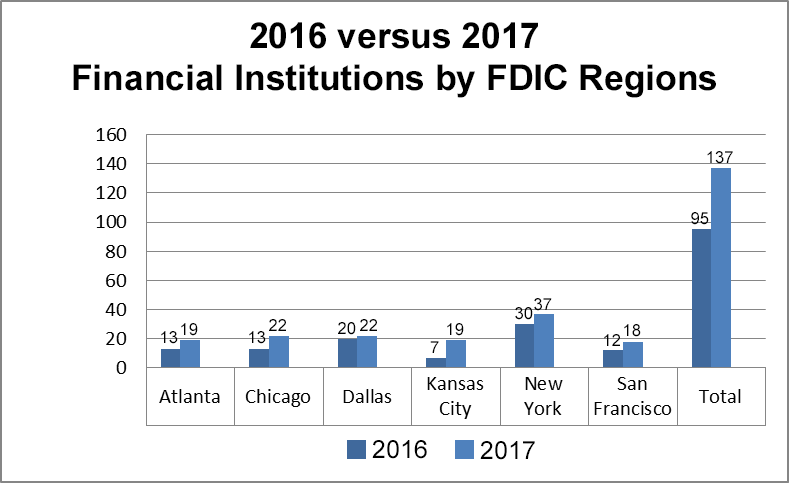
There was a 44.2 percent increase from the 2016 reporting period (95 financial institutions) to the 2017 reporting period (137 financial institutions). There was slight decline in submissions from Minority Depository Institutions (MDI), from 10 in 2016 to eight in 2017.
The chart below illustrates a comparison of responding FDIC-regulated financial institutions for the 2016 and 2017 reporting periods.
| Reporting Period | # Financial Institutions (Universe) |
# Self- Assessments Received |
% Self- Assessments Received |
#MDIs |
|---|---|---|---|---|
| 2016 | 805 | 95 | 11.81% | 10 |
| 2017 | 820 | 137 | 16.71% | 8 |
While the FDIC is pleased with the increased participation of financial institutions in 2017, it will continue to take steps to increase voluntary participation by augmenting outreach at banking conferences, developing financial institution diversity marketing materials, and making improvements to the program website.
Financial Institutions by FDIC Regional Offices
In the 2017 reporting period, every region showed an increase in responses. The New York region had the most reported financial institutions – (30 in 2016 and 37 in 2017) and the Dallas region followed with 20 in 2016 and 22 in 2017. In 2017 the Chicago region had 22 reported submissions and the Atlanta and Kansas City regions both reported submissions from 19 financial institutions. The Kansas City region had the largest increase of 171 percent (seven in 2016 to 19 in 2017). The San Francisco region experienced an increase from 12 in 2016 to 18 in 2017.
| Atlanta | Chicago | Dallas | Kansas City |
New York |
San Francisco |
Total | |
|---|---|---|---|---|---|---|---|
| 2016 | 13 | 13 | 20 | 7 | 30 | 12 | 95 |
| 2017 | 19 | 22 | 22 | 19 | 37 | 18 | 137 |
| % change | 46% | 69% | 10% | 171% | 23% | 50% | 44% |
Financial Institutions by Asset Size
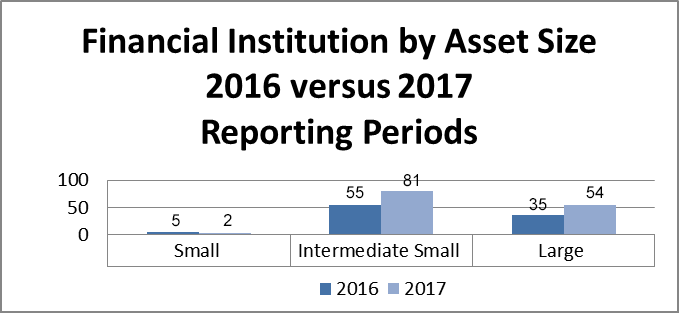
The submissions decreased from 2016 to 2017 in the asset size categorized as a small institution by three (five to two) financial institutions. There was an increase in responses from intermediate small institutions from 55 to 81 (47 percent) and an increase in large institutions from 35 to 54 (54 percent).
| Small | Intermediate Small |
Large | |
|---|---|---|---|
| 2016 | 5 | 55 | 35 |
| 2017 | 2 | 81 | 54 |
SECTION I - FINANCIAL INSTITUTION INFORMATION
The data for the 2016 versus the 2017 reporting period showed a small decrease for financial institutions with designated Diversity and Inclusion Officers and a slight increase in financial institutions with Supplier Diversity Officers. In 2016, 82 of 95 financial institutions had Diversity and Inclusion Officers versus 81 of 137 in 2017. In 2016, 41 of 95 financial institutions had Supplier Diversity Officers versus 44 of 137 in 2017.
| Section I. Financial Institution Information | 2016 | 2017 |
|---|---|---|
| Diversity and Inclusion Officers | ||
| 1. Does your organization have a Diversity and Inclusion Officer of Equivalent? | 81 | 82 |
| 2. Does your organization have a Supplier Diversity Officer of Equivalent? | 44 | 41 |
SECTION II - ASSESSMENT OF THE FINANCIAL INSTITUTION'S DIVERSITY POLICIES AND PRACTICES
Subsection 1: Organizational Commitment to Diversity and Inclusion
Based on the 2016 and 2017 data, the organizational commitment to Diversity and Inclusion has increased. This subsection had the second highest overall percent of change from 2016 to 2017 (a six percent increase). The responses indicated the financial institutions embrace the Standards in this subsection. The highest increased response (nine percent) was in reference to the financial institutions that included employment and contracting diversity and inclusion considerations in their strategic plan.
| Section II. Assessment of the Financial Institution's Diversity Policies and Practices | 2016 | 2017 |
|---|---|---|
| 1. Organizational Commitment to Diversity and Inclusion | Average: 82% | Average: 88% |
| 1.1 The financial institution includes diversity and inclusion considerations in both employment and contracting as an important part of its strategic plan for recruiting, hiring, retention, and promotion. | 83% | 92% |
| 1.2 The financial institution has diversity and inclusion policy that is approved and supported by senior leadership, including senior management and the board of directors. | 81% | 87% |
| 1.3 The financial institution provides regular progress reports to the board and senior management. | 75% | 81% |
| 1.4 The financial institution regularly conducts training and provides educational opportunities on equal employment opportunity and on diversity and inclusion. | 82% | 84% |
| 1.5 The financial institution has a senior level official, preferably with knowledge of and experience in diversity and inclusion policies and practices, who oversees and directs the financial institution's diversity and inclusion efforts. | 84% | 91% |
| 1.6 The financial institution takes proactive steps to promote a diverse pool of candidates, including women and minorities, in its hiring, recruiting, retention, and promotion, as well as in its selection of board members, senior management, and other senior leadership positions. | 85% | 93% |
Subsection 2: Workforce Profile and Employment Practices
The workforce profile and employment practice had the highest average change from 2016 to 2017 (a seven percent increase). These numbers indicated the financial institutions embraced the Standards in this subsection. The highest positive change (14 percent) referred to holding management at all levels accountable for diversity and inclusion efforts. The second highest positive change (10 percent) referred to participation in conferences, workshops, and other events to attract minorities and inform them of employment and promotion opportunities.
| Section II. Assessment of the Financial Institution's Diversity Policies and Practices | 2016 | 2017 |
|---|---|---|
| 2. Workforce Profile and Employment Practices | Average: 77% | Average: 84% |
| 2.1 The financial institution implements policies and practices related to workforce diversity and inclusion in a manner that complies with all applicable laws. | 94% | 96% |
| 2.2 The financial institution ensures equal employment opportunities for all employees and applicants for employment and does not engage in unlawful employment discrimination based on gender, race, or ethnicity. | 96% | 98% |
| 2.3 The financial institution has policies and practices that create diverse applicant pools for both internal and external opportunities that may include: 2.3(a) Outreach to minority and women organizations. |
74% | 81% |
| 2.3(b) Outreach to educational institutions serving significant minority and women student populations. | 66% | 74% |
| 2.3(c) Participation in conferences, workshops, and other events to attract minorities and women and to inform them of employment and promotion opportunities. | 61% | 71% |
| 2.4 The financial institution utilizes both quantitative and qualitative measurements to assess its workforce diversity and inclusion efforts. These efforts may be reflected, for example, in applicant tracking, hiring, promotions, separations (voluntary and involuntary), career development, and retention across all levels and occupations of the financial institution, including the executive and managerial ranks. | 79% | 88% |
| 2.5 The financial institution holds management at all levels accountable for diversity and inclusion efforts, for example, by ensuring that such efforts align with business strategies and individual performance plans. | 69% | 83% |
Subsection 3: Procurement and Business Practices - Supplier Diversity
Procurement and Business Practices - Supplier Diversity had the lowest average with five percent decrease from 2016 to 2017. In future years, we hope to see substantive improvement in all of the Supplier Diversity responses.
| Section II. Assessment of the Financial Institution's Diversity Policies and Practices | 2016 | 2017 |
|---|---|---|
| 3. Procurement and Business Practices – Supplier Diversity | Average: 24% | Average: 19% |
| 3.1 The financial institution has supplier diversity policy that provides for a fair opportunity for minority-owned and women-owned businesses to compete for procurement of business goods and services. This includes contracts of all types, including contracts for the issuance or guarantee of any debt, equity, or security, the sale of assets, the management of the financial institution's assets, and the development of the financial institution's equity investments. | 41% | 31% |
| 3.2 The financial institution has methods to evaluate its supplier diversity, which may include metrics and analytics related to 3.2(a) Annual procurement spending. |
23% | 19% |
| 3.2(b) Percentage of contract dollars awarded to minority-owned and women-owned businesses by race, ethnicity, and gender. | 16% | 14% |
| 3.2(c) Percentage of contracts with minority-owned and women-owned business subcontractors. | 15% | 13% |
| 3.3 The financial institution has practices to promote a diverse supplier pool, which may include: 3.3(a) Outreach to minority-owned and women-owned contractors and representative organizations. |
31% | 21% |
| 3.3(b) Participation in conferences, workshops, and other events to attract minority-owned and women-owned firms and inform them of contracting opportunities. | 20% | 18% |
| 3.3(c) An ongoing process to publicize its procurement opportunities. | 23% | 16% |
Subsection 4: Practice to Promote Transparency of Organizational Diversity and Inclusion
The practice to promote transparency of organizational diversity and inclusion had an average positive change of three percent from 2016 to 2017. The highest positive change (seven percent) referred to a financial institution publicizing its policy on its commitment to diversity and inclusion. The second highest positive change (five percent) referred to financial institutions publicizing opportunities to promote diversity with their current employment and procurement opportunities.
| Section II. Assessment of the Financial Institution's Diversity Policies and Practices | 2016 | 2017 |
|---|---|---|
| 4. Practice to Promote Transparency of Organizational Diversity and Inclusion | Average: 51% | Average: 54% |
| 4.1 The financial institution publicizes its diversity and inclusion strategic plan. | 33% | 32% |
| 4.2 The financial institution publicizes its policy on its commitment to diversity and inclusion. | 64% | 71% |
| 4.3 The financial institution is transparent about its progress toward achieving diversity and inclusion in its workforce and procurement activities, which may include the financial institution's current workforce and supplier demographic profiles. | 57% | 59% |
| 4.4 The financial institution publicizes its opportunities to promote diversity, which may include: 4.4(a) Current employment and procurement opportunities. |
76% | 81% |
| 4.4(b) Forecasts of potential employment and procurement opportunities. | 23% | 24% |
| 4.4(c) The availability and use of mentorship and developmental programs for employees and contractors. | 54% | 55% |
Subsection 5: Financial Institutions' Self-Assessment
In this subsection, the average for financial institutions performing their annual self-assessment from 2016 to 2017 increased by two percent. Financial institutions are still reluctant to publish information pertaining to assessments of their diversity policies and practices, and results remain low at 29 percent.
| Section II. Assessment of the Financial Institution's Diversity Policies and Practices | 2016 | 2017 |
|---|---|---|
| 5. Financial Institutions' Self-Assessment | Average: 66% | Average: 68% |
| 5.1 The financial institution conducts an assessment of its diversity policies and practices annually. | 86% | 87% |
| 5.2 The financial institution monitors and evaluates its performance under its diversity policies and practices on an ongoing basis. | 83% | 87% |
| 5.3 The financial institution publishes information pertaining to its assessment of its diversity policies and practices. | 28% | 29% |
SECTION III - DIVERSITY DATA
Subsection 1: Workforce Profile
In both the 2016 and 2017 reporting periods, approximately 80 percent of the financial institutions reported diversity data on their workforces, management, and board members.
Subsection 2: Procurement-Supplier Diversity
The data provided from both 2016 and 2017 are inconclusive. There simply was not enough data to analyze or to determine trends for the procurement supplier diversity subsection. We hope 2018 responses will provide more data to review and analyze.
OMWI OUTREACH
The OMWIs from eight financial regulatory agencies held the first "Financial Regulatory Agencies' Diversity and Inclusion Summit." The Summit was held at the Federal Reserve Bank of New York on Thursday, September 13, 2018, and included: the Federal Reserve System Board of Governors (FRB); the Bureau of Consumer Financial Protection (BCFP); the Federal Deposit Insurance Corporation (FDIC); the National Credit Union Administration (NCUA); the Office of the Comptroller of the Currency (OCC); the Federal Housing Finance Agency; the Securities and Exchange Commission (SEC); and the Department of the Treasury.
The goal of the Summit was to bring together organizations in the financial industry that included entities regulated by the OMWI agencies in order to highlight industry best practices involving diversity and inclusion in employment and procurement practices.
Speakers from various segments of the financial industry discussed practices they have successfully implemented within their organizations to advance diversity and promote inclusion in the workplace, and to increase opportunities for diverse suppliers.
The Summit also featured a panel discussion with the OMWI Directors from FDIC, OCC, SEC, NCUA, and FRB. The Directors shared highlights on the results of assessments agencies have done under Section 342 of the Dodd-Frank Act.
The OMWI Directors closed the Summit by encouraging participants from financial institutions to complete and submit their diversity self-assessments to their respective regulatory OMWI agency, in order to contribute to the reports the agencies release providing trends on diversity and inclusion in the financial industry. These efforts will continue to advance the visibility and adoption of diversity and inclusion practices in the financial industry. The Summit was well-received according to the feedback received from participants. In 2019, we will explore hosting another Summit in a different location.
EXEMPLARY PRACTICES
The FDIC has identified exemplary practices that financial institutions implemented as part of their workforce diversity and inclusion practices. These practices could be considered by other financial institutions. For example the 2017 self-assessments showed:
Some financial institutions implemented or leveraged technology to connect with the public by posting information regarding their Diversity and Inclusion programs and efforts along with related recognitions and awards; while others aligned their Diversity and Inclusion business strategies and individual performance plans through diversity dashboard analytics that incorporate Diversity and Inclusion goals related to recruitment, hiring, and/or development.- Financial institutions identified, attracted, recruited and trained a diverse and qualified workforce by:
- participating on the boards of Colleges;
- utilizing minority and women owned recruiting firms;
- reaching out to low income, minority-majority local high schools and offering internships to students;
- partnering and collaborating with professional diversity organizations, Historically Black Colleges and Universities, Hispanic Serving Institutions, local non-profits and other diversity organizations to provide internship and learning opportunities;
- sourcing from state job-board services that aid unemployed, disadvantaged, and veteran's communities;
- hiring summer interns from diverse, low income, minority-majority high schools and pairing them with a mentor to help them build a career plan; and
- partnering their human resources with representatives of minority groups and community outreach programs to help place individuals for employment and extending themselves to be resources to help minority job seekers with resume writing, mock interviewing, and business etiquette.
- Several financial institutions established successful programs focusing on leadership, personal development and recruitment of recent college graduates.
- Financial institutions implemented formal supplier diversity programs to provide opportunities for minority and women-owned businesses to compete for procurement of business goods and services, and required the inclusion of minority- or women-owned businesses in bid opportunities.
- Financial institutions are also developing systems to facilitate the augmentation of demographic and procurement information. When vendor demographics are reflected in the market that matches an institution's business and contractual needs, minority- or women-owned businesses are included in bid opportunities.
Best practices identified by the FDIC for the 2016 reporting period can be found at https://www.fdic.gov/about/diversity/rerpt2016.html