
2013 Annual Report
II. Financial Highlights
In its role as deposit insurer of financial institutions, the FDIC promotes the safety and soundness of insured depository institutions (IDIs). The following financial highlights address the performance of the deposit insurance funds, and discuss the corporate operating budget and investment spending.
Deposit Insurance Fund Performance
The FDIC administers the Deposit Insurance Fund (DIF) and the FSLIC Resolution Fund (FRF), which fulfills the obligations of the former Federal Savings and Loan Insurance Corporation (FSLIC) and the former Resolution Trust Corporation (RTC). The following summarizes the condition of the DIF. (See the accompanying graphs on FDIC-Insured Deposits and Insurance Fund Reserve Ratios on the following page.)
For 2013, the DIF's comprehensive income totaled $14.2 billion compared to comprehensive income of $21.1 billion during 2012. This $6.9 billion year-over-year decrease was primarily due to a $6.0 billion decrease in other revenue (which is attributable to the 2012 transfer of fees from TLGP) and a $2.7 billion decrease in assessments; partially offset by a $1.5 billion decrease in provision for insurance losses and $156 million net increase from the sale of Citigroup trust preferred securities (TruPS).
Assessment revenue was $9.7 billion for 2013. The decrease of $2.7 billion, from $12.4 billion in 2012, was primarily due to lower assessment rates, resulting from continued improvements in banks' CAMELS ratings and financial condition. In addition, in 2013, the DIF refunded $5.9 billion in prepaid assessments to the 5,625 insured depository institutions that had remaining balances. This final payment marked the end of the prepaid assessment program, which began with the collection of $45.7 billion in prepaid assessments on December 30, 2009.
The provision for insurance losses was negative $5.7 billion for 2013, compared to negative $4.2 billion for 2012. The negative provision for 2013 primarily resulted from a reduction of $1.0 billion in the contingent liability for anticipated failures due to the improvement in the financial condition of troubled institutions and a decrease of $4.8 billion in the estimated losses for institutions that failed in prior years.
During 2013, to facilitate a sale of the TruPS, the FDIC exchanged the Citigroup TruPS for $2.420 billion (principal amount) of Citigroup subordinated notes. The exchange resulted in an increase of $156 million to the DIF's 2013 comprehensive income. Subsequently, the subordinated notes were sold to the institutional fixed income market for the principal amount of $2.420 billion.
Estimated DIF Insured Deposits
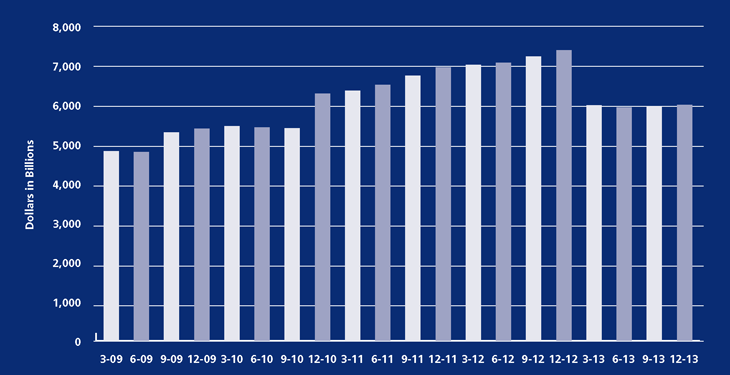
SOURCE: Commercial Bank Call and Thrift Financial Reports
Note: Beginning in the fourth quarter of 2010 through the fourth quarter of 2012, estimated insured deposits include the entire balance of noninterest-bearing transaction accounts.
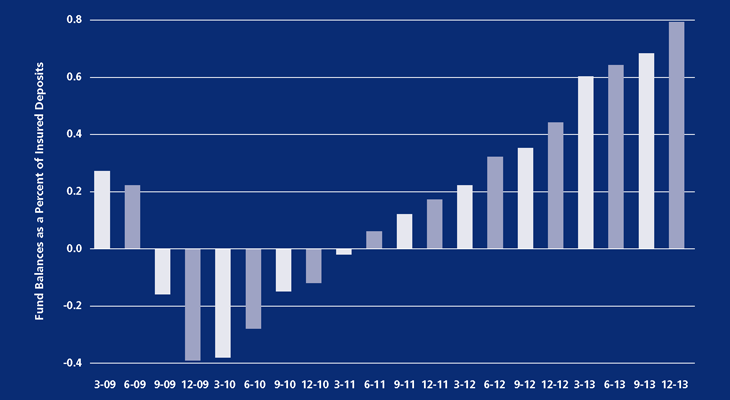
Deposit Insurance Fund Reserve Ratios
Deposit Insurance Fund Selected Statistics
Dollars in Millions
|
For the years ended December 31 |
|||||||
|---|---|---|---|---|---|---|---|---|
Financial Results |
||||||||
Revenue |
$10,459 |
$18,522 |
$16,342 |
|||||
Operating Expenses |
1,609 |
1,778 |
1,625 |
|||||
Insurance and Other Expenses (includes provision for loss) |
(5,655) |
(4,377) |
(4,541) |
|||||
Net Income |
14,505 |
21,121 |
19,257 |
|||||
Comprehensive Income |
14,233 |
21,131 |
19,179 |
|||||
Insurance Fund Balance |
$47,191 |
$32,958 |
$11,827 |
|||||
Fund as a Percentage of Insured Deposits (reserve ratio) |
0.79% |
0.44% |
0.17% |
|||||
Selected Statistics |
||||||||
Total DIF-Member Institutions1 |
6,812 |
7,183 |
7,357 |
|||||
Problem Institutions |
467 |
651 |
813 |
|||||
Total Assets of Problem Institutions |
$152,687 |
$232,701 |
$319,432 |
|||||
Institution Failures |
24 |
51 |
92 |
|||||
Total Assets of Failed Institutions in Year2 |
$6,044 |
$11,617 |
$34,923 |
|||||
Number of Active Failed Institution Receiverships |
479 |
463 |
426 |
|||||
1Commercial banks and savings institutions. Does not include U.S. insured branches of foreign banks.
2Total Assets data are based upon the last Call Report or TFR filed by the institution prior to failure.