
Chief Financial Officer's (CFO) Report to the Board
301 Moved Permanently
Selected Financial Data - Third Quarter 2016
| Fund Financial Results | ($ in millions) |
| FSLIC Resolution Fund | |||||
Sep-16
|
Jun-16 |
Quarterly Change |
Sep-15 |
Year-Over-Year Change |
Cash and cash equivalents | $873 | $872 | $1 | $872 | 1 |
| Accumulated deficit | (124,616) | (124,618) | 2 | (124,642) | 26 |
| Total resolution equity | 873 | 872 | 1 | 872 | 1 |
| Total revenue | 4 | 1 | 3 | 2 | 2 |
| Operating expenses | 3 | 2 | 1 | 2 | 1 |
| Provision for losses | (1) | (3) | 2 | - | (1) |
| Other expenses | - | 2 | (2) | - | - |
| Goodwill litigation expenses | - | - | - | 182 | (182) |
| Net Income (Loss) | $2 | $- | 2 | ($182) | $184 |
| Receivership Selected Statistics September 2016 vs. September 2015 |
| $ in millions | DIF |
FRF |
ALL FUNDS |
||||||
| Sep-16 | Sep-15 | Change | Sep-16 | Sep-15 | Change | Sep-16 | Sep-15 | Change | Total Receiverships | 404 | 470 | (66) | - | - | - | 404 | 470 | (66) |
| Assets in Liquidation | $3,756 | $5,447 | ($1,691) | $2 | $5 | (3) | $3,758 | $5,452 | ($1,694) |
| YTD Collections | $1,289 | $2,511 | ($1,222) | $2 | $2 | $- | $1,291 | $2,513 | ($1,22) |
| YTD Dividend/ Other Pymts - Cash | $3,296 | $5,388 | ($2,092) | $- | $- | $- | $3,296 | $5,388 | ($2,092) |
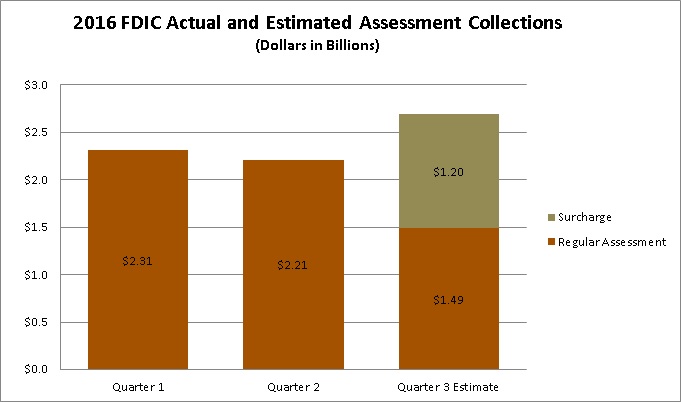
2016 FDIC Actual and Estimated Assessment Collections (Dillions in billions) |
||
Regular Assessment |
Surcharge |
|
| Quarter 1 | 2.31 | 0 |
| Quarter 2 | 2.21 | 0 |
| Quarter 3 Estimate | 1.49 | 1.2 |
The third quarter decline in estimated regular assessment revenue is due to a decline in the effective assessment rate, from 6.2 basis points to 4.1 basis points due to the lower assessment rate schedule now that the Deposit Insurance Fund has reached 1.15 percent of estimated insured deposits.