
Table of Contents
FDIC CONTRACTING: Inclusion of Minority- and Women-Owned Businesses (MWOBs)
EMPLOYMENT AT THE FDIC: Increasing Representation of Minorities and Women
INTRODUCTION
Under the provisions of the Dodd-Frank Wall Street Reform and Consumer Protection Act (DFA), Section 342, the Federal Deposit Insurance Corporation (FDIC), Office of Minority and Women Inclusion (OMWI) is required to submit to Congress an annual report regarding the actions taken by the agency toward hiring qualified minority and women employees and contracting with qualified minority- and women-owned businesses.
The FDIC is pleased to submit this 2018 Report to Congress. The report describes the FDIC's activities relating to the inclusion of minorities and women in contracting and hiring for the year, and other relevant information, including the agency's financial institution diversity and contractors' workforces fair inclusion programs and activities supporting financial access, economic inclusion, and financial literacy. Consistent with the provisions of Section 342 of the DFA, the FDIC continues to enhance its long-standing commitment to promote diversity and inclusion in employment opportunities and all business areas of the FDIC. This report outlines both successes and challenges in contracting and hiring as the agency works to ensure that these efforts are reflected in its operations.
Commitment to Diversity and Inclusion
The mission of the FDIC is to preserve and promote public confidence in the U.S. financial system by insuring deposits, examining and supervising financial institutions for safety and soundness and consumer protection, making large and complex financial institutions resolvable, and managing receiverships. OMWI is an important component in these efforts and supports the FDIC's mission through the pursuit of equal employment opportunity, affirmative employment initiatives, diversity and inclusion, and outreach efforts to ensure the fair inclusion and utilization of minority- and women-owned businesses, law firms, and investors in contracting and investment opportunities.
When the FDIC Board of Directors created OMWI in 2011, the Board also established an OMWI Steering Committee (later renamed the FDIC Diversity and Inclusion Executive Advisory Council (EAC)), to ensure and promote coordination of OMWI programs. The EAC is chaired by the FDIC Deputy to the Chairman and Chief Operating Officer and includes the OMWI Director, FDIC division and office directors, and other key FDIC senior staff. The EAC provides leadership on diversity and inclusion initiatives throughout the FDIC.
The FDIC's 2018 - 2019 Diversity and Inclusion Strategic Plan continues to outline a course for promoting workforce diversity by recruiting from a diverse, qualified group of potential applicants, and cultivating workplace inclusion through collaboration, flexibility, and fairness. The strategic plan identifies agency strategies to promote increased diversity through the FDIC's recruiting and hiring processes. The plan also ensures the sustainability of the FDIC's diversity and inclusion efforts by equipping leaders with the ability to manage diversity, monitor results, and refine approaches on the basis of actionable data. There are specific steps outlined in the plan that continue to enhance diversity and inclusion at the FDIC in the areas of leadership engagement, analytics and reporting, training, communications, strategic planning, and program enhancement.
The agency's success carrying out its missions is due in large-part to the commitment and dedication of the FDIC workforce. This workforce has managed the regulatory process through economic downturns and upturns over the years. These highly skilled professionals possess deep institutional knowledge of the banking industry. The FDIC has experienced an increase in retirements as baby boomers exit the workforce. As these professionals leave the workforce, FDIC's continued commitment to diversity and inclusion is critical to recruiting and retaining the most qualified, talented, and motivated employees in the labor market.
Consistent with the DFA, the FDIC continues to promote the economic inclusion of minority-majority communities through initiatives aimed at providing greater transparency to the public on performance, and reducing unnecessary regulatory burdens for community banks. FDIC leadership is engaged in conducting a comprehensive review of supervisory processes including, workforce structure, and capabilities supporting the agency's Community Affairs mission. These efforts will promote increased focus on underserved and unbanked communities through expanded engagement with Minority Depository Institutions so they are in a better position to serve their communities. Also, FDIC has efforts underway to promote the safe adoption of additional products and services to bring underserved communities more fully into the banking mainstream. In addition, FDIC is soliciting feedback on how the agency may better enable banks to offer small dollar credit to consumers.
2018 Diversity and Inclusion Initiatives
The FDIC is committed to continually providing all employees with a work environment that promotes excellence and acknowledges and honors the diversity of its employees. The Diversity and Inclusion Strategic Plan was reviewed and during 2017 was updated and disseminated to the FDIC workforce and posted on the FDIC website in February 2018. The updated 2018 – 2019 Plan is designed to continue the FDIC's success in ensuring all employees are valued members of the workplace and active participants in carrying out the FDIC mission. The two-year plan is designed to recognize that many specified actions have concrete steps, while other actions more broadly reflect the continuation of the FDIC's general approach to diversity and inclusion. As in the past, the EAC will oversee the implementation of the plan and ensure that the FDIC's commitment to diversity and inclusion remains a priority. While this is a two-year plan, the EAC will review the plan during 2019 to determine if any changes are necessary.
Annually, each FDIC division and major office assesses available workforce data and produces plans with strategies to further their diversity progress and address noted issues. The division and office level plans were consolidated into an FDIC Plan to Promote Increased Diversity through Division/Office Engagement and have been integrated into the agency's annual strategic planning efforts. In April 2018, the progress made by divisions and major offices was reported and discussed at the EAC meeting. This process keeps the division and major offices engaged in the FDIC's diversity and inclusion efforts and will continue in 2019.
In recognition of the FDIC's 2018 diversity and inclusion progress, the following initiatives are highlighted:
The FDIC continued to support and encourages the formation of Employee Resource Groups (ERGs). These ERGs are networks of employees with similar interests or experiences, whose goals and objectives facilitate the creation and maintenance of a work environment that recognizes, appreciates, and encourages the utilization of the talents, skills, and perspectives of all employees in the achievement of the FDIC's mission.
The FDIC supported the establishment of two new ERGs: The Association of African American Professionals (A3P); and Networking Inclusion and Advancement for African American-Women: African American Women with a Purpose (NIA Women). This is in addition to the six existing ERGs: Corporate Advocacy Network for Disability Opportunities (CAN DO); Innovation Meetup (formerly Emerging Leaders); Hispanic Organization for Leadership and Advancement (HOLA); Partnership of Women in the Workplace (POWW); PRIDE; and Veterans Employee Resource Group (VERG).
Diversity 101 online training was implemented for all employees and OMWI began monitoring completion by employees.
A contract was awarded to provide diversity and inclusion consulting support services and diversity and inclusion training for employees.
FDIC Corporate University continued administering manager and supervisor training on equal employment opportunity and diversity and inclusion, including the No FEAR Act biennial training.
FDIC CONTRACTING:
Inclusion of Minority- and Women-Owned Businesses (MWOBs)
The FDIC places a high priority on achieving diversity in contracting and asset sales, and OMWI is an integral part of the contractor solicitation, education, and evaluation process. During 2018, the FDIC implemented new contracting initiatives and conducted focused outreach which improved MWOB participation in its contracting activities. However, the FDIC continued to face challenges in increasing the utilization and growth rates for MWOB contractors because new contract awards by the FDIC have been declining since the height of the financial crisis and non-financial goods and services contracts for recurring needs represent a larger percentage of FDIC contracts. The FDIC will analyze future contracting needs to determine where MWOB opportunities may exist and if new procurement strategies can be used to maximize MWOB participation. The following sections provide detailed information on the agency's 2018 contracting activities and successes; contracting initiatives, programs, and outreach; and challenges the FDIC faces in increasing MWOB participation in its contracting activities.
Contracting Activities and Successes
FDIC Procurement Policies
The FDIC's contracts are typically awarded through a competitive, best-value solicitation process that involves consideration of both the offeror's technical and price proposals. The solicitations describe what offerors must include in their proposals and the proposal evaluation criteria specific to the good or service being procured. Proposals are evaluated and rated by a panel of FDIC subject matter experts and include an OMWI representative. Awards are made to the offeror that provides the best value to the FDIC.
For any contract over $100,000, OMWI review is required to identify competitive minority- and women-owned businesses to include in contract solicitations. As part of this process, OMWI uses the FDIC's Contractor Resource List (CRL) that includes registered MWOBs. The CRL is the principal database for vendors interested in doing business with the FDIC. OMWI also identifies qualified MWOBs through the System for Award Management and the Minority Business Development Agency. This process helps ensure that a diverse pool of contractors is solicited and considered for each major contract.
The FDIC's website1 provides extensive information, announcements, and technical assistance for minority- and women-owned businesses, law firms, and investors seeking to do business with the FDIC. The FDIC also has a small business resource page that contains more than 40 learning modules2 and is a technical assistance aid and self-assessment for businesses interested in competing for contract opportunities.
1. See www.fdic.gov/about/diversity/mwop/index.html.
2. See www.fdic.gov/about/diversity/sbrp/index.html.
Contract Payments with MWOBs
The FDIC paid $429.6 million to contractors in 2018 under 1,295 contracts, of which $98.0 million (22.8 percent) was paid to MWOBs under 299 contracts. [See Figure 1.] By comparison, the FDIC paid $414.0 million to contractors under 1,537 contracts in 2017; $415.2 million to contractors under 1,786 contracts in 2016; $507.2 million to contractors under 2,029 contracts in 2015; and $491.6 million to contractors under 1,962 contracts in 2014. The 2018 total payments (i.e., spend) to contractors included payments for contracts awarded in 2018 and payments for active contracts awarded prior to 2018.
| Figure 1 Contracting Payments (in millions) | |||||
|---|---|---|---|---|---|
| 2014 | 2015 | 2016 | 2017 | 2018 | |
| Total | $491.6 | $507.2 | $415.2 | $414.0 | $429.6 |
| 100.0% | 100.0% | 100.0% | 100.0% | 100.0% | |
| MWOB | $128.2 | $142.5 | $111.5 | $109.6 | $98.0 |
| 26.1% | 28.1% | 26.8% | 26.5% | 22.8% | |
| Minority Owned (MO) | $89.3 | $89.3 | $56.0 | $54.6 | $49.5 |
| 18.2% | 17.6% | 13.5% | 13.2% | 11.5% | |
| Women Owned (WO) | $63.6 | $83.2 | $66.8 | $66.9 | $59.5 |
| 12.9% | 16.4% | 16.1% | 16.2% | 13.9% | |
| Overlap (Both MO & WO) | $24.7 | $30.0 | $11.3 | $11.9 | $11.1 |
| 5.0% | 5.9% | 2.8% | 2.9% | 2.6% | |
| Asian American | $38.5 | $39.9 | $33.5 | $30.1 | $28.8 |
| 7.9% | 7.9% | 8.1% | 7.2% | 6.7% | |
| Black American | $15.9 | $13.3 | $11.5 | $14.2 | $9.5 |
| 3.2% | 2.6% | 2.8% | 3.4% | 2.2% | |
| Hispanic American | $26.7 | $25.1 | $10.3 | $9.5 | $8.4 |
| 5.4% | 5.0% | 2.5% | 2.3% | 2.0% | |
| Native American | $0.3 | $0.1 | $0.1 | $0.2 | $2.2 |
| 0.1% | 0.0% | 0.0% | 0.1% | .05% | |
For purposes of contract payment information, the FDIC considers an active contract one in which payments were made or credits applied in 2018. In 2018, minority-owned firms were paid $49.5 million of the total dollars paid to MWOB contractors (11.5 percent). Women-owned firms were paid $59.5 million of the total dollars paid to contractors (13.9 percent). These two categories – minorities and women – are not mutually exclusive since $11.1 million (2.6 percent) was paid in 2018 to businesses classified as both minority-owned and women-owned. The FDIC paid MWOBs $109.6 million (26.5 percent) of the total paid to all contractors in 2017 under 354 contracts; $111.5 million (26.8 percent) of the total paid to all contractors in 2016 under 461 contracts; $142.5 million (28.1 percent) of the total paid to all contractors in 2015 under 591 contracts; and $128.2 million (26.1 percent) to MWOBs in 2014 under 533 contracts.
In 2018, the FDIC awarded 166 contracts to MWOBs out of a total of 565 issued (29.4 percent). [See Figure 2.] By comparison, the FDIC awarded 210 contracts (28.5 percent) to MWOBs out of a total of 737 issued in 2017; 287 contracts (24.3 percent) to MWOBs out of a total of 1,181 issued in 2016; 346 contracts (29.9 percent) to MWOBs out of a total of 1,159 issued in 2015; and 288 contracts (26.9 percent) to MWOBs out of a total of 1,072 issued in 2014.
| Figure 2 Contracting Actions | |||||
|---|---|---|---|---|---|
| 2014 | 2015 | 2016 | 2017 | 2018 | |
| Total | 1072 | 1159 | 1181 | 737 | 565 |
| 100.0% | 100.0% | 100.0% | 100.0% | 100.0% | |
| MWOB | 288 | 346 | 287 | 210 | 166 |
| 26.9% | 29.9% | 24.3% | 28.5% | 29.4% | |
| Minority Owned (MO) | 170 | 148 | 142 | 100 | 87 |
| 15.9% | 12.8% | 12.0% | 13.6% | 15.4% | |
| Women Owned (WO) | 167 | 243 | 187 | 151 | 119 |
| 15.6% | 21.0% | 15.8% | 20.5% | 21.1% | |
| Overlap (Both MO & WO) | 49 | 45 | 42 | 41 | 40 |
| 4.6% | 3.9% | 3.5% | 5.6% | 7.1% | |
| Asian American | 54 | 56 | 62 | 63 | 54 |
| 5.1% | 4.8% | 5.2% | 8.6% | 9.6% | |
| Black American | 45 | 35 | 24 | 22 | 11 |
| 4.2% | 3.0% | 2.0% | 3.0% | 1.9% | |
| Hispanic American | 59 | 39 | 48 | 4 | 11 |
| 5.5% | 3.4% | 4.1% | 0.5% | 1.9% | |
| Native American | 2 | 1 | 2 | 7 | 6 |
| 0.2% | 0.1% | 0.2% | 1.0% | 1.1% | |
| Other | 10 | 17 | 6 | 4 | 5 |
| 0.9% | 1.5% | 0.5% | 0.5% | 0.9% | |
As of December 31, 2018, the FDIC had 251 (18.9 percent) active contracts with MWOBs out of a total of 1,331 active contracts. The active contracts to MWOB firms by category were as follows: Asian American (81), Black American (25), Hispanic American (18), Native American (10), and Women (166). These include contracts awarded to firms that were both minority-owned and women-owned.
Contract Awards with MWOBs
The FDIC awarded contracts with a combined value of $499.5 million in 2018, of which $122.5 million (24.5 percent) were awarded to MWOBs. By comparison, the FDIC awarded contracts with a combined value of $523.7 million in 2017, with $96.7 million (18.5 percent) awarded to MWOBs; awarded contracts with a combined value of $508.8 million in 2016, with $93.9 million (18.5 percent) awarded to MWOBs; awarded contracts with a combined value of $858.4 million in 2015, with $211.6 million (24.7 percent) awarded to MWOBs; and awarded contracts with a combined value of $686.8 million in 2014, with $239.9 million (34.9 percent) awarded to MWOBs. [See Figure 3.]
| Figure 3 Total Contract Dollar Awards | |||||
|---|---|---|---|---|---|
| 2014 | 2015 | 2016 | 2017 | 2018 | |
| Total | $686.8 | $858.4 | $508.8 | $523.7 | $499.5 |
| 100.0% | 100.0% | 100.0% | 100.0% | 100.0% | |
| MWOB | $239.9 | $211.6 | $93.9 | $96.7 | $122.5 |
| 34.9% | 24.7% | 18.5% | 18.5% | 24.5% | |
| Minority Owned (MO) | $143.7 | $145.2 | $56.5 | $66.7 | $45.8 |
| 20.9% | 16.9% | 11.1% | 12.7% | 9.2% | |
| Women Owned (WO) | $132.6 | $104.2 | $47.4 | $46.2 | $83.0 |
| 19.3% | 12.1% | 9.3% | 8.8% | 16.6% | |
| Overlap (Both MO & WO) | $36.4 | $37.8 | $10.0 | $16.2 | $6.3 |
| 5.3% | 4.3% | 1.9% | 3.0% | 1.3% | |
| Asian American | $27.1 | $51.8 | $25.0 | $31.2 | $33.9 |
| 4.0% | 6.0% | 4.9% | 6.0% | 6.8% | |
| Black American | $21.3 | $30.7 | $9.4 | $32.7 | $1.9 |
| 3.1% | 3.6% | 1.9% | 6.2% | 0.4% | |
| Hispanic American | $66.1 | $43.2 | $20.6 | $1.6 | $7.0 |
| 9.6% | 5.0% | 4.0% | 0.3% | 1.4% | |
| Native American | $0.8 | $- | $0.1 | $0.9 | $2.9 |
| 0.1% | 0.0% | 0.0% | 0.2% | 0.6% | |
| Other | $28.4 | $19.5 | $1.4 | $0.3 | $0.1 |
| 4.1% | 2.3% | 0.3% | 0.0% | 0.0% | |
The FDIC's five-year trend from 2014 – 2018 of contract awards and payments can be found at Appendix A.
Contract Awards by North American Industry Classification System
The North American Industry Classification System (NAICS) was developed by the Office of Management and Budget (OMB) and is the standard used by federal statistical agencies in classifying business establishments for the purpose of collecting, analyzing, and publishing statistical data related to the U.S. business economy. The FDIC awarded contracts in 2018 under 66 different NAICS codes. Figure 4 depicts the FDIC's 2018 contracts categorized for the top ten NAICS codes and percentage of the total award value ($499.5 million).
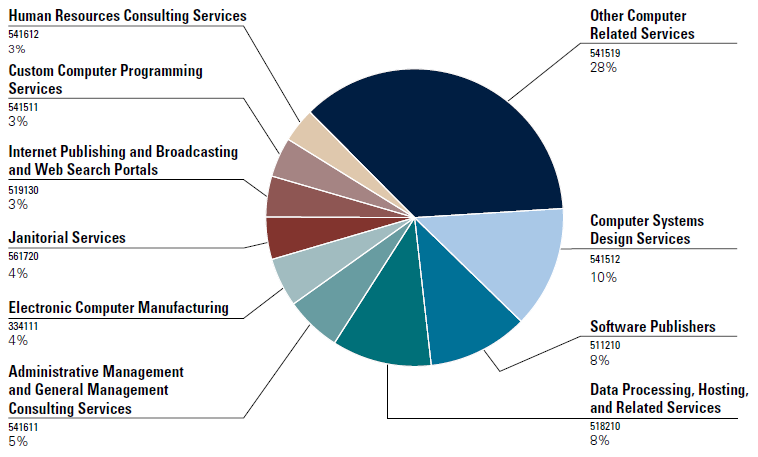
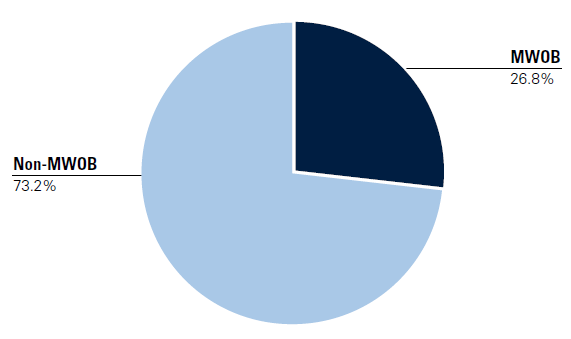
In 2018, these awards consisted of the following: 28 percent for other related computer services; 10 percent for computer systems design services; 8 percent for software publishers; and 8 percent for data processing, hosting, and related services. The remaining 22 percent – each five percent or under – was awarded in the areas of administrative management and general management consulting services (five percent); electronic computer manufacturing (four percent); janitorial services (four percent); internet publishing and broadcasting and web search portals (three percent); custom computer programming services (three percent); and human resources consulting services (three percent). Collectively, 26.8 percent of the top ten NAICS code contracts were awarded to MWOBs. [See Figure 5.]
The 2018 FDIC contract awards associated with the top ten NAICS codes can be found in Appendix B.
Legal Contracting
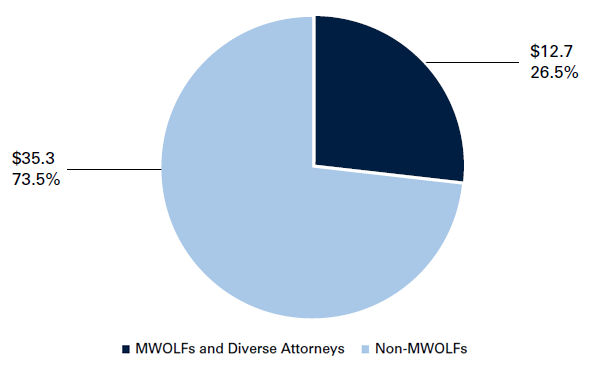
The Legal Division's legal contracting program endeavors to maximize the participation of both minority and women owned law firms (MWOLFs) and minority and women partners and associates employed at majority owned firms (Diverse Attorneys) in legal contracting. This approach is consistent with Section 342 of the DFA that encourages diversity and inclusion at all levels. Taken together, FDIC paid $12.7 million to MWOLF firms and Diverse Attorneys out of a total of $48.0 million dollars paid to outside counsel in 2018 [See, Figure 6.] For both MWOLFs and Diverse Attorneys, FDIC legal matters provide important learning and professional client development opportunities that can be quite meaningful to career advancement. For the year 2018, the Legal Division has an aggregate 26.5 percent diversity and inclusion participation rate in legal contracting.
MWOLFs and Diverse Attorneys (in millions).
Referrals to Law Firms
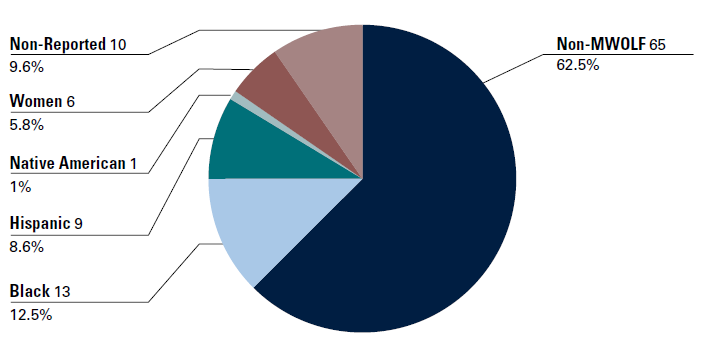
Referrals to law firms are typically made on a competitive basis. Price, expertise, capacity, and diverse status are among the criteria considered in making the selections. The FDIC made 104 referrals to outside counsel in 2018, of which 29 (28 percent) were to MWOLFs, compared to a total of 363 referrals, of which 67 (18.4 percent) were to MWOLFs in 2017. Referrals to MWOLFs in 2018, by category, were as follows: Black American – 13 (12.5 percent), Hispanic American – 9 (8.6 percent), Native American – 1 (<1 percent), and Women – 6 (5.8 percent). [See Figure 7.]
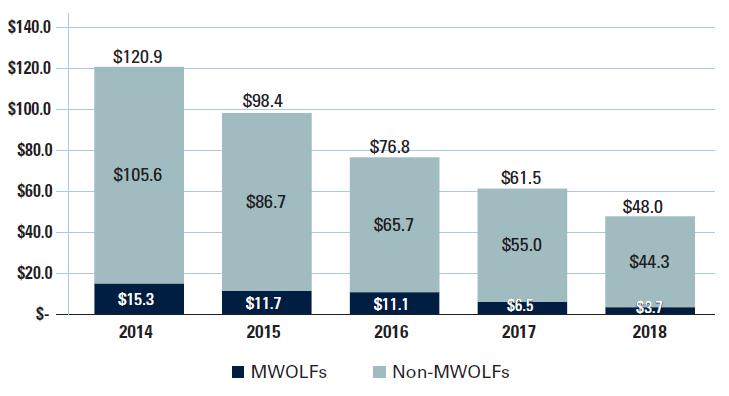
Bank resolution activities are a major source of outside counsel work, and that activity decreased from 2017 to 2018. In 2018, the FDIC paid $48.0 million to outside counsel, as compared to $61.5 million in 2017. The FDIC paid $3.7 million to MWOLFs in 2018, which represents 7.7 percent of the total paid to all law firms. This percentage is below that of 2017, during which the FDIC paid a total of $6.5 million to MWOLFs, which was 10.5 percent of the total paid to all law firms that year. The decrease in bank resolution activity is consistent with the overall decline in FDIC fees spent on outside counsel since the peak levels in 2013 [See Figure 8.]
Although there was an overall decline in referrals to all outside counsel in 2018, there was an increase in the percentage of referrals to MWOLF firms in 2018 over 2017, 28 percent in 2018 versus 18.4 percent in 2017. The FDIC remains committed to seeking ways to increase the level of referrals and fees paid to MWOLFs and Diverse Attorneys in 2019 and beyond.
Referrals to Diverse Attorneys
Section 342 of the DFA encourages the FDIC to develop and implement standards and procedures to ensure, to the maximum extent possible, the fair inclusion and utilization of minorities, women, and minority-owned and women-owned businesses in contracting at all levels. Another benefit of FDIC's diversity and inclusion efforts in legal contracting is the training and professional development opportunities afforded minority and women partners and associates who work on FDIC legal matters that are referred to majority owned law firms. The employment and training of individual Diverse Attorneys contributes significantly toward enhancing diversity and inclusion in the legal profession by providing opportunities for drafting legal documents, entering court appearances and, developing client relationships which all further the partnership potential of Diverse Attorneys.
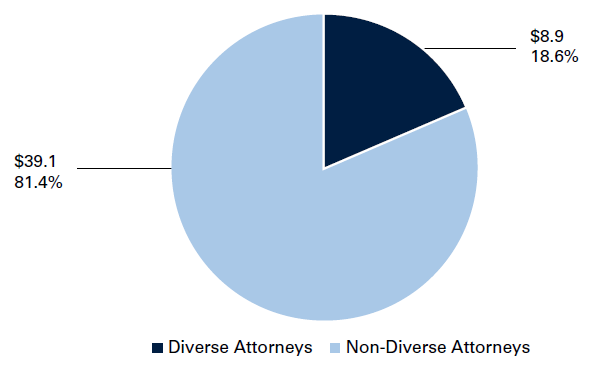
In 2018, Diverse Attorneys at majority- owned law firms billed $8.9 million on FDIC legal matters or 18.6 percent of total payments to outside counsel. [See Figure 9.] Despite the Legal Division's diminishing annual expenditures on outside counsel services, FDIC referrals to outside counsel offer a consistently high level of learning and professional development opportunities to both MWOLFs and Diverse Attorneys. The Legal Division will continue to promote this participation and monitor these fees in addition to those fees paid to MWOLF firms.
at Majority Law Firms (in millions)
Outreach to MWOLFs
The keystone of the Legal Division diversity and inclusion outreach is the FDIC's partnerships with minority bar associations and specialized stakeholder organizations. In 2018, the FDIC Legal Division participated in six minority bar association conferences and three stakeholder events in support of maximizing the participation of MWOLFs and Diverse Attorneys in FDIC legal contracting. FDIC representatives at these events participated on several panels and committees, such as the National Association of Minority and Women Owned Law Firms (NAMWOLF) Advisory Council, the NAMWOLF Events Committee, the NAMWOLF Law Firm Admissions Committee, and the NAMWOLF Diversity and Inclusion Initiative.
In 2018, NAMWOLF formally recognized the FDIC as a principal member of, and major contributor to, its Inclusion Initiative, a collaborative program among law departments of major corporations designed to increase the participation of MWOLF firms in legal contracting. Members of the Inclusion Initiative have spent over $1 billion with MWOLF firms since its inception. The FDIC participates in the Inclusion Initiative along with major corporations.
The Legal Division's objective is to promote diversity and inclusion in its legal contracting opportunities by producing tangible, meaningful, and measurable results. The most important source of legal contracting opportunities lies with the FDIC in-house attorneys. To that end, in 2018 the Legal Division continued to work closely with in-house attorneys in areas that account for a substantial dollar amount of legal referrals and posed the greatest opportunities for participation. The Legal Division, among other things, consistently emphasizes the importance of diverse staffing of legal contracts to its attorneys in its regional offices. For example, the Legal Division held its annual MWOLF Outreach Workshop in the Dallas Regional Office for those in-house FDIC attorneys, who assign work to outside counsel. The purpose of the workshop was to focus on the contribution of the FDIC in-house attorneys in supporting the goal of diversity and inclusion in legal contracting. The program included a review of the prior year's diversity statistics, planned projects, question and answers and, the solicitation of ideas from the attorneys for improving the selection and retention of outside counsel.
The Legal Division recognizes the value of involving FDIC in-house attorneys in its MWOLF outreach. In 2018 the Legal Division collaborated with a top rated New York MWOLF firm to present a full day continuing education seminar on cutting edge legal issues in the capital markets area to FDIC attorneys who are responsible for engaging outside counsel. The program was designed to showcase the MWOLF's expertise while providing the firm with valuable opportunities to build meaningful relationships with FDIC oversight attorneys at headquarters and in the regional offices. In its ongoing diversity and inclusion efforts, the Legal Division continues to seek more opportunities to highlight the expertise of MWOLF firms in accordance with the needs of the FDIC at any given point in time.
The Legal Division evaluated and approved six new MWOLF applications in 2018. Firms from various geographic areas were added to the FDIC List of Counsel Available in order to be eligible to receive legal contracting work. In addition to the outreach efforts noted above, the Legal Division continues to provide technical assistance to other related government agencies on developing MWOLF outreach programs that mirror FDIC's program.
Diversity and Inclusion Assessments
Pursuant to Section 342 of the DFA, which requires an assessment of legal contractors' internal workforce diversity practices, the Legal Division refined and continued to implement a system of compliance reviews of the top ten billing law firms (both majority-owned and MWOLFs). This program provides the Legal Division with an additional means to address diversity and inclusion and provides opportunities for minority and women attorneys seeking to provide services. These on-site assessment visits are designed to engage firms in discussions about diversity best practices, staffing concepts, metrics and the Legal Division's diversity and inclusion program. The assessment results continue to show progress toward increase diversity and inclusion. In addition to collecting baseline diversity metrics, FDIC's Legal Division keeps apprised of innovative diversity strategies, new opportunities for inclusion, pursuant to this program. Further, the Legal Division reaches commitments with various firms to increase diverse staffing on FDIC legal matters. As a result, the FDIC has witnessed a meaningful shift in the diversity and inclusion efforts at many of the largest majority owned outside firms to which FDIC refers legal work since the inception of the assessment program.
Contracting Initiatives, Programs and Outreach
The FDIC awarded 565 new contracts with a combined value of $499.5 million in 2018. The number of new contracts awarded in 2018 represents the fewest number of awarded contracts by the FDIC since 2009, and represents a 56 percent decrease from the average number of contracts awarded annually between 2009 and 2017. The total contract award dollars in 2018 of $499.5 million represents the lowest contract award value since 2008, and a 74 percent decrease in the average total contract dollars awarded during the height of the financial crisis from 2009 to 2012. As stated in prior year reports, the FDIC annual contract awards have fallen since the height of the financial crisis due to a significant reduction in annual bank failures. There were no bank failures in 2018. During the financial crisis, contracts related to services required to resolve failed banks represented up to 85 percent of all FDIC contract dollars awarded in a given year. In 2018, only 13.9 percent of FDIC total contract dollars awarded supported the FDIC's Division of Resolutions and Receiverships (DRR) in their mission to resolve failed banks.
As a result, the FDIC continued to identify contracting opportunities for MWOBs in non-financial goods and services requirements. For example, contracts were awarded to MWOBs in the following areas: IT consulting, software development and maintenance services; IT security services; IT hardware and software licenses; training services; shuttle bus services; janitorial services; deskside coaching services, video production services; facilities services; and equal employment opportunity (EEO) investigation services.
Despite no bank failures in 2018, the FDIC continued to include MWOBs in the procurement process for the financial services contract opportunities that arose. Several of the contracts used to perform failed bank resolution services during the most recent financial crisis expired in 2018. The FDIC's strategy is to re-bid these contracts as they expire to ensure contractor resources are in place when needs arise. MWOB contractors were instrumental to the FDIC's success during the financial crisis. As a result, the FDIC focused on ensuring MWOB participation in the re-competition of these expiring contracts, as well as contracts for financial services that previously were not required. MWOB firms were awarded new contracts in 2018 for financial advisory services-complex financial institution (CFI) non-deposit claims; receivership financial accounting and reporting; qualified financial contracts (QFC) portfolio valuation and consulting services; strategic communications advisory services; accounting services; and audit services that will be used to support future bank failures. Additional existing failed bank resolution contracts will expire in 2019 and beyond. The FDIC will continue to identify opportunities to include MWOBs in the re-competition of these mission critical services. In addition, the FDIC awarded task orders to MWOBs under existing contracts in 2018 to support planning for future bank failures and for services to resolve pre-2018 bank failures.
Lastly, FDIC continued to discuss procurement strategies and MWOB contracting initiatives at regular EAC meetings attended by senior managers from FDIC divisions and offices. The FDIC also continued to implement the recommendation to hold pre-proposal conferences to ensure businesses understand the FDIC's requirements before a solicitation is issued and to give smaller businesses opportunities to find partners and develop teams before submitting bids.
Information Technology Contracting
The FDIC recognized in 2012 that the declining number of bank failures would result in a significant shift in new contract award opportunities from bank resolution contracts to contracts for daily operations (e.g., IT software development and maintenance, facilities management, etc.). The FDIC conducted focused market research in 2012 to ensure significant MWOB participation in the then upcoming $546.8 million competitive Basic Ordering Agreement (BOA) for the second generation Information Technology Application Services (ITAS II) contract which was awarded in 2013. In 2016, additional firms were competitively added to the ITAS II BOA. Currently, 7 of the 14 firms (50 percent) under the ITAS II BOA are MWOBs. Only 1 in 4 firms (25 percent) under the prior ITAS I BOA was an MWOB. The assignment of work to contractors under the ITAS II BOA is accomplished through the award of task orders that are competed among the contractors awarded the BOA. Fifteen of the 29 task orders awarded under ITAS II in 2018 were awarded to MWOBs with a combined value of $24.8 million. This represented 51.7 percent of the total task orders awarded and 48.1 percent of the $51.5 million in total task order dollars awarded. The services provided under the task orders awarded to MWOBs in 2018 were for mission critical services to develop, maintain and enhance FDIC's IT systems.
ITAS II is not the only contract that supports the FDIC's Information Technology program. Three contracts with a combined value of $1.6 million were awarded to MWOBs to provide IT security services and/or FISMA support services.
Lastly, the FDIC also recognizes that IT hardware and software can often be provided by resellers certified by the manufacturer or by MWOB manufacturers. As a result, the FDIC continued with the strategic decision to solicit MWOBs for hardware and software purchases when possible. This strategy resulted in 90 contract awards to MWOBs with a combined value of $40.3 million.
Facilities Management Services
Significant awards to MWOBs in facilities management services included contracts valued at $17.6 million for janitorial services; $7 million for shuttle bus services; $6.2 million for an HVAC project; $913,301 for Video Production Services; and $128,042 for a generator replacement project.
In addition, the FDIC continued to provide opportunities to MWOBs for both new and replacement furniture and carpet. In total, six contracts with a combined value of $888,075 were awarded to MWOBs to provide furniture and carpet for FDIC locations nationwide.
Bank Resolution Contracts
Although there were no bank failures in 2018, there are still over 250 active failed bank receiverships from prior year failures. The FDIC continued to award contracts and task orders to MWOBs to provide required services to resolve pre-2018 bank failures and planning services for future bank failures. In 2018, 37 contracts and task orders with a combined value of $9 million were awarded to MWOBs to provide the required financial services to support the FDIC in resolving past and future bank failures. Contracts awarded to MWOBs included, but were not limited to: accounting services; information security services; information technology development services; financial valuation services; receivership assistance services; temporary staffing services; security assessment services; internet marketing and sales services; tax services; and translation and transcreation services for conveying messages in another language.
Other Significant MWOB Contract Awards
Recognizing the need to expand MWOB contract awards beyond services for bank resolutions, information technology, and facilities management, the FDIC looked for MWOB opportunities in other program areas. The FDIC's Corporate University awarded a contract with a value of $180,375 to an MWOB firm to provide learning and curriculum development services. The FDIC's Legal Division awarded a $1.8 million contract to an MWOB to provide deskside coaching services. The FDIC's Division of Depositor and Consumer Protection awarded two contracts with a combined value of $371,844 to an MWOB firm to provide information security awareness training. The Office of Inspector General awarded a $686,078 contract to an MWOB for IT support services. The Office of Minority and Women Inclusion awarded a $1 million contract to an MWOB for EEO investigative services.
Outreach to MWOBs
In 2018, the FDIC participated in a combined total of 36 business expos, one-on-one matchmaking sessions, and panel presentations. The FDIC and other OMWI agencies presented as panelists during various procurement events including the Reservation Economic Summit (RES), the Annual Government Procurement Conference and the United States Pan Asian American Chamber of Commerce, educating attendees about doing business with their agencies. At the various outreach events, the FDIC staff provided information and responded to inquiries regarding the FDIC's business opportunities for minorities and women. In addition to targeting MWOBs, Minority and Women Owned Investors, and MWOLFs, these efforts also targeted veteran-owned and small disadvantaged businesses. Vendors were also encouraged to register through the FDIC's CRL.
The eight OMWI agencies co-hosted the Smart Contacts – Smart Contracts Technical Assistance Event in collaboration with the University of Texas San Antonio, Institute for Economic Development, Minority Business Development Agency and the Business Center San Antonio. The event was held August 29, 2018, in San Antonio, Texas. The featured presenters' topics were Smart Tactics, Tools, and Resources for Connecting the Dots, and Smart Federal Proposal Writing. Other highlights of the event included the Doing Business with the OMWI Agencies panel, Local Resource Partner Panels, and various Resource Panels exhibiting at the event including a joint OMWI resource table. There were 199 attendees at this event.
In addition, the FDIC attended the 2018 Puerto Rico Federal Business Opportunities Conference to identify MWOBs to do business with FDIC. This conference has been successful in identifying mature firms that were able to compete and win significant work with FDIC. This was a structured program that included networking and matchmaking sessions. Attending a similar conference and including firms from that conference in the 2012 competitive acquisition for the second generation Information Technology Application Services (ITAS II) contract directly resulted in the competitive award of over $48 million dollars from 2013 to 2018 to a Hispanic firm that FDIC was introduced to at the conference.
FDIC Asset Sales
In its role as receiver, the FDIC Division of Resolution and Receivership manages and sells retained bank assets acquired from failed financial institutions. The assets are sold and proceeds used to pay out depositors and replenish the deposit insurance fund. To promote MWOB participation in FDIC asset sales DRR in collaboration with OMWI host asset purchaser events. These events are marketed extensively to minority- and women-owned investors and companies to raise the awareness and provide information on how to purchase owned real estate (ORE) through DRR's Owned Assets Marketplace and Auctions Program, as well as other loans and ORE assets from the FDIC, through cash loan sales and structured transactions. These events are generally held in association with failed bank activity. No events were held in 2018, as there were no bank failures.
Challenges
As noted earlier, the FDIC's annual number of new contracts awarded and total contract dollars awarded has declined significantly since the height of the financial crisis due to the significant reduction in the number of bank failures. From 2009 to 2012, the FDIC's annual contract awards ranged between $1 billion and $2.6 billion. During this timeframe, up to 85 percent of all contract dollars awarded annually supported bank failure activity. In 2018, total FDIC contract dollars awarded were $499.5 million, which represented the lowest total value of new contracts awarded since 2008, and total contracts awarded were 565, which represented the fewest contracts awarded since 2009. Only 13.9 percent of contract dollars awarded supported bank failure activity. Non-financial goods and services contracts for supporting daily operations are continuing to represent a larger percentage of the FDIC's annual contract awards. In years when there are few bank failures, these non-financial recurring goods and services contracts represent the majority of FDIC contract awards. Typical contract awards for non-financial goods and services (e.g., dental, life, and vision insurance for employees; subscription services; office supplies; security guard services; facilities management services; and IT services) may range from $300 million to $500 million annually.
While smaller firms that are not national in scope are capable of providing some of the FDIC's required recurring services, in many cases there are significant administrative advantages to having fewer contractors provide these services to ensure consistent implementation of FDIC programs throughout the FDIC's 80 plus offices nationwide. However, for each new contract, the FDIC explores alternative strategies to determine if a change in procurement strategy can increase competition while still providing cost and administratively effective services. One example of a strategy change that was successful to increase MWOB participation was the ITAS II BOA described earlier. Despite expanded market research and proposed strategy changes, the FDIC has not found success to date with some of the other larger contracts that make up a disproportionate share of the total dollars awarded. Examples of this are the dental, life and vision insurance benefits programs for employees and the management of the FDIC's student residence center and cafeterias. The FDIC will continue to explore procurement strategy changes where feasible.
An additional challenge the FDIC will face is the unknown impact on new contract awards that the implementation of updated National Institute of Standards and Technology (NIST) security standards will have on future FDIC contracts. These standards pertain to contracts where the FDIC provides confidential, sensitive, or personally identifiable information to a contractor to host the information on a third party system that is not directly owned by the federal government or the FDIC. The FDIC implemented new contract clauses that incorporated these new security standards in late 2018. These new contract clauses include additional information technology security controls that were not included in previous FDIC contracts. Since the new contract clauses add additional requirements to protect FDIC's information, the possibility exists that some firms may elect to not bid on an FDIC contract. This may occur if the contractor's security systems do not meet FDIC's new standards.
Despite the decline in contract dollars awarded, the FDIC through its aggressive outreach program continues to educate and equip MWOBs with the tools they need to compete for contracting opportunities. These programs resulted in an increase in total contract dollars awarded to MWOBs from 18.5 percent in 2017 to 24.5 percent in 2018, and total contracts awarded to MWOBs from 28.5 percent in 2017 to 29.4 percent in 2018. The FDIC will continue to assess and analyze future contracting needs to determine where MWOB opportunities may exist or if new methods of service delivery are feasible.
EMPLOYMENT AT THE FDIC:
Increasing Representation of Minorities and Women
The FDIC is committed to creating and maintaining a workforce representative of all segments of society. The following sections provide information on current levels of diversity within the agency, initiatives to promote diversity and inclusion, as well as challenges the agency faces in its efforts to promote greater diversity within hiring and employment.
Diversity in Employment and Hiring
As of December 31, 2018, minorities accounted for 29.8 percent (1,760) of the FDIC's total workforce (permanent and non-permanent) of 5,911 employees, and women accounted for 44.8 percent (2,648). [See Figure 10.] More specifically, the representation percentages in the total workforce for various minority groups at the end of December 2018 were as follows: 1.6 percent for people of two or more races, 0.6 percent American Indian or Alaska Native (AIAN), 5.9 percent Asian American, 17.5 percent Black American, and 4.2 percent Hispanic American.
Figure 10 Diversity in Total –
(Permanent and Non-Permanent) Employment as of 12/31/2018
| Minority | Non-Minority | Total | |
|---|---|---|---|
| Number | 1760 | 4151 | 5911 |
| Percent | 29.8% | 70.2% | 100.0% |
| Men | Women | Total | |
|---|---|---|---|
| Number | 3263 | 2648 | 5911 |
| Percent | 55.2 | 44.8 | 100.0% |
| 2 or More | AIAN | Asian | Black | Hispanic | White | Total | |
|---|---|---|---|---|---|---|---|
| Number | 94 | 33 | 348 | 1037 | 248 | 4151 | 5911 |
| Percent | 1.6% | 0.6% | 5.9% | 17.5% | 4.2% | 70.2% | 100.0% |
The racial, ethnic, and gender diversity of the FDIC's workforce overall has improved slightly since the passage of Section 342 of the DFA. Minorities accounted for 26.2 percent of the FDIC's permanent workforce as of July 31, 2010, and 29.8 percent as of December 31, 2018. The percentage of women in the FDIC's permanent workforce was 43.6 percent as of July 31, 2010, and 44.8 percent as of December 31, 2018. [See Appendix C.]
As of December 31, 2018, minorities accounted for 17.6 percent (24) of the FDIC's total Executive Manager (EM) workforce of 136 employees, and women accounted for 36.0 percent (49). [See Figure 11.]
Figure 11 Diversity in Total (Permanent and Non-Permanent) Employment –
Executive Manager Workforce as of 12/31/2018
| Minority | Non-Minority | Total | |
|---|---|---|---|
| Number | 24 | 112 | 136 |
| Percent | 17.6% | 82.4% | 100.0% |
| Men | Women | Total | |
|---|---|---|---|
| Number | 87 | 49 | 136 |
| Percent | 64.0% | 36.0% | 100.0% |
| 2 or More | AIAN | Asian | Black | Hispanic | White | Total | |
|---|---|---|---|---|---|---|---|
| Number | 0 | 1 | 5 | 15 | 3 | 112 | 136 |
| Percent | 0.0% | 0.7% | 3.7% | 11.0% | 2.2% | 82.4% | 100.0% |
The racial, ethnic, and gender diversity of the EM workforce overall has increased since the passage of Section 342 of the DFA. Of the FDIC's total EM workforce, minorities accounted for 15.7 percent as of July 31, 2010, and 17.6 percent as of December 31, 2018. The percentage of women in the FDIC's EM workforce was 25.0 percent as of July 31, 2010, and 36.0 percent as of December 31, 2018. Appendix C depicts the FDIC's five-year trends for the total, permanent, and EM workforce for 2014 through 2018.
Initiatives to Promote Diversity in Employment
The FDIC promotes its commitment to a diverse workforce through a wide variety of methods aimed at attracting, recruiting, hiring, and retaining high-performing individuals who reflect the diversity of our society. The FDIC's largest occupational group is bank examiners. The recruitment of entry-level examiners as Financial Institution Specialists (FIS), is conducted primarily through the FDIC's Corporate Employee Program (CEP).
OMWI tracked and informed FDIC leadership about the representation and attrition rates for CEP participants based on race, ethnicity, and gender. Reports on participation rates were prepared following each incoming class of CEP hires, and each report included the total CEP participants from the inception of the program, FISs currently onboard, and voluntary and involuntary attrition information.
For the years before the inception of the CEP in 2005, several racial, ethnic and gender groups, as well as employees with disabilities, had low representation rates in the FDIC's examiner workforce. To help address these issues, the FDIC has engaged in a proactive recruitment effort and has used recruiting strategies that have been successful in improving low representation rates of several racial, ethnic, and gender groups. That progress is especially apparent with respect to the overall percentage of women in the examiner workforce, which increased from 33.5 percent as of December 31, 2004, to 38.8 percent as of December 31, 2018. In addition, the percentages of Black American men and women, Hispanic American women, Asian American men and women, American Indian or Alaska Native men, and White women in the overall examiner workforce all have increased since the beginning of the CEP. Despite the positive progress in those areas, the representation rates of Hispanic American men and women, Asian American men and women, Black American women, and women of two or more races in the FDIC's examiner workforce remain below the Civilian Labor Force (CLF) benchmark for the occupational series.
Also, since the inception of the CEP, overall hiring rates have been at or above the percentages in the CLF for American Indian or Alaska Native men and women, Black American men and women, and men of two or more races, but lower than the CLF for Asian American men and women, Hispanic American men and women, White women, and women of two or more races. [See Figure 12.] The overall minority hiring rate since the inception of the CEP has been 27.4 percent; and the overall hiring rate for women has been 38.9 percent.
| Figure 12 CEP Hires Since Inception | |||||||||||||
|---|---|---|---|---|---|---|---|---|---|---|---|---|---|
| 2 or More | AIAN | Asian | Black | Hispanic | White | Total | |||||||
| Women | Men | Women | Men | Women | Men | Women | Men | Women | Men | Women | Men | ||
| CEP | 17 | 21 | 4 | 11 | 41 | 59 | 182 | 117 | 37 | 45 | 476 | 937 | 1947 |
| % | 0.9% | 1.1% | 0.2% | 0.6% | 2.1% | 3.0% | 9.3% | 6.0% | 1.9% | 2.3% | 24.4% | 48.1% | 100.0% |
| CLF | 1.0% | 0.6% | 0.2% | 0.1% | 3.7% | 3.5% | 8.4% | 3.4% | 3.7% | 3.1% | 28.3% | 44.1% | 100% |
During 2018, the CEP hiring rates were at or above the CLF percentages for Asian American women, Black American men, White women, and men and women of two or more races, and were below the CLF for American Indian or Alaska Native women and men, Asian American men, Black American women, Hispanic American men and women, and White men. While the hiring rates appear to be normal annual fluctuation in most cases, targeted recruitment will continue in order to reach Black American women, Asian men, and Hispanic American women and men. [See Figure 13.] The overall hiring rate in 2018 for minorities and women was positive with minorities having little statistical disparity from the CLF and women hired at a rate above the CLF.
| Figure 13 CEP Hires in 2018 (Classes 63-67) | |||||||||||||
|---|---|---|---|---|---|---|---|---|---|---|---|---|---|
| 2 or More | AIAN | Asian | Black | Hispanic | White | Total | |||||||
| Women | Men | Women | Men | Women | Men | Women | Men | Women | Men | Women | Men | ||
| CEP | 3 | 4 | 0 | 0 | 5 | 4 | 9 | 5 | 4 | 1 | 42 | 59 | 136 |
| % | 2.2% | 2.9% | 0.0% | 0.0% | 3.7% | 2.9% | 6.6% | 3.7% | 2.9% | 0.7% | 30.9% | 43.4% | 100% |
| CLF | 1.0% | 0.6% | 0.2% | 0.1% | 3.7% | 3.5% | 8.4% | 3.4% | 3.7% | 3.1% | 28.3% | 44.1% | 100% |
As a significant component of the recruitment strategy for entry-level examiners, FDIC recruiters participated in job fairs aimed at targeted professional audiences and maintained ongoing relationships with a wide range of colleges and universities. This includes 126 institutions designated as Hispanic Serving Institutions, Historically Black Colleges and Universities (HBCUs), and other minority-serving institutions, tribal colleges and universities, and institutions with significant student populations of women, and minorities.
With regard to targeting professional audiences, in 2018, FDIC recruiters attended 22 national diversity outreach events and 6 regional outreach events to increase awareness of the FDIC as an employer of choice to professionals. The FDIC also met with key leaders in Hispanic American, Black American, Asian American, women's, and veterans' organizations as well as organizations representing people with disabilities to create awareness of FDIC careers and identify opportunities to expand outreach to their members. For example, the FDIC participated in the 2018 Association of Latino Professionals for America (ALPFA) National Convention.
With respect to recruiting students (both traditional and non-traditional), FDIC corporate recruiters participated in 203 college career fairs, 11 information sessions, and other recruitment-related campus activities throughout the United States to brand the FDIC and attract qualified candidates. Recruitment efforts during 2018 also included the following:
Hosted two student workshops at the 2018 ALPFA National Convention entitled Career Choices (Passion vs Salary), inspiring students to consider various factors during their search for employment.
Hosted a student workshop at the 2018 Hispanic Association of Colleges and Universities (HACU) Annual Conference, Money Management and Wealth Building Skills: College and Beyond, educating students on advanced money management skills that will assist them in achieving their financial goals.
Organized participation in the CyberCorps Scholarship for Service Virtual Career Fair in support of expanding awareness and interest in cybersecurity positions at the FDIC.
Hosted a workshop at the 2018 Thurgood Marshall Leadership Institute on personal branding for students from HBCUs. FDIC representatives also conducted informational interviews for the Financial Management Scholars Internship Program during the Leadership Institute.
To assist in increasing participation rates for underrepresented groups in the non-examiner occupations listed above, the FDIC recruitment plan includes strategies for outreach to prospective applicants for entry-level positions in these occupations throughout the agency. In 2018, these efforts led to increased level of minority representation within the economist occupation at FDIC. The FDIC's Division of Insurance and Receiverships (DIR), where the majority of the FDIC's economists reside, partnered with Delaware State University (DSU) to improve the diversity pipeline of economic applicants for Economic Research Assistants and intern positions. Recruiters met with DSU staff and students to expand the students' knowledge of how pursuing a degree in economics can benefit their careers. Staff participated in DSUs Delaware Executive Exchange Program (DEEP) Day. DEEP Day was developed to provide students with an opportunity for professional development, while engaging with top-level executives. In 2019, DIR plans to establish partnerships with other HBCUs.
In an effort to cultivate and strengthen diversity outreach for entry-level positions through alumni relationships with universities and colleges, DIR established an alumni log for Economists, Economic Analysts, and Economic Research Assistants. The log has served as a reference tool for DIR recruiters when attending outreach events and career fairs at universities across the U.S. The FDIC also conducted outreach to minority and women professional economist organizations to gain access to listservs or distribution networks that might expand FDIC's pipeline to qualified Economic Research Assistants and interns.
In addition, the EAC held a discussion on recruiting from a diverse pipeline, after a presentation on that subject was conducted by the Human Resource Branch.
Diversity and Inclusion Analytics Dashboard
Included in the FDIC's Diversity and Inclusion Strategic Plan is the goal to develop structures and strategies to equip FDIC leaders with the ability to manage diversity, measure results, refine approaches on the basis of available data, and institutionalize a culture of inclusion. In addition, after reviewing several financial services industry regulators in 2013, the U.S. Government Accountability Office (GAO) recommended that the agencies report on efforts to measure the progress of their employment diversity and inclusion practices, including measurement outcomes as appropriate, to indicate areas for improvement as part of their annual reports to Congress.3.
To implement its strategic plan and address the GAO recommendation, the FDIC developed a workforce analytics dashboard to provide actionable data to senior leadership on the FDIC workforce by gender and minority status, and by division/office, region, race, ethnicity, occupation, grade level, and employment type (permanent and non-permanent). The analytics dashboard has been an important management tool for diversity and inclusion since being launched on June 20, 2013. It allows FDIC senior leaders to support diversity and inclusion efforts in hiring, promotion and retention, and to identify ways to make improvements over time.
The dashboard was used during 2018 by FDIC divisions and offices to support recruitment activities geared toward increasing the pool of minority and women applicants; assess the inclusion of minorities and women at all levels of the organization; and evaluate diversity-related issues reported in the Federal Employee Viewpoint Survey. Senior leaders have access to workforce data that are updated quarterly and give them the ability to develop strategies, measure progress and adjust plans where needed. The FDIC will continue to identify additional enhancements to the dashboard that will permit senior leaders to continue understanding and advancing diversity and inclusion within their organizations. As in past years, the FDIC will use data from the dashboard in 2019 to help drive diversity and inclusion strategic plans at the division and office levels.
3. Trends and Practices in the Financial Services Industry and Agencies after the Recent Financial Crisis, GAO-13-238, April 16, 2013
Succession Planning
Like many other federal agencies, the FDIC faces potential succession management challenges as many of its long-term, experienced employees become eligible for retirement. Introduced in 2014, the FDIC's Workforce Development Program (WDP) seeks to prepare employees to fulfill current and future workforce capability and leadership roles. This focus will help to ensure that the FDIC has a workforce positioned to meet today's core responsibilities while preparing to fulfill its mission in the years ahead.
During 2018, the FDIC continued to develop and implement the WDP to address comprehensive succession planning needs and workforce development challenges and opportunities. The FDIC is committed to building and growing its talent pipeline to ensure succession challenges are met. To that end, the agency expanded its succession planning efforts approach to include a survey of 4,000 non-supervisory employees occupying positions that could populate the agency's longer term pipeline for management positions. The survey was designed to identify the population's aspiration to higher level and management roles, their perceptions of readiness for these opportunities and actions they have taken to prepare themselves.
In 2018, the FDIC analyzed the results, finding that nearly two-thirds of mid-level non-supervisor respondents reported that they were interested in seeking higher-level positions at the FDIC. Of these, over three-fourths believe they have the talents and skills for higher level positions and plan to apply for promotions and details over the next five years, demonstrating their ongoing interest in career development. The FDIC also learned that less than half of respondents have discussed their career interests and plans with a manager.
As a result, in 2019, FDIC plans to leverage non-supervisors' interest in higher level and management positions to further develop the longer-term pipeline of the FDIC's aspiring leadership pool. Plans include supervisory training in succession management techniques, the development of resources to support career planning discussions between managers and staff, and promotion of emerging manager coaching through FDIC's Career Management Program.
In 2019, the FDIC will continue to develop and implement the strategies and programs to support the goal of meeting its long-term workforce needs. OMWI collaborates closely on these efforts and helps to ensure that minorities and women have an equal opportunity to participate.
Inclusion Initiatives
The FDIC continues to engage in initiatives to support inclusion and retention efforts within the agency, and the FDIC's Diversity and Inclusion Education Series is an integral component of building workforce inclusion. Annually, OMWI hosts 10 corporate-wide observances as part of its education series. The education series raises cultural awareness and fosters an environment of cultural intelligence, providing a safe space to share histories and experiences.
Additionally, the 2018 FDIC Performance Goal to promote diversity, inclusion, and workplace excellence, through the roll out of Diversity 101 online training for FDIC employees, was successfully accomplished. The FDIC launched the web-based Diversity 101 training, which is available to all employees and required for new FDIC employees. The training helps employees recognize the importance of inclusion and respect in the workplace and provides techniques on how to respond appropriately in common situations involving diversity dynamics. Completion rates are tracked and reports are periodically shared with agency executives at EAC meetings.
In 2018, the FDIC continued to leverage the Chairman's Diversity Advisory Councils (CDACs) to integrate diversity and inclusion efforts throughout the agency. The CDACs were established to assist the OMWI to break down barriers, increase awareness of cultural differences, and promote inclusion and collaboration among all employees. The CDACs are comprised of six regional, two area office, and a headquarter council, with a maximum of nine members per council and, to the extent possible, reflects the general composition of the FDIC's diverse labor force (i.e., different grade levels, positions, and bargaining and non-bargaining status).
The CDACs' mission is to provide advice to the FDIC's Chairman, through the OMWI Director, on any diversity-related issues and concerns. Its objective is to recommend changes in corporate policies and procedures that would foster the FDIC's diversity and inclusion goals and strategies.
In 2018, the CDACs continued to advise senior management regarding diversity related issues generated by employees. The councils also assisted and worked with OMWI to sponsor programs that address cultural diversity and promote initiatives that acknowledge and recognize the benefits of the diverse heritages and cultures that exist throughout the Corporation.
The FDIC's Chairman and senior management have strongly supported the CDACs' initiatives. The programs and activities sponsored by the CDACs have brought employees together to demonstrate how diverse backgrounds bond individuals to strengthen the FDIC's mission and goals, and have taken place nationwide at various FDIC offices.
The FDIC also continues to engage with and leverage its ERGs. OMWI staff regularly meets with the ERGs to discuss programs and issues. In 2018, two ERGs briefed the FDIC executives serving on the agency's EAC, and provided information on group accomplishments and planned activities. This exchange initiated discussions on ways in which ERGs can further support diversity and inclusion initiatives at the FDIC. Opportunities for additional briefings will be provided in 2019.
Challenges
A key challenge for the FDIC in promoting diversity at all levels of its workforce continues to be the ability to attract and retain minorities and women in its bank examiner workforce. The examiner occupation represents the largest occupational group at the FDIC and accounts for 46.4 percent (2,743) of the FDIC total workforce (5,911). Individuals who began their FDIC careers as entry-level examiners tend to occupy a significant percentage of executive and managerial leadership positions at the agency, as well as other non-examiner positions in the FDIC. Thus, representation rates within the examiner workforce are key elements to achieving satisfactory representation rates within the broader FDIC workforce.
One of the feeder pools for the CEP program, the FDIC's Financial Management Scholars Program (FMS), has assisted in the diversity of the examiner ranks. The FMS program is an 11-week paid summer internship program for highly-qualified college students. At the end of the program, qualified FMS interns receive post-graduation employment offers with the FDIC under the CEP. The FMS program has hired, in aggregate, above the CLF for women since the inception of the program in 2011. While the pool is small, comprising 262 (46 percent) women out of 570 participants over the life of the program, this success has helped to diversify the pool of potential examiners with regard to gender. Participation for minorities in the FMS program has increased steadily, but has remained below the CLF.
Despite the overall success of the CEP in increasing the percentage of minorities and women in the examiner workforce, those percentages still remain below the CLF for certain groups such as for Asian American men and women, Hispanic American men and women, Black American women, and women of two of more races. CEP attrition data will continue to be monitored and strategies implemented to retain qualified examiner workforce. [See Figure 14.]
| Figure 14 CEP Attrition Rates | |||||||||||||
|---|---|---|---|---|---|---|---|---|---|---|---|---|---|
| Total | 2 or More | AIAN | Asian | Black | Hispanic | White | |||||||
| Women | Men | Women | Men | Women | Men | Women | Men | Women | Men | Women | Men | ||
| Hired | 1947 | 17 | 21 | 4 | 11 | 41 | 59 | 182 | 117 | 37 | 45 | 476 | 937 |
| Involuntary Departures |
39 | 0 | 0 | 0 | 0 | 1 | 1 | 8 | 9 | 1 | 2 | 4 | 13 |
| Involuntary Attrition Rate+(%) |
2.0% | 0.0% | 0.0% | 0.0% | 0.0% | 2.4% | 1.7% | 4.4% | 7.7% | 2.7% | 4.4% | 0.8% | 1.4% |
| Subtotal | 1908 | 17 | 21 | 4 | 11 | 40 | 58 | 174 | 108 | 36 | 43 | 472 | 924 |
| Voluntary Departures |
666 | 2 | 2 | 1 | 5 | 14 | 30 | 67 | 52 | 11 | 15 | 162 | 305 |
| Voluntary Attrition Rate *(%) |
34.9% | 11.8% | 9.5% | 25.0% | 45.5% | 35.0% | 51.7% | 38.5% | 48.1% | 30.6% | 34.9% | 34.3% | 33.0% |
| Number Retained |
1242 | 15 | 19 | 3 | 6 | 26 | 28 | 107 | 56 | 25 | 28 | 310 | 619 |
| + “Involuntary Attrition Rate” is the Involuntary Departures divided by the total hired. * “Voluntary Attrition Rate” is the Voluntary Departures divided by the subtotal. | |||||||||||||
In the non-examiner occupations of economists, financial administration, accountant/auditors, attorneys, and general business and industry, the FDIC faces challenges in attracting and recruiting minorities and women, primarily due to low labor force representation rates for minority groups and women in these occupations. [See Appendix D.]
Despite these challenges, representation of minorities within the economist occupation has improved significantly and is currently above the relevant CLF, with Hispanic American men, Black American women, and Asian American men and women having higher participation rates than the benchmark. Black American men fall below the CLF. Hispanic American women, American Indian or Alaska Native men and women, and men and women of two or more races are absent. Overall, women fall below the CLF within the economist occupation, with Hispanic American women and White women showing the greatest differences from the benchmark.
In the financial administration and program occupation, women overall, Hispanic American men and women, White women, and American Indian or Alaska Native men fall below the CLF. American Indian or Alaska Native men and women of two or more races are absent in this occupation. Overall, minorities are above the CLF for this occupational series.
Women overall, including Hispanic American women, White women, Black American women, Asian American women, American Indian or Alaska Native women, and women of two or more races fall below the CLF in the general business and industry occupation. Men overall, including Hispanic American men, White men, Black American men, Asian American men, American Indian and Alaska Native men, and men of two or more races all exceed the relevant CLF for this occupation.
For the accountant/auditor occupations, Hispanic American men and women, American Indian or Alaska Native men and women, and women of two or more races are absent. White women and Asian American men have a low representation compared to the relevant CLF for the accountant/auditor occupation. In aggregate, minorities are above the CLF benchmark for this occupation while women are below.
In the attorney occupation, minorities in aggregate are above the CLF. However, Hispanic American men and women and Asian American men have participation rates slightly below the relevant CLF in the attorney occupation. Women overall are above the CLF, while men overall are below. Women of two or more races are absent in this occupation.
In 2018, the FDIC continued monitoring race, ethnicity, gender, and grade levels by FDIC divisions and offices. As a result, the FDIC continues expanding outreach and recruitment more broadly to increase minority and women representation at senior levels within the FDIC. The FDIC also issued an updated Diversity and Inclusion Strategic Plan in 2018. Implementation of this plan includes strategies to recruit, advance, and retain a diverse workforce.
OTHER ACTIVITIES
Financial Institutions Diversity
The FDIC's Financial Institution Diversity program is responsible for assessing the diversity policies and practices of FDIC-regulated financial institutions.
The FDIC OMWI continued to work closely with the OMWI Directors of the Office of the Comptroller of the Currency (OCC), the National Credit Union Administration (NCUA), the Federal Reserve Board (FRB), the Consumer Financial Protection Bureau (CFPB), and the Securities and Exchange Commission (SEC) to further implement Section 342(b)(2)(C) of the DFA, which requires regulatory agencies to develop standards for assessing the diversity policies and practices of the institutions they regulate. After publishing the final Interagency Policy Statement Establishing Joint Standards for Assessing the Diversity Policies and Practices of Entities Regulated by the Agencies (Policy Statement), in the Federal Register in June 2015, the FDIC sought OMB approval to collect information from their regulated entities.
The Policy Statement provides the framework for FDIC-regulated financial institutions to voluntarily assess their diversity policies and practices in the following areas:
Organizational Commitment to Diversity and Inclusion
Workforce Profile and Employment Practices
Procurement and Business Practices – Supplier Diversity
Practices to Promote Transparency of Organizational Diversity and Inclusion
Entity's Self-Assessment
The FDIC-regulated financial institutions began using and voluntarily submitting diversity self-assessments to OMWI for the 2016 reporting period. Results of the FDIC's 2016 analyses established the baseline for subsequent reporting periods.
In November 2017, the FDIC's then Acting OMWI Director distributed a letter to the Presidents and Chief Executive Officers of 820 FDIC-regulated financial institutions identified as having 100 or more employees. The letter encouraged these institutions to conduct the annual self-assessment of its diversity policies and practices and submit their diversity information to the FDIC. In March 2018, a reminder letter from the OMWI Director was distributed to financial institutions to again encourage participation.
In 2018, OMWI issued internal procedures related to the processing of diversity self-assessments.
Self-Assessment Benchmarking Results for 2017 Reporting Period
The FDIC received diversity self-assessments from 137 (16.7 percent) of its regulated financial institutions. This was a 44.2 percent increase from the 2016 reporting period (95 financial institutions) to the 2017 reporting period (137 financial institutions).
While the FDIC is pleased with the increased participation of financial institutions in 2017, it will continue to take steps to increase voluntary participation by augmenting outreach at banking conferences, developing financial institution diversity marketing materials, and making improvements to the program website.
The FDIC completed an analysis of the financial industry's diversity policies and practices for the 2017 reporting period and conducted a comparative analysis conducted against the 2016 reporting period for the purpose of monitoring progress and trends of diversity and inclusion in employment and contracting activities. The analysis further provided the opportunity to identify exemplary diversity policies and practices.
The data for the 2016 versus the 2017 reporting period showed a small decrease in the number of financial institutions with designated Diversity and Inclusion Officers and a slight increase in financial institutions with Supplier Diversity Officers. In 2016, 82 of 95 financial institutions had Diversity and Inclusion Officers versus 81 of 137 in 2017. In 2016, 41 of 95 financial institutions had Supplier Diversity Officers versus 44 of 137 in 2017.
Aggregated Assessment of FDIC-Regulated Financial Institutions Policies and Practices - Breakdown by Standard
Subsection 1: Organizational Commitment to Diversity and Inclusion
Based on the 2016 and 2017 data, the organizational commitment to Diversity and Inclusion has increased. This subsection had the second highest overall percent of change from 2016 to 2017 (a six percent increase). The responses indicated the financial institutions embrace the Standards in this subsection. The highest increased response (nine percent) was in reference to the financial institutions that included employment and contracting diversity and inclusion considerations in their strategic plan.
Organizational Commitment to Diversity and Inclusion 2016 versus 2017 Results
| Section II. Assessment of the Financial Institution's Diversity Policies and Practices | 2016 | 2017 | |
|---|---|---|---|
| 1. Organizational Commitment to Diversity and Inclusion | Average: 82% | Average: 88% | |
| 1.1 The financial institution includes diversity and inclusion considerations in both employment and contracting as an important part of its strategic plan for recruiting, hiring, retention, and promotion. | 83% | 92% | |
| 1.2 The financial institution has a diversity and inclusion policy that is approved and supported by senior leadership, including senior management and the board of directors. | 81% | 87% | |
| 1.3 The financial institution provides regular progress reports to the board and senior management. | 75% | 81% | |
| 1.4 The financial institution regularly conducts training and provides educational opportunities on equal employment opportunity and on diversity and inclusion. | 82% | 84% | |
| 1.5 The financial institution has a senior level official, preferably with knowledge of and experience in diversity and inclusion policies and practices, who oversees and directs the financial institution's diversity and inclusion efforts. | 84% | 91% | |
| 1.6 The financial institution takes proactive steps to promote a diverse pool of candidates, including women and minorities, in its hiring, recruiting, retention, and promotion, as well as in its selection of board members, senior management, and other senior leadership positions. | 85% | 93% | |
Subsection 2: Workforce Profile and Employment Practices
The workforce profile and employment practice had the highest average change from 2016 to 2017 (a seven percent increase). These numbers indicated the financial institutions embraced the Standards in this subsection. The highest positive change (14 percent) referred to holding management at all levels accountable for diversity and inclusion efforts. The second highest positive change (10 percent) referred to participation in conferences, workshops, and other events to attract minorities and inform them of employment and promotion opportunities.
Workforce Profile and Employment Practices 2016 versus 2017 Results
| Section II. Assessment of the Financial Institution's Diversity Policies and Practices | 2016 | 2017 | |
|---|---|---|---|
| 2. Workforce Profile and Employment Practices | Average: 77% | Average: 84% | |
| 2.1 The financial institution implements policies and practices related to workforce diversity and inclusion in a manner that complies with all applicable laws. | 94% | 96% | |
| 2.2 The financial institution ensures equal employment opportunities for all employees and applicants for employment and does not engage in unlawful employment discrimination based on gender, race, or ethnicity. | 96% | 98% | |
| 2.3 The financial institution has policies and practices that create diverse applicant pools for both internal and external opportunities that may include:2.3(a) Outreach to minority and women organizations. | 74% | 81% | |
| 2.3(b) Outreach to educational institutions serving significant minority and women student populations. | 66% | 74% | |
| 2.3(c) Participation in conferences, workshops, and other events to attract minorities and women and to inform them of employment and promotion opportunities. | 61% | 71% | |
| 2.4 The financial institution utilizes both quantitative and qualitative measurements to assess its workforce diversity and inclusion efforts. These efforts may be reflected, for example, in applicant tracking, hiring, promotions, separations (voluntary and involuntary), career development, and retention across all levels and occupations of the financial institution, including the executive and managerial ranks. | 79% | 88% | |
| 2.5 The financial institution holds management at all levels accountable for diversity and inclusion efforts, for example, by ensuring that such efforts align with business strategies and individual performance plans. | 69% | 83% | |
Subsection 3: Procurement and Business Practices - Supplier Diversity
Procurement and Business Practices - Supplier Diversity had the lowest average with five percent decrease from 2016 to 2017. In future years, the FDIC expects to see percentage improvement in all of the Supplier Diversity responses.
Procurement and Business Practices – Supplier Diversity 2016 versus 2017 Results
| Section II. Assessment of the Financial Institution's Diversity Policies and Practices | 2016 | 2017 | |
|---|---|---|---|
| 3. Procurement and Business Practices - Supplier Diversity | Average: 24% | Average: 19% | |
| 3.1 The financial institution has a supplier diversity policy that provides for a fair opportunity for minority-owned and women-owned businesses to compete for procurement of business goods and services. This includes contracts of all types, including contracts for the issuance or guarantee of any debt, equity, or security, the sale of assets, the management of the financial institution's assets, and the development of the financial institution's equity investments. | 41% | 31% | |
| 3.2 The financial institution has methods to evaluate its supplier diversity, which may include metrics and analytics related to: 3.2(a) Annual procurement spending. |
23% | 19% | |
| 3.2(b) Percentage of contract dollars awarded to minority-owned and women-owned businesses by race, ethnicity, and gender. | 16% | 14% | |
| 3.2(c) Percentage of contracts with minority-owned and women-owned business subcontractors. | 15% | 13% | |
| 3.3. The financial institution has practices to promote a diverse supplier pool, which may include: 3.3(a) Outreach to minority-owned and women-owned contractors and representative organizations. | 31% | 21% | |
| 3.3(b) Participation in conferences, workshops, and other events to attract minority-owned and women-owned firms and inform them of contracting opportunities. | 20% | 18% | |
| 3.3(c) An ongoing process to publicize its procurement opportunities. | 23% | 16% | |
Subsection 4: Practice to Promote Transparency of Organizational Diversity and Inclusion
The practice to promote transparency of organizational diversity and inclusion had an average positive change of three percent from 2016 to 2017. The highest positive change (seven percent) referred to a financial institution publicizing its policy on its commitment to diversity and inclusion. The second highest positive change (five percent) referred to financial institutions publicizing opportunities to promote diversity with their current employment and procurement opportunities.
Practice to Promote Transparency of Organizational Diversity and Inclusion 2016 versus 2017 Results
| Section II. Assessment of the Financial Institution's Diversity Policies and Practices | 2016 | 2017 | |
|---|---|---|---|
| 4. Practice to Promote Transparency of Organizational Diversity and Inclusion | Average: 51% | Average: 54% | |
| 4.1 The financial institution publicizes its diversity and inclusion strategic plan. | 33% | 32% | |
| 4.2 The financial institution publicizes its policy on its commitment to diversity and inclusion. | 64% | 71% | |
| 4.3. The financial institution is transparent about its progress toward achieving diversity and inclusion in its workforce and procurement activities, which may include the financial institution's current workforce and supplier demographic profiles. | 57% | 59% | |
| 4.4. The financial institution publicizes its opportunities to promote diversity, which may include: 4.4(a) Current employment and procurement opportunities. |
76% | 81% | |
| 4.4(b) Forecasts of potential employment and procurement opportunities. | 23% | 24% | |
| 4.4(c) The availability and use of mentorship and developmental programs for employees and contractors. | 54% | 55% | |
Subsection 5: Financial Institutions' Self-Assessment
In this subsection, the average for financial institutions performing their annual self-assessment from 2016 to 2017 increased by two percent. Financial institutions are still reluctant to publish information pertaining to assessments of their diversity policies and practices, and results remain low at 29 percent.
Financial Institutions' Self-Assessment 2016 versus 2017 Results
| Section II. Assessment of the Financial Institution's Diversity Policies and Practices | 2016 | 2017 | |
|---|---|---|---|
| 5. Financial Institutions' Self - Assessment | Average: 66% | Average: 68% | |
| 5.1 The financial institution conducts an assessment of its diversity policies and practices annually. | 86% | 87% | |
| 5.2. The financial institution monitors and evaluates its performance under its diversity policies and practices on an ongoing basis. | 83% | 87% | |
| 5.3. The financial institution publishes information pertaining to its assessment of its diversity policies and practices. | 28% | 29% | |
Financial Institution Diversity Data
The collective number of self-assessment responses from financial institutions on their workforce and employment practices, reflected an increase from 2016 to 2017. The collective responses received on the supplier diversity questions reflected a decrease for the same reporting periods. As the program matures, the FDIC anticipates the self-assessments in aggregate will provide more data to build trend analysis on financial institution workforce and supplier diversity.
In both the 2016 and 2017 reporting periods Workforce Profile data indicates that approximately 80 percent of the financial institutions reported their diversity data on their workforces, management, and board members.
The data provided from both 2016 and 2017 for Procurement- Supplier Diversity are inconclusive. There was not enough data to analyze or to determine trends for the procurement supplier diversity subsection. The FDIC expects 2018 responses will provide more data to review and analyze.
OMWI Outreach
The OMWIs from eight financial regulatory agencies held the “Financial Regulatory Agencies' Diversity and Inclusion Summit.” The Summit was held at the Federal Reserve Bank of New York on September 13, 2018, and included: the FDIC, OCC, NCUA, FRB, CFPB; the SEC; the Federal Housing Finance Agency; and the Department of the Treasury. The goal of the Summit was to bring together organizations in the financial industry that included entities regulated by the OMWI agencies in order to highlight industry best practices involving diversity and inclusion in employment and procurement practices.
Speakers from various segments of the financial industry discussed practices they have successfully implemented within their organizations to advance diversity and promote inclusion in the workplace, and to increase opportunities for diverse suppliers. The Summit also featured a panel discussion with the FDIC, OCC, SEC, NCUA, and FRB OMWI Directors. The Directors shared highlights on the results of assessments agencies received from their regulated entities. The OMWI Directors closed the Summit by encouraging participants to complete and submit their diversity self-assessments to their respective regulatory OMWI agency in order to contribute to the reports that the agencies release providing trends on diversity and inclusion in the financial industry. These efforts will continue to advance the visibility and adoption of diversity and inclusion practices in the financial industry. The Summit was well-received according to the feedback received from participants.
Exemplary Practices
The FDIC has identified exemplary practices that financial institutions implemented as part of their workforce diversity and inclusion practices. These practices could be considered by other financial institutions. For example the 2017 self-assessments showed:
Some financial institutions implemented or leveraged technology to connect with the public by posting information regarding their Diversity and Inclusion programs and efforts along with related recognitions and awards; while others aligned their Diversity and Inclusion business strategies and individual performance plans through diversity dashboard analytics that incorporate Diversity and Inclusion goals related to recruitment, hiring, and/or development.
Financial institutions identified, attracted, recruited and trained a diverse and qualified workforce by participating on the board of colleges; utilizing minority and women owned recruiting firms; reaching out to low income, minority-majority local high schools and offering internships to students; and partnering and collaborating with professional diversity organizations, HBCUs, HACU, local non-profits and other diversity organizations to provide internship and learning opportunities. Several financial institutions established successful programs focusing on leadership, personal development and recruitment of recent college graduates.
Financial institutions implemented formal supplier diversity programs to provide opportunities for minority and women-owned businesses to compete for procurement of business goods and services, and required the inclusion of minority- or women-owned businesses in bid opportunities.
Financial institutions are also developing systems to facilitate the augmentation of demographic and procurement information. When vendor demographics are reflected in the market that matches an institution's business and contractual needs, minority- or women-owned businesses are included in bid opportunities.
Contractors' Workforces Fair Inclusion
Section 342(c) of the DFA requires that OMWI ensure, to the maximum extent possible, the fair inclusion of minorities, women, and minority- and women-owned businesses in all business activities of the agency, including procurement.
The FDIC's commitment to diversity and inclusion extends to the contractors' workforces. It is important that contractors providing goods and services to FDIC divisions and major offices engage in employment policies and practices that promote diversity and inclusion in their workforce. Therefore as a condition of doing business with the FDIC, contractors must commit to equal opportunity in employment and contracting. The fair inclusion standard is incorporated into the FDIC procurement policy from solicitation through contract execution.
Since September 1, 2011, the Fair Inclusion of Minorities and Women Standard is required in all FDIC solicitations and any contract for goods and services over $100,000. This mirrors the threshold at which OMWI review is required to identify competitive MWOBs to include in contract solicitations. Under FDIC procurement policy, pursuant to Section 342 of the DFA, contractors doing business with the FDIC must certify their commitment to the inclusion of minorities and women in their workforce to the maximum extent possible. The standard advises contractors, currently engaged or seeking to do business with the FDIC, of their responsibility as a federal contractor to ensure equal employment opportunity.
Contractors seeking to do business with the FDIC must provide a written statement, known as the Fair Inclusion Certification, stating commitment to good faith efforts to include minorities and women in the workforce. Also, contractors are encouraged to promote workforce diversity with suppliers with whom they do business in relation to FDIC work. In addition, upon request, contractors must provide evidence of their efforts to include minorities and women in their workforce. The FDIC developed review procedures, Contractors' Workforces Review Process (CWRP) to verify contractors' commitment to diversity and inclusion. The CWRP established internal procedures to carry out the annual assessment of contractors' good faith efforts. The CWRP monitors compliance with the Fair Inclusion requirements; and methods to enhance and improve contractor performance in the achievement of the workforce objectives and to amicably resolve outstanding issues. In 2018 OMWI further refined and updated the CWRP based on lessons learned to increase program efficiency and effectiveness.
Since 2016, the FDIC has completed 160 reviews assessing the good faith efforts of contractors to promote diversity in employment. This represents 36 percent of the average total number of active FDIC contractors (448) with awards valued over $100,000 between 2016 and 2018. The number of active contractors does not remain static from year-to-year due to the expiration and award of new contracts. In 2018, the FDIC continued implementing the CWRP, selecting 75 contractors for review.
Good Faith Effort
Good faith efforts are defined as actions contractors undertake to identify, and, if present, remove barriers to employment or expansion of employment opportunities for minorities and women. These actions may include but are not limited to the contractor's plan to ensure that minorities and women have appropriate opportunities to enter and advance within its workforce, including outreach efforts. FDIC contractors, in many cases, are subject to the recordkeeping and reporting requirements of the Office of Federal Contract Compliance Programs (OFCCP); specifically, they are required to maintain a written affirmative action plan under regulations implementing Executive Order 11246. The plan details actions to promote diversity in employment and overcome identified barriers to minority and gender equitable employment.
The FDIC requests support documentation from contractors that demonstrates good faith efforts to include minorities and women in the workforce. Contractors may provide a copy of their plan that outlines good faith efforts; demographic data; and other documentation that highlights their outreach, recruitment and or retention efforts to promote workforce diversity and inclusion. As background, FDIC reviews OFCCP compliance investigation results and other available online information on the contractors' diversity and inclusion practices.
2018 Contractors' Workforces Review
For 2018, 75 contractors currently doing business with the FDIC were selected to provide information on their good faith efforts to ensure the fair inclusion of minorities and women in their workforce. The contractors represented approximately 18 percent of active contractors for the year. For five contractors, compliance data was found in the OFCCP database. However, the information did not generally correspond to the contractors' locations that support the FDIC contract. The selected contractors covered a wide range of sectors as defined by the NAICS Codes. The size of the contractors ranged from small companies that employed less than 50 people up to large corporations that employed thousands.
Selected contractors were asked to provide a copy of their plan that outlines their good faith efforts to include minorities and women in the workforce; demographic data; and other documentation that demonstrated their commitment. Eighty-four (84) percent of contractors responding to the good faith effort request leveraged information already prepared to comply with Federal EEO and Affirmative Action (AA) requirements. For those contractors not subject to mandatory EEO or AA recordkeeping and reporting requirements, the FDIC met with them to discuss other readily available information such as, outreach activities, diversity training, partnerships with minority professional organizations, etc. All information submitted was reviewed to determine whether the contractor efforts demonstrated: leadership commitment to diversity and inclusion; availability of a plan to ensure minorities and women appropriate opportunities to enter and advance in the workforce; workforce demographics aligns with the labor market; outreach to broadly communicate opportunities; and or efforts to create an inclusive workforce. The FDIC followed up as needed to obtain clarification on good faith effort activities.
At the conclusion of the review, it was determined that the contractors reviewed had made, were making, or had a plan in place to make good faith efforts to include minorities and women in their workforce.
Community and Small Business Development
In 2018, the FDIC provided technical assistance to banks and community organizations through more than 254 outreach events designed to increase shared knowledge and support collaboration between financial institutions and other community, housing, and small business development resources and to improve knowledge about the Community Reinvestment Act (CRA).
The FDIC's work emphasized sharing information to support bank efforts to prudently provide affordable mortgage, small business credit and complementing access to safe accounts and financial education. As part of this effort, the FDIC also maintained the Affordable Mortgage Lending Center, a website that houses the Affordable Mortgage Lending Guide, a three-part resource to help community banks identify affordable mortgage products. The Guide's three parts are: Part 1: Federal Agencies and Government Sponsored Enterprises (updated in October 2018); Part II: State Housing Finance Agencies; and Part III: Federal Home Loan Banks.
Together these resources provide a comprehensive overview of the programs and products available to community banks to support affordable mortgage lending, particularly for borrowers with low or moderate incomes.
By year-end 2018, the Affordable Mortgage Lending Center had:
Added more than 7,000 subscribers from year-end 2017 to over 15,000;
Experienced more than 12,000 downloads since inception; and
Received more than 68,000 page views since inception.
In addition, the FDIC sponsored sessions with interagency partners covering basic and advanced CRA training for banks. The agencies also offered CRA basics for community-based organizations, as well as seminars on establishing effective bank-community collaborations for community development in more than 27 communities. The FDIC focused on encouraging community development initiatives in rural communities. This work included workshops that highlighted housing needs and programs, economic development programs, and community development financial institution collaborations, including those serving Native American communities.
Promoting Financial Access and Financial Literacy
Financial education helps consumers understand and use bank products effectively and sustain a banking relationship over time. The FDIC continued to be a leader in developing high-quality, free financial educational resources and pursuing collaborations to use those tools to educate the public. Money Smart products are available to teach consumers of all ages, as well as for people to learn on their own online. In particular, the newly updated Money Smart for Adults can help adults build the fundamental financial knowledge, skills, and confidence they need to use banking services effectively.
Money Smart for Adults
Building on insights gained from more than 17 years of experience with the Money Smart program, the FDIC announced the release of the updated instructor-led curriculum for adults in October. The revised curriculum, field-tested twice with community organizations and banks, features 14 modules that cover basic financial topics for use during a group training or in one-on-one work with clients. A self-paced online learning tool based on the updated curriculum is expected to be released in 2020.
The updated curriculum features:
An updated supplement featuring scenarios featuring individuals with disabilities thinking about a financial decision, which trainers can use to promote workshop discussions,
Expanded content on topics such as mobile banking, reading a pay statement, renting an apartment, and creative ways to save money, and updated information on standard topics such as credit reports and scores,
Vibrant graphics and discrete sections so instructors can create effective training sessions by choosing topics of interest to training participants,
“Try It” activities that provide engaging opportunities for participants to practice what they're learning during training in many contexts, including realistic scenarios,
“Apply It” activities to help participants apply what they have learned to their own lives, either during or after training,
“Key Takeaways” that briefly summarize the main message of each section,
A “Take Action” section in every module that encourages participants to identify at least one thing they plan to do because of what they learned during the training,
-
A new Guide to Presenting Money Smart for Adults that includes tools to help instructors present interactive, non-biased training using the updated curriculum, such as “roadmaps” to create customized training across modules, fun and engaging introductory activities to energize participants to learn, and detailed checklists to prepare for training.
More than 1,500 organizations were trained on the updated materials before year-end, including through two national webinars. In addition, and plans are underway to provide training to many more organizations.
The maximum potential of the curriculum is reached when banks collaborate with non-profits or other community-based organizations to bring Money Smart training to local communities, and, when appropriate, connect the training to banking products and services that respond to the needs of participants. Through the Money Smart Alliance, the FDIC recognizes organizations that commit to using Money Smart and that want to receive regular updates and training tips to enhance their use of the curriculum.
More than 450 organizations joined the Alliance during 2018, bringing the total members to 1,062. The Alliance experienced a 34 percent growth during 2018 compared to year-end 2017. This growth is largely attributable to the Money Smart Advance Team effort that built engagement with organizations that have or will deliver Money Smart to adults.
The FDIC engaged Alliance members through quarterly webinars that share helpful information to assist them with offering Money Smart training. Staff also conducted one-on-one calls with Alliance members to help increase communication between the FDIC and Alliance members. The calls were well received and appreciated by the Alliance members who shared how they use and plan to use Money Smart and shared input on the curriculum products. Alliance members also learned about the updated Money Smart for Adults curriculum (and had opportunity for early review of the modules) starting in September, several weeks before the broader public release.
Youth Financial Education
Recognizing the promise of hands-on learning approaches, the FDIC's youth work centered on helping banks understand strategies to connect financial education to savings accounts. The FDIC's Youth Banking Network provides opportunities for 66 banks to learn from one another and FDIC staff on promising strategies to connect financial education to savings accounts for school-aged children. Membership in the Network is open to banks interested in community collaborations to help school children receive financial education and have the opportunity to open a savings account.
Youth Banking Network members participated in periodic learning calls to discuss helpful strategies and resources. For example, the April call highlighted practical approaches conducting reality fairs, a strategy to help young people understand the tradeoffs of money choices that they can expect to experience as they enter adulthood.
The FDIC also engaged Network participants to develop an operational toolkit of resources that can support the development of new youth savings collaborations, and drafted new resources for the Network based on consultations with members that included:
Frequently asked questions pertaining to operating youth banking programs,
A tip sheet to help banks communicate with parents and caregivers about the financial education provided through schools,
A tip sheet to help banks communicate with teachers and administrators to help secure an agreement to educate students,
Strategies bankers can use to make financial education relevant when visiting classrooms to talk about money,
A guide to reality fairs, and
A guide to measuring outcomes of youth savings programs.
These and other resources are provided to participants in the Youth Banking Network to strengthen efforts to build and expand collaborations with schools and non-profit organizations.
Many youth banking programs provide financial education training based on FDIC's Money Smart for Young People curriculum. To help inform future curriculum improvements, the FDIC obtained feedback from 26 educators who taught 83 Money Smart for Young People sessions as part of a special project. The participating educators overwhelmingly reported that the materials were structured well, were easy to use, and initiated critical thinking among students. Still, teachers provided valuable suggestions for improvement. These suggestions generally involved including more activities, updating the content, and reorganization to facilitate practical usefulness. In 2018, the FDIC began to revise Money Smart for Young People based on this teacher feedback and an assessment using curriculum review tools.
Financial Education Outreach
Highlights of outreach include FDIC collaboration with other members of the federal Financial Literacy and Education Commission (FLEC) to share financial education resources during Financial Capability Month (April) using the #FinancialFuture2018 hashtag on social media. FDIC also developed resources on the Be Ready Financially: Resources to Help Individuals and Families with Financial Preparedness webinar hosted by FLEC with about 200 organizational participants.
The FDIC also collaborated with the U.S. Department of Education and other FLEC agencies on the “Financial Education in America's Schools” program convening on April 27, 2018. This event promoted the exchange of ideas among state and local leaders and highlighted federal resources that support promising ideas.
In addition, youth employment programs were engaged to encourage Money Smart financial education for young workers. For example, FDIC staff met with a Job Corps site in Washington, DC to provide technical assistance and later conducted a Money Smart train-the-trainer session for 10 staff members, as well as a banker roundtable. A brochure was also developed for workforce providers with tips on how to more effectively engage financial institutions to provide financial education or deposit account opportunities for young people participating in workforce programs. The FDIC also partnered with the National Credit Union Administration to engage more than 15 cities participating in the America Saves for Young Workers initiative to learn challenges and opportunities in connecting young workers to basic deposit accounts at insured financial institutions.
Finally, the FDIC released an updated version of Money Smart for Older Adults in Spanish (the original curriculum was released in English in 2017) in collaboration with the Consumer Financial Protection Bureau. This resource offers information and resources to help older adults and their caregivers avoid financial exploitation through fraud and scams.
Money Smart for Small Business
The FDIC convened forums and roundtables featuring safe small business products and services and provided information and technical assistance to support initiatives geared to increase access to capital for small businesses. In 2018, the FDIC completed 74 events and activities primarily focused on small business.
The Small Business Administration, its partner network – including the Small Business Development Centers, Women's Business Centers and SCORE Chapters, the Federal Trade Commission and the CFPB were among other stakeholders the FDIC collaborated with to produce the revised version of the Money Smart for Small Business Credit and Banking Modules. This revision helps entrepreneurs make more informed financing decisions.
Partnerships for Access to Mainstream Banking
The FDIC supported community development and economic inclusion partnerships at the local level by providing technical assistance and information resources throughout the country, with a focus on unbanked and underbanked households and low- and moderate-income communities. Community Affairs staff support economic inclusion through work with the Alliances for Economic Inclusion (AEI), Bank On initiatives, and other coalitions originated by local and state governments, and in collaboration with federal partners and many local and national non-profit organizations. The FDIC also partnered with other financial regulatory agencies to provide information and technical assistance on community development to banks and community leaders across the country.
In the 12 AEI communities and in other areas, the FDIC helped working groups of bankers and community leaders develop responses to the financial capability and services needs in their communities. For example, the FDIC promoted savings opportunities for low- and moderate-income people and communities, conducted outreach to bring larger numbers of people to free tax preparation assistance sites, and coordinated education to help small business owners develop stronger banking relationships.
The FDIC worked across the nation including 16 targeted communities to convene 12 forums and 19 roundtables that helped advance strategies to expand access to safe and affordable deposit accounts and engage unbanked and underbanked consumers. The FDIC provided technical assistance to bankers, coalition leaders, and others interested in understanding opportunities for banking services designed to meet the needs of the unbanked and underbanked.
The FDIC sponsored more than 55 events, 80 outreach activities, and 13 speaking engagements and exhibitions during 2018. These events provided collaborative opportunities to increase access to bank accounts and credit services for people who are unbanked and underbanked, as well as small businesses.
Minority Depository Institution Activities
The preservation of minority depository institutions (MDI) remains a high priority for the FDIC. In 2018, the FDIC continued to promote and support MDI and Community Development Financial Institution (CDFI) industry-led strategies for success. These strategies include increasing collaboration between MDI and CDFI bankers and other financial institutions; partnering to share costs, raise capital, or pool loans; and making innovative use of available federal programs. The FDIC supports this effort by providing outreach, education and training, and technical assistance to MDI and CDFI banks.
During 2018, the FDIC led discussions with MDI bankers and the MDI Advisory Committee on Community Banking (CBAC) about the FDIC's Resource Guide for Collaboration with Minority Depository Institutions. This guide, published in December 2017, encourages collaboration among MDIs and between MDIs and other institutions. The publication describes some of the ways that financial institutions, including community banks, can partner with MDIs to the benefit of all institutions involved, as well as the communities they serve. Both community banks and larger insured financial institutions have valuable incentives under the CRA to undertake ventures with MDIs, including capital investment and loan participations. In 2018, the FDIC began preparations to host roundtables or other opportunities for MDIs to engage with potential collaboration partners in 2019.
The FDIC added additional minority bankers to its CBAC to bring more diverse perspectives and input to these discussions. The FDIC began updating its 2014 study, “Minority Depository Institutions: Structure, Performance, and Social Impact,” for publication in 2019. In support of its statutory goal to preserve the minority character in mergers and acquisitions, the agency hosted outreach sessions with MDI bankers to provide an overview of the process for bidding on failed minority banks, and to offer technical assistance to banks desiring to place a bid on a failed MDI franchise. The FDIC also began planning for the 2019 Interagency Minority Depository Institution and CDFI Bank Conference, which the FDIC will host in collaboration with the OCC and the FRB.
The FDIC continuously pursued efforts to improve communication and interaction with MDIs and to respond to the concerns of minority bankers in 2018. The agency maintains active outreach with MDI trade groups and offers to arrange annual meetings between FDIC regional management and each MDI's board of directors to discuss issues of interest. The FDIC routinely contacts MDIs to offer return visits and technical assistance following the conclusion of FDIC safety and soundness, compliance, CRA, and specialty examinations to help bank management understand and implement examination recommendations. These return visits, normally conducted within 90 to 120 days after the examination, are intended to provide useful recommendations or feedback for improving operations, not to identify new issues.
The FDIC's website invites inquiries and provides contact information for any MDI to request technical assistance at any time.
In 2018, the FDIC provided 149 individual technical assistance sessions on nearly 50 risk management and compliance topics, including:
Accounting;
Bank Secrecy Act and Anti-Money Laundering;
Community Reinvestment Act;
Funding and liquidity;
Information technology risk management and cybersecurity;
Third-party oversight; and
Troubled debt restructuring.
The FDIC also held outreach, training, and educational programs for MDIs through conference calls and regional banker roundtables. In 2018, topics of discussion for these sessions included many of those listed above, as well as collaboration and partnerships, capital markets, cybersecurity, liquidity risk, and Ombudsman services. In addition, the FDIC assisted four MDIs in the early termination of Shared Loss Agreements related to the purchase of failed bank franchises during the crisis.
In 2018, the FDIC's National Director for Minority and Community Development met with the OMWI Director to discuss appropriate collaborative efforts going forward.
CONCLUSION
During 2018, OMWI continued to make progress in enhancing the diversity of the FDIC's workforce and its business practices.
The racial, ethnic, and gender diversity of the workforce continues a steady increase since the passage of Section 342 of the DFA. Both the percentages for minorities (30 percent) and women (44.7 percent) in the FDIC's permanent workforce have increased since the passage of Section 342 of the DFA. The FDIC continues to face challenges in attracting and retaining minorities and women in its bank examiner workforce, which is principal major feeder group for a significant percentage of executive and managerial leadership positions at the agency. While there has been gradual progress, the FDIC will continue to implement strategies to garner greater improvements in this area.
With regard to increasing MWOB participation, the FDIC focused on opportunities for MWOBs in its non-financial recurring services and continued to implement new procurement strategies that restructured large contracts into smaller contracts to increase MWOB participation and contract awards. The FDIC maintained an aggressive vendor outreach and education program participating in business expos and technical assistance events which resulted in 220 new MWOBs being added to the Contractor Resource List, the internal FDIC database for vendors interested in doing business with the FDIC. Despite the decrease in bank resolution activities, which has been the major source for contracting opportunities, the FDIC has been successful at identifying new opportunities for MWOBs.
The FDIC remained fully engaged and continued to implement the Financial Institution Diversity program to meet the requirements of Section 342 of the DFA by encouraging its regulated financial institutions to assess their diversity policies and practices. Further, the FDIC's OMWI continued its implementation of the Contractors' Workforces Review Process to assess whether its contractors have made good faith efforts to include minorities and women in their workforce.
In every respect, the FDIC's accomplishments during 2018 are in concert with the requirements of Section 342 of the DFA. The FDIC will continue to develop strategies and to capitalize on opportunities to further meet DFA requirements. Specifically, the FDIC will continue to examine requirements for goods and services in the procurement and contracting arena to optimize opportunities to increase MWOB participation, as annual contract awards continue to decline significantly due to the reduction in the number of financial institution failures; and will continue to recruit, hire, and retain the most talented and diverse workforce to sustain its mission.
APPENDICES
Appendix A
| FDIC Contracting Awards to MWOBs, Five–Year Trend (in millions) | |||||
|---|---|---|---|---|---|
| 2014 | 2015 | 2016 | 2017 | 2018 | |
| Total Awards | $686.8 | $858.4 | $508.8 | $523.7 | $499.5 |
| 100.0% | 100.0% | 100.0% | 100.0% | 100.0% | |
| Minority- Owned or Women- Owned Business Totals |
$239.9 | $211.6 | $93.9 | $96.7 | $122.5 |
| 34.9% | 24.7% | 18.5% | 18.5% | 24.5% | |
| Minority- Owned | $143.7 | $145.2 | $56.6 | $66.7 | $45.8 |
| 20.9% | 16.9% | 11.0% | 12.7% | 9.2% | |
| Women- Owned | $132.6 | $104.2 | $47.4 | $46.2 | $83.0 |
| 19.3% | 12.1% | 9.3% | 8.8% | 16.6% | |
| Both Minority- Owned and Women- Owned |
$36.4 | $37.8 | $10.0 | $16.2 | $6.3 |
| 5.3% | 4.3% | 1.9% | 3.0% | 1.3% | |
| Asian American | $27.1 | $51.8 | $25.0 | $31.2 | $33.9 |
| 4.0% | 6.0% | 4.9% | 6.0% | 6.8% | |
| Black American | $21.3 | $30.7 | $9.4 | $32.7 | $1.9 |
| 3.1% | 3.6% | 1.9% | 6.2% | 0.4% | |
| Hispanic American | $66.1 | $43.2 | $20.6 | $1.6 | $7.0 |
| 9.6% | 5.0% | 4.0% | 0.3% | 1.4% | |
| Native American | $0.8 | $0.0 | $0.1 | $0.9 | $2.9 |
| 0.1% | 0.0% | 0.0% | 0.2% | 0.6% | |
| Other Minority | $28.4 | $19.5 | $1.4 | $0.3 | $0.1 |
| 4.1% | 2.3% | 0.3% | 0.0% | 0.0% | |
| FDIC Payments to MWOBs, Five–Year Trend (in millions) | |||||
|---|---|---|---|---|---|
| 2014 | 2015 | 2016 | 2017 | 2018 | |
| Total Contract Payment | $491.6 | $507.2 | $415.2 | $414.0 | $429.6 |
| 100.0% | 100.0% | 100.0% | 100.0% | 100.0% | |
| Minority- Owned | $89.3 | $89.3 | $56.0 | $54.6 | $49.5 |
| 18.2% | 17.6% | 13.5% | 13.2% | 11.5% | |
| Women- Owned | $63.6 | $83.2 | $66.8 | $66.9 | $59.5 |
| 12.9% | 16.4% | 16.1% | 16.2% | 13.9% | |
| Both Minority- Owned and Women- Owned |
$24.7 | $30.0 | $11.3 | $11.9 | $11.1 |
| 5.0% | 5.9% | 2.8% | 2.9% | 2.6% | |
Appendix B
| FDIC 2016 Contract Awards by Top Ten NAICS Codes | ||||
|---|---|---|---|---|
| NAICS | NAICS Description | Dollar Amount of All Awards |
Dollar Amount of MWOB Awards |
% of Dollars to MWOBs |
| 541519 | Other Computer Related Services | $139,770,593.30 | $16,412,115.38 | 4.3% |
| 541512 | Computer Systems Design Services | $50,815,491.65 | $23,674,716.26 | 6.2% |
| 511210 | Software Publishers | $41,876,889.19 | $14,435,080.35 | 3.8% |
| 518210 | Data Processing, Hosting, and Related Services |
$41,537,351.68 | $452,640.92 | 0.1% |
| 541611 | Administrative Management and General Management Consulting Services | $23,340,246.80 | $200,000.00 | 0.1% |
| 334111 | Electronic Computer Manufacturing | $20,380,173.19 | $3,523,500.11 | 0.9% |
| 561720 | Janitorial Services | $17,661,424.00 | $17,661,424.00 | 4.6% |
| 519130 | Internet Publishing and Broadcasting and Web Search Portals | $17,011,298.51 | $ | 0.0% |
| 541511 | Custom Computer Programming Services | $16,539,815.67 | $12,077,240.74 | 3.2% |
| 541612 | Human Resources Consulting Services | $14,301,968.40 | $14,301,968.40 | 3.7% |
| Total | $383,235,252.39 | $102,738,686.16 | 26.8% | |
Appendix C
FDIC Total, Permanent, and Executive Manager Workforce, Five-Year Trend
| Total Workforce (Permanent and Non-Permanent) | ||||||
|---|---|---|---|---|---|---|
| 2014 | 2015 | 2016 | 2017 | 2018 | Change | |
| Minority | 28.1% | 28.2% | 28.0% | 28.7% | 29.8% | +1.1% |
| Non-Minority | 71.9% | 71.8% | 72.0% | 71.3% | 70.2% | -1.1% |
| Men | 55.5% | 55.3% | 55.2% | 55.2% | 55.2% | 0% |
| Women | 44.5% | 44.7% | 44.8% | 44.8% | 44.8% | 0% |
| Permanent Workforce | ||||||
|---|---|---|---|---|---|---|
| 2014 | 2015 | 2016 | 2017 | 2018 | Change | |
| Minority | 27.6% | 28.0% | 28.2% | 29.0% | 29.9% | +0.9% |
| Non-Minority | 72.4% | 72.0% | 71.8% | 71.0% | 70.1% | -0.9% |
| Men | 55.0% | 54.8% | 54.9% | 55.1% | 55.3% | +0.2% |
| Women | 45.0% | 45.2% | 45.1% | 44.9% | 44.7% | -0.2% |
| Total Workforce - Executive Manager (Permanent and Non-Permanent) | ||||||
|---|---|---|---|---|---|---|
| 2014 | 2015 | 2016 | 2017 | 2018 | Change | |
| Minority | 14.1% | 18.0% | 18.8% | 18.3% | 17.6% | -0.7% |
| Non-Minority | 85.9% | 82.0% | 81.2% | 81.7% | 82.4% | +0.7% |
| Men | 64.1% | 66.9% | 63.2% | 61.1% | 64.0% | +2.9% |
| Women | 35.9% | 33.1% | 36.8% | 38.9% | 36.0% | -2.9% |
Appendix D
2018 FDIC Major Occupations, Total Workforce
| Job Title/Series Occupational CLF |
Race/Ethnicity | ||||||||||||||||
|---|---|---|---|---|---|---|---|---|---|---|---|---|---|---|---|---|---|
| Total Employees |
Hispanic American | Non–Hispanic or Latino | |||||||||||||||
| White | Black American | Asian American | American Indian or Alaska Native |
Two or more races |
|||||||||||||
| All | Women | Men | Women | Men | Women | Men | Women | Men | Women | Men | Women | Men | Women | Men | |||
| Economist (0110) | # | 81 | 25 | 56 | 0 | 3 | 15 | 46 | 3 | 2 | 7 | 5 | 0 | 0 | 0 | 0 | |
| 100.0% | 30.9% | 69.1% | 0.0% | 3.7% | 18.5% | 56.8% | 3.7% | 2.5% | 8.6% | 6.2% | 0.0% | 0.0% | 0.0% | 0.0% | |||
| CLF | 100.0% | 32.9% | 67.1% | 1.9% | 3.3% | 25.2% | 55.8% | 2.7% | 2.8% | 2.7% | 4.4% | 0.1% | 0.2% | 0.4% | 0.6% | ||
| Financial Administration and Program (0501) | # | 166 | 76 | 90 | 2 | 3 | 30 | 67 | 36 | 13 | 7 | 6 | 1 | 0 | 0 | 1 | |
| 100.0% | 45.8% | 54.2% | 1.2% | 1.8% | 18.1% | 40.4% | 21.7% | 7.8% | 4.2% | 3.6% | 0.6% | 0.0% | 0.0% | 0.6% | |||
| CLF | 100.0% | 56.3% | 43.8% | 5.8% | 4.0% | 38.6% | 32.5% | 7.5% | 4.7% | 3.1% | 1.7% | 0.4% | 0.3% | 1.0% | 0.6% | ||
| Accountants and Auditors (0510/0511) |
# | 89 | 48 | 41 | 0 | 0 | 22 | 31 | 18 | 6 | 8 | 2 | 0 | 0 | 0 | 2 | |
| 100.0% | 53.9% | 46.1% | 0.0% | 0.0% | 24.7% | 34.8% | 20.2% | 6.7% | 9.0% | 2.2% | 0.0% | 0.0% | 0.0% | 2.2% | |||
| CLF | 100.0% | 60.1% | 39.9% | 3.9% | 2.2% | 44.2% | 31.8% | 5.6% | 2.4% | 5.4% | 3.0% | 0.3% | 0.1% | 0.7% | 0.4% | ||
| Financial Institution Examining (0570) |
# | 2743 | 1064 | 1679 | 40 | 69 | 778 | 1424 | 170 | 103 | 53 | 52 | 6 | 11 | 17 | 20 | |
| 100.0% | 38.8% | 61.2% | 1.5% | 2.5% | 28.4% | 51.9% | 6.2% | 3.8% | 1.9% | 1.9% | 0.2% | 0.4% | 0.6% | 0.7% | |||
| CLF | 100.0% | 45.2% | 54.8% | 3.7% | 3.1% | 28.3% | 44.1% | 8.4% | 3.4% | 3.7% | 3.5% | 0.2% | 0.1% | 1.0% | 0.6% | ||
| Attorney (0905) | # | 328 | 139 | 189 | 2 | 7 | 110 | 164 | 16 | 10 | 10 | 4 | 1 | 1 | 0 | 3 | |
| 100.0% | 42.4% | 57.6% | 0.6% | 2.1% | 33.5% | 50.0% | 4.9% | 3.0% | 3.0% | 1.2% | 0.3% | 0.3% | 0.0% | 0.9% | |||
| CLF | 100.0% | 33.3% | 66.7% | 1.9% | 2.5% | 26.7% | 59.7% | 2.5% | 2.1 | 1.6% | 1.7% | 0.1% | 0.1% | 0.6% | 0.6% | ||
| General Business and Industry (1101) |
# | 279 | 93 | 186 | 2 | 9 | 64 | 143 | 19 | 15 | 7 | 14 | 0 | 1 | 1 | 4 | |
| 100.0% | 33.3% | 66.7% | 0.7% | 3.2% | 22.9% | 51.3% | 6.8% | 5.4% | 2.5% | 5.0% | 0.0% | 0.4% | 0.4% | 1.4% | |||
| CLF | 100.0% | 63.3% | 36.7% | 5.9% | 2.9% | 43.8% | 27.1% | 8.8% | 3.6% | 3.3% | 2.4% | 0.4% | 0.2% | 1.1% | 0.6% | ||