
Interest rate risk is fundamental to the business of banking. Changes in interest rates can expose an institution to adverse shifts in the level of net interest income or other rate-sensitive income sources and impair the underlying value of its assets and liabilities. Examiners review an insured institution's interest rate risk exposure and the adequacy and effectiveness of its interest rate risk management as a component of the supervisory process. Examiners consider the strength of the institution's interest rate risk measurement and management program and conduct a review in light of that institution's risk profile, earnings, and capital levels. When a review reveals material weaknesses in risk management processes or a level of exposure to interest rate risk that is high relative to capital or earnings, a remedial response can be required.
In today's changing rate environment, bank supervisors are monitoring industry balance sheet and income statement trends to assess the industry's overall exposure to and management of interest rate risk. This article reviews the current interest rate environment, discusses potential risks associated with a rising rate environment and a continued flattening of the yield curve, and analyzes banking industry aggregate balance sheet information and trends. It also reviews findings from recent bank examination reports in which interest rate risk or related management practices raised concern and highlights common weaknesses in risk management, measurement, and modeling practices.
The Current Rate Environment
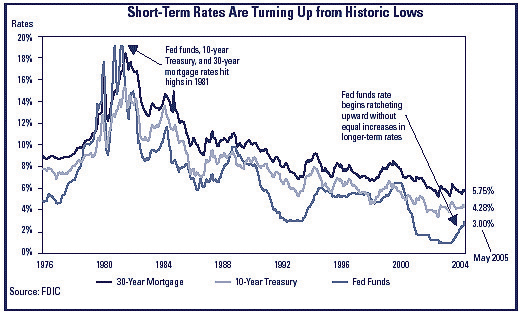
Since the 1980s, and despite upward rate spikes in 1994 and 2000, the level of interest rates has generally been declining (see Chart 1). In September 1981, the rate on the 10-year Treasury bond reached a high of over 15 percent; it has since declined to a low of just over 3 percent in June 2003. During roughly the same period, other rate indices also fell in generally the same manner, though not always in tandem. For example, the Federal funds rate fell from over 19 percent to 1 percent, and the 30-year mortgage rate average peaked at over 18 percent and dropped to under 6 percent.
Chart 1
During the past 12 months, however, the banking industry has sustained a well-forecasted series of "measured" increases to the target Federal funds rate. Since June 2004, the Federal Open Market Committee (FOMC) has steadily increased the intended Federal funds rate in moderate 25 basis point increments to its current level of 3 percent. Generally, changes in the Federal funds rate will affect other short-term interest rates (e.g., bank prime rates), foreign exchange rates, and less directly, long-term interest rates. However, increases to the Federal funds rate have yet to drive similar increases in longer-term yields. In fact, over the 12 months that the FOMC has moved the target Federal funds rate steadily upward, the nominal yield on the 10-year treasury has rarely crested above 4.5 percent and actually has declined from its July 2, 2004, level. This "conundrum," evidenced by nonparallel movement in short- and long-term rates, has resulted in a flattening of the yield curve.1
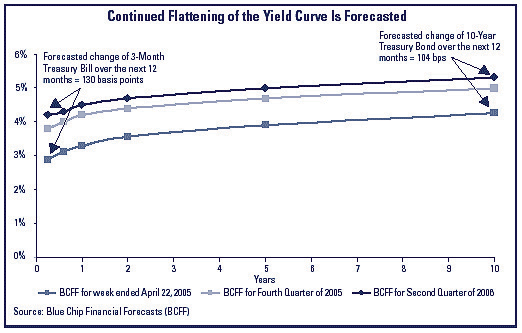
Looking forward, many market participants anticipate further measured increases in the Federal funds rate and similar, although not equal, increases in longer-term rates. Over the next year, Blue Chip Financial Forecasts2 is predicting an additional 130 basis point increase in short-term rates and a 104 basis point increase in longer-term rates-a forecast that portends continued flattening of the yield curve (see Chart 2).
Chart 2
Assessing Banks' Interest Rate Risk Exposure
A rising rate environment in conjunction with a continued flattening of the yield curve presents the potential for heightened interest rate risk. A flattening yield curve can pressure banks' margins generally, and rising rates can be particularly challenging to institutions with a "liability-sensitive" balance sheet-an asset/liability profile characterized by liabilities that reprice faster than assets. The extent of this mismatch between the maturity or repricing of assets and liabilities is a key element in assessing an institution's exposure to interest rate risk.
The shape of the yield curve is an important factor in assessing the overall rate environment. A steep yield curve provides the greatest spread between short- and long-term rates and is generally associated with favorable economic conditions. Long-term investors, anticipating an improving economy and higher rates, will demand greater yields to compensate for the risk of being locked into longer-term assets. In such a favorable environment, opportunities exist to generate spread-related earnings driven by asset and liability term structures. A flattening yield curve can deprive banks of these opportunities and raises concern about a possible inversion in the yield curve. An inverted yield curve, where long-term rates are lower than short-term rates, can present a most challenging environment for financial institutions. Also, an inverted yield curve is associated with the potential for economic recession and declining rates. Given recent rising rates and flattening of the yield curve, bank supervisors have been monitoring trends in bank net interest margins (NIMs) and balance sheet composition.
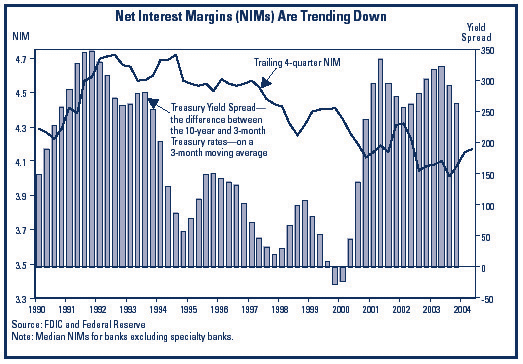
While various factors (competition, earning asset levels, etc.) affect NIMs, a flattening yield curve is associated with declining NIMs. Chart 3 shows that during the 1990s, generally declining industry NIMs followed the overall flattening of the yield curve. As the spread between long- and short-term rates (the bars) generally decreased from 1991 to 1999—resulting in a flattening of the Treasury yield curve—bank NIMs also declined (the line on Chart 3 plots trailing four-quarter NIM). Beginning in 2000, after a brief period of inversion, the yield curve steepened dramatically, and over the next five quarters, bank NIMs increased. NIMs have since continued their general decline, and recent quarters have seen the yield curve continue to flatten, raising the potential for continued pressure on bank NIMs.
Chart 3
Even though median bank NIMs have been declining since 1994, this trend has been accompanied by strong and, in recent years, record levels of profitability. Noninterest income sources (combined with overall strong industry performance) have helped mitigate the effects of declining NIMs. Institutions with over $1 billion in assets report significant reliance on noninterest income; it accounts for more than 43 percent of their net operating revenue. While this diversification of income sources is less prevalent in smaller community banks (institutions that hold less than $1 billion in assets derive only 25 percent of net operating revenue from noninterest income sources), NIMs reported by these smaller institutions generally are higher and recently have improved compared to those of the larger institutions.
In short, while individual banks may be experiencing margin pressures, the downward trend in bank NIMs has yet to result in an industry-wide decline in levels of net income. It is too early to gauge the effects of a continuing or prolonged period of flattening in the shape of the yield curve.3
Bank Balance Sheet Composition—The Asset Side
Despite strong industry profitability, bank supervisors are monitoring changes in the nature, trend, and type of exposures on bank balance sheets. Recent aggregate balance sheet information shows the industry increasing its exposure to longer-term assets, holding greater proportions of mortgage-related assets, and relying more on rate-sensitive, noncore funding sources-all factors that can contribute to higher levels of interest rate risk.4
In general, the earnings and capital of a liability-sensitive institution will be affected adversely by a rising rate environment. A liability-sensitive bank has a long-term asset maturity and repricing structure relative to a shorter-term liability structure. In an increasing interest rate environment, the NIM of a liability-sensitive institution will worsen (other factors being equal) as the cost of the bank's funds increases more rapidly than the yield on its assets. The higher its proportion of long-term assets, the more liability-sensitive a bank may be.
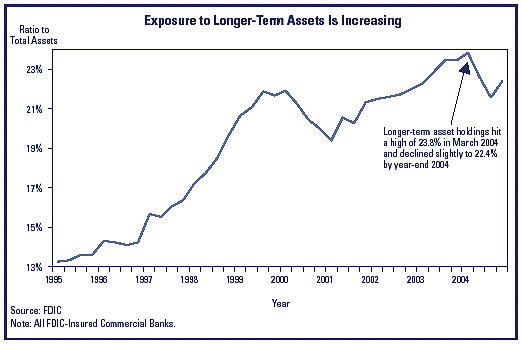
The industry's exposure to long-term assets increased during the 1990s (see Chart 4). Exposure to long-term assets in relation to total assets has risen steadily, from 13 percent in 1995 to nearly 24 percent in 2004, indicating the potential for heightened liability sensitivity.5 Significant exposure to longer-term assets could generate further inquiry from examiners about the precise cash flow characteristics of a particular bank's assets and a review of the bank's assessment of the nature and extent of its asset-liability mismatch and resulting rate sensitivity.
Chart 4
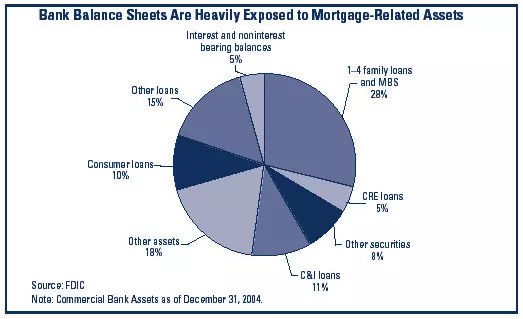
In addition to increasing its exposure to long-term assets, the industry has increased its exposure to mortgage-related assets. Current data show that bank holdings of mortgage loans and mortgage-backed securities comprise 28 percent of all bank assets (see Chart 5),6 compared to 18 percent in 1990.
Chart 5
Mortgage-related assets present unique risks because of the prepayment option that is granted the borrower and embedded within the mortgage loan. Due to lower prepayments in a rising rate environment, the duration of lower-coupon, fixed-rate mortgages will extend and banks will be locked into lower-yielding assets for longer periods. Like mortgage loans, longer-term, fixed-rate mortgage-backed securities are also exposed to extension risk.
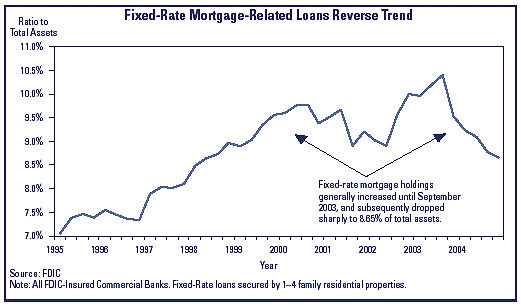
It is difficult to assess fully the current magnitude of liability sensitivity or extension risk confronting the banking industry. Even though exposure to long-term and mortgage-related assets has been moving steadily upward in recent years, there are signs that bank risk managers are responding to a changing rate environment and altering their asset mix. Since June 2003, banks have reduced their exposure to fixed-rate mortgage assets and are recently offering more adjustable-rate mortgage loan products (ARMs). As shown in Chart 6, industry exposure to fixed-rate mortgages, while generally increasing since 1995, began to turn sharply downward in the third quarter of 2003.
Chart 6
And, according to Federal Housing Finance Board data, the percentage of adjustable-rate, conventional single-family mortgages originated by major lenders increased from 15 percent in 2003 to a recent peak of 40 percent in June 2004. Lower levels of fixed-rate mortgages would reduce an institution's exposure to extension risk. In addition, higher levels of ARMs could increase an institution's asset sensitivity. Such changes in balance sheet structure could mitigate potential exposure to rising interest rates.7
Bank Balance Sheet Composition—The Liability Side
The potential for interest rate risk driven by maturity or repricing mismatch cannot be assessed by looking only at the asset side of the balance sheet. Information on the nature and duration of banks' liabilities is also needed. Banks that rely heavily on short-term and more rate-sensitive funding sources could experience a material increase in funding costs as interest rates rise. Some banks may not be able to offset such higher funding costs through increased asset yields. Increased exposure to short-term, rate-sensitive wholesale funding sources can render a bank more liability sensitive, increasing its exposure to rising rates.
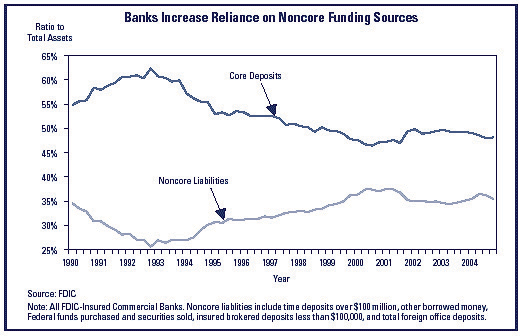
Over the past several years, banks have increased their reliance on wholesale, noncore funding sources such as overnight funds, certificates of deposit (greater than $100,000), brokered deposits, and Federal Home Loan Bank (FHLB) advances. Noncore funding sources have climbed steadily from about 25 percent of total assets in 1992 to over 35 percent today. This trend is mirrored by core deposits falling from 62 percent of total assets in 1992 to 48 percent in 2004 (see Chart 7). Combined with an increase in holdings of long-term assets, a shorter-term and more volatile liability structure could expose an institution to significant interest rate risk in a rising rate environment.
Chart 7
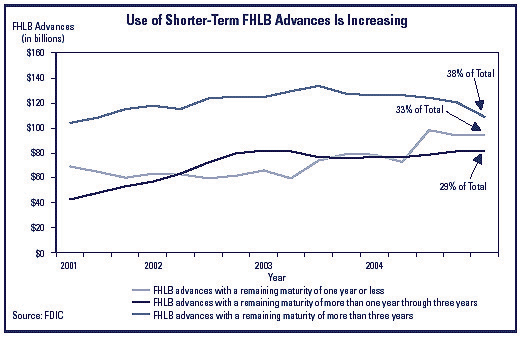
To assess fully the impact of the increase in noncore funding sources and the decrease in core deposits, more information about the tenor of noncore liabilities is needed. FHLB advances are a significant component of noncore funding for many institutions and illustrate the importance of looking deeper into the repricing structure of a bank's funding sources. Call Report data provide some information on the maturity structure of FHLB advances, but the picture is clouded. Recent reports show that while the use of shorter-term FHLB advances (under one year) has been on the rise, 67 percent of all FHLB advances have a maturity greater than one year (see Chart 8).
Chart 8
The Call Report, however, does not capture the nature and extent of options embedded within the FHLB advance structures. Call Report instructions provide that FHLB advances with a three-year (or longer) contractual maturity are to be recorded in the long-term bucket, even if the advance is callable or convertible by the FHLB at any time. A callable or convertible advance allows the FHLB to convert the advance from fixed- to floating-rate or terminate the advance and renew the extension at current market rates. Therefore, advances such as those reported as having a three-year maturity may actually reprice in the near term, depending on the rate environment.8
Many advances contain embedded options. The FHLB Combined Financial Report (as of June 30, 2004) reflects that of then-outstanding advances, approximately 55 percent were callable and 22 percent were convertible. Translated to bank balance sheets, these data indicate the presence of a greater level of option risk on banks' balance sheets than currently included in Call Report information. In a rising rate environment, the probability increases that the FHLB will exercise its option to call or convert lower-yielding advances, thereby exposing the borrowing institution to higher funding costs.
In conclusion, aggregate industry trends—specifically higher levels of exposure to long-term assets, mortgage-related assets, and noncore funding sources that exhibit optionality—raise concerns about the potential for heightened levels of interest rate risk in today's environment. These concerns must be tempered by awareness that off-site data provide only a rough, opaque, and end-of-period view of banks' balance sheet cash flow characteristics and composition. Each bank is unique in terms of asset and liability mix, risk appetite, hedging activities, and related risk profile. Moreover, bank risk exposures are not static. Interest rate risk management strategies can change an institution's risk profile quickly—even overnight—through the use of financial derivatives (e.g., interest rate swaps). Thus, it is difficult to draw conclusions about the level of interest rate risk strictly from off-site information. Off-site and industry-wide analyses must be joined with on-site examination results to derive a more comprehensive supervisory assessment of interest rate risk exposure, its measurement, and its management.
Supervisory Assessment of Interest Rate Risk
Bank examiners assess the level of interest rate risk exposure in light of a bank's asset size, complexity, levels of capital and earnings, and most important, the effectiveness of its risk management process. At the core of the interest rate risk examination process is a supervisory assessment of how well bank management identifies, monitors, manages, and controls interest rate risk.9 This assessment is summarized in an assigned risk rating for the component known as sensitivity to market risk, which is part of the CAMELS rating system.10
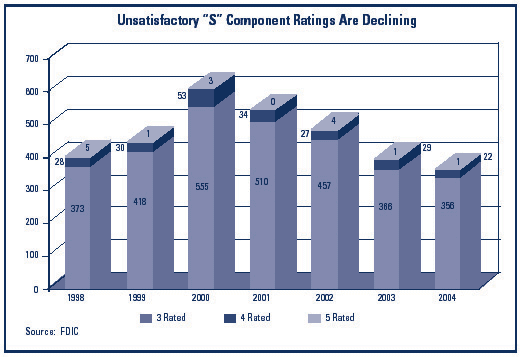
An unsatisfactory rating for sensitivity to market risk (the "S" component of CAMELS) represents a finding of material weaknesses in the bank's risk management process or high levels of exposure to interest rate risk relative to earnings and capital. Chart 9 indicates that the number of FDIC-insured institutions with an unsatisfactory "S" component rating is minimal out of the population of nearly 9,000 insured institutions. Fewer than 5 percent of insured institutions are rated 3 or worse for this component, and most of those are in the less severe 3 rating category. Moreover, since 2000, the number of institutions with an adverse "S" component rating has declined steadily.
Chart 9
To capture emerging trends, FDIC supervisors are conducting periodic reviews of bank examination reports in an effort to discern the nature and cause of adverse "S" component ratings. A review of recent examination reports that presented supervisory concerns about interest rate risk reveals several commonalities in the banks' operating activities:
- Concentrations in mortgage-related assets,
- Ineffective or improperly managed "leverage" programs,11 and
- Acquisition of complex securities without adequate prepurchase and ongoing risk analyses.
In addition, concerns have emerged about the adequacy and effectiveness of bank management's use of interest rate risk models. Weaknesses center on (1) the accuracy of model inputs as well as the accuracy and testing of assumptions, (2) whether the models are capturing the cash flow characteristics of complex instruments, specifically instruments with embedded options, and (3) whether management is using adequate stress tests to determine sensitivity to interest rate changes. Key supervisory concerns identified from a review of examination comments specific to interest rate risk models include:
- Data input should be accurate, complete, and relevant. Many loans, securities, or funding items may present complex or unique cash flow structures that require special, tailored data entry. Aggregating structural information at too high a level may result in the loss of necessary detail, and the reliability of the cash flows projections may become questionable.
- Assumptions must be appropriate and tested. Model results are extremely sensitive to the assumptions used; these assumptions should be reasonable and reviewed periodically. For example, prepayment speeds can change significantly in any given rate environment. And a bank's historical prepayments experience may differ materially from vendor-supplied prepayment speeds. The model's sensitivity to changes in key material assumptions should be evaluated periodically.
- Option risk embedded in assets and funding sources should be captured effectively. Many banks have options embedded in their balance sheet through exposure to mortgage-related assets, callable or convertible advances, or other structured products. Interest rate risk measurement systems should be capable of identifying and measuring the effect of embedded options.
- Significant leverage programs should be understood fully. Management should understand fully the nature of the leverage programs and the risks of the instruments used, and effectively assess the impact of adverse rate movements or yield curve changes. Given that leverage programs often are designed to take advantage of spreads between short- and long-term rates, measurement systems should capture the effects of nonparallel shifts of the yield curve.
- Sensitivity stress tests should include a reasonable range of unexpected rate shocks; for example, stress tests should not simply approximate market expectations of a modest ratcheting up of the yield curve over the next 12 months. Bank management should provide for stress tests that include potential interest rate changes and meaningful stress situations using a sufficiently wide range in market interest rates, immediate and gradual shifts in market rates, as well as changes in the shape of the yield curve. The Interest Rate Risk Policy Statement suggests at least a 200 basis point shock over a one-year horizon.
- The variance between the model's forecasted risk levels and actual risk exposures should be analyzed routinely (sometimes called "back-testing"). This exercise will highlight areas of material variance and improve identification of errors in assumptions, inputs, or calculations.
Lessons from History Help Place Concerns About Rising Rates in Context
Current concerns about the risks of a rising rate environment should be viewed in historical context. An internal FDIC review of bank and thrift failures discloses that interest rate risk is not a common cause of insured depository institution insolvencies.
The FDIC review studied the causes of the bank insolvencies that occurred during three periods of rising rates: the period from 1978 to 1982 and the rate spikes in 1994 and 2000. The analysis revealed that no institution failures in the 1990s were caused by the movement of interest rates. However, certain insolvencies in the early 1980s, primarily of savings and loan institutions, were affected by changes in the interest rate environment. The review determined that these insolvencies followed a period of rapid and prolonged increases in short- and long-term rates, during which the yield curve was inverted (for the most part, the yield curve was inverted from September 1978 through April 1982). These institutions were heavily concentrated in longer-term, fixed-rate mortgage loans, and were also challenged by a new and unregulated market for deposits. Additional factors that contributed to these early insolvencies were economic recession, capital weakness, and regulatory forbearance. A historical depiction of institution failures, in relation to the 10-year Treasury bond yield and general periods of yield curve inversion, is shown in Chart 10. From a historical perspective, only in the unique circumstances of the early 1980s can rising rates be associated with bank or thrift insolvency.
Chart 10
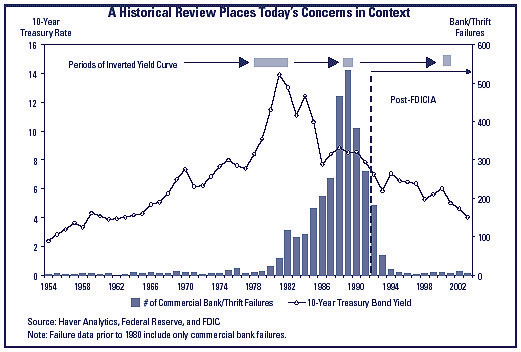
Today's environment is markedly different. Despite rising rates and a flattening yield curve, the curve remains upward sloping. The economy generally has been improving, and the regulatory environment has changed considerably. Stricter regulatory capital standards were mandated in 1988, and limits on permissible investments were adopted in 1989. Prudential standards were implemented following the enactment of the Federal Deposit Insurance Corporation Improvement Act of 1991, and interest rate risk and investment activities policy statements were issued in 1996 and 1998. In addition, the industry now relies on more advanced interest rate risk measurement and management methodologies. Taken together, these developments mitigate the level of supervisory concern about the aggregate level of interest rate risk in the industry today.
Conclusion
Interest rate risk is garnering attention given the changing rate environment and trends in aggregate bank balance sheet and income statement information. Rising rates and a flattening yield curve could pressure NIMs, particularly for institutions that exhibit liability sensitivity, given their relatively greater exposure to long-term assets. In addition, banks are exhibiting increased exposure to more volatile, rate-sensitive funding sources with degrees of optionality not fully captured by Call Report data. However, these aggregate measures of bank balance sheet and income statement composition serve only as indicators of the possible presence of interest rate risk. Off-site analysis and on-site examinations identify excessive or poorly managed interest rate risk relative to a particular institution's risk profile, earnings, and capital levels. Examination findings, while revealing weaknesses in some circumstances, overall indicate that bank risk managers are acting effectively to moderate their institutions' exposure to interest rate risk in this challenging environment.
Keith Ligon
Chief, Capital Markets Branch
The author acknowledges the assistance provided by Examiners Thomas Wiley, Lawrence Reynolds, and John Falcone in the Division of Supervision and Consumer Protection; and Financial Analyst Douglas Akers with the Division of Insurance and Research, in the preparation of this article.
1 The Federal funds rate is the interest rate at which depository institutions lend balances overnight from the Federal Reserve to other depository institutions. The intended Federal funds rate is established by the FOMC of the Federal Reserve System. Federal Reserve Board Chairman Alan Greenspan said during his February 16, 2005, monetary policy testimony to the Senate Banking Committee, "For the moment, the broadly unanticipated behavior of world bond markets remains a conundrum." (Source: Bloomberg News).
2 Blue Chip Financial Forecasts is based on a survey providing the latest in prevailing opinions about the future direction and level of U.S. interest rates. Survey participants such as Deutsche Banc Alex Brown, Banc of America Securities, Fannie Mae, Goldman Sachs & Co., and JPMorganChase provide forecasts for all significant rate indices for the next six quarters.
3 Refer to the Fourth Quarter 2004 FDIC Quarterly Banking Profile for complete 2004 industry performance results.
4 Except where noted otherwise, data are derived from the December 31, 2004, Consolidated Reports of Condition and Income (Call Reports). Call Reports are submitted quarterly by all insured national and state nonmember commercial banks and state-chartered savings banks and are a widely used source of timely and accurate financial data.
5 Long-term assets include fixed- and floating-rate loans with a remaining maturity or next repricing frequency of over five years; U.S. Treasury and agency, mortgage pass-through, municipal, and all other nonmortgage debt securities with a remaining maturity or repricing frequency of over five years; and other mortgage-backed securities (MBS) like collateralized mortgage obligations (CMOs), real estate mortgage investment conduits (REMICs), and stripped MBS with an expected average life of over three years.
6 Mortgage-related assets includes loans secured by one- to four-family residential properties, including revolving lines of credit, and closed-end loans secured by first and junior liens; mortgage pass-through securities and MBS, including CMOs, REMICs, and stripped MBS. Extension risk can be explained as follows: Changes in interest rates can pressure the value of mortgages and MBS because of the embedded prepayment option held by the mortgage debtor. These options can affect the holder of such assets adversely in a falling or rising rate environment. As rates fall, mortgages likely will experience higher prepayments, requiring the bank to reinvest the proceeds in lower-yielding assets. Conversely, as rates rise, prepayments will slow and result in a longer, extended period for principal return.
7 All ARMs are not the same, and the degree of asset sensitivity will depend on each product's unique structure. ARMs with an initial fixed-rate period of one to five years ("hybrid" loans) have grown in popularity. Freddie Mac's 2004 ARM Survey found that 40 percent of all adjustable-rate mortgages were hybrid products, primarily 3/1 and 5/1 structures. The interest rate on such hybrid loans are fixed for three or five years, respectively, adjusting annually thereafter based on some interest rate index. Accordingly, such hybrid products will not reduce liability sensitivity during the fixed-rate period of the loan.
8 See Instructions for Preparation of Consolidated Reports of Condition and Income (FFIEC 031 and 041) at RC-M-Memorandum Item 5, which provides, "Callable Federal Home Loan bank advances should be reported without regard to their next call date unless the advance has actually been called."
9 "Effective board and senior management oversight of a bank's interest rate risk activities is the cornerstone of a sound risk management process." Joint Agency Policy Statement on Interest Rate Risk, 12 FR 33166 at 33170 (1996); distributed under Financial Institution Letter 52-96 (hereafter Interest Rate Risk Policy Statement).
10 Sensitivity to market risk is rated under the Uniform Financial Institutions Rating System (UFIRS), which is used by the Federal Financial Institutions Examination Council member regulatory agencies. Under the UFIRS, each financial institution is assigned a composite rating based on an evaluation and rating of six essential components of an institution's financial condition and operations: the adequacy of capital (C), the quality of assets (A), the capability of management (M), the quality and level of earnings (E), the adequacy of liquidity (L), and the sensitivity to market risk (S). The resulting acronym is referred to as the CAMELS rating. Composite and component ratings are assigned based on a 1 to 5 numerical scale. 1 indicates the highest rating, strongest performance and risk management practices, and least degree of supervisory concern, while 5 indicates the lowest rating, weakest performance, inadequate risk management practices, and, therefore, the highest degree of supervisory concern. In general, fundamentally strong or sound conditions and practices are reflected in 1 and 2 ratings, whereas supervisory concerns and unsatisfactory performance are increasingly reflected in 3, 4, and 5 ratings.
11 A "leverage" strategy is a coordinated borrowing and investment program with the goal of achieving a positive net interest spread. Leverage programs are intended to increase profitability by leveraging the bank's capital through the purchase of earning assets using borrowed funds. While "leverage" in general defines banking, a typical leverage strategy focuses on a bank's acquisition of wholesale funding, such as Federal Home Loan Bank advances, and the targeted investment of such proceeds into bonds with a different maturity or credit rating, or both, such that a higher yield is earned from the bonds than the interest rate on the borrowings. Profitability may be achieved if a positive net interest spread is maintained, despite changes in interest rates. When improperly managed, these strategies cause increased interest rate risk and supervisory concern.